Here - the ESAFORM 2008 Conference - INSA de Lyon
Here - the ESAFORM 2008 Conference - INSA de Lyon
Here - the ESAFORM 2008 Conference - INSA de Lyon

You also want an ePaper? Increase the reach of your titles
YUMPU automatically turns print PDFs into web optimized ePapers that Google loves.
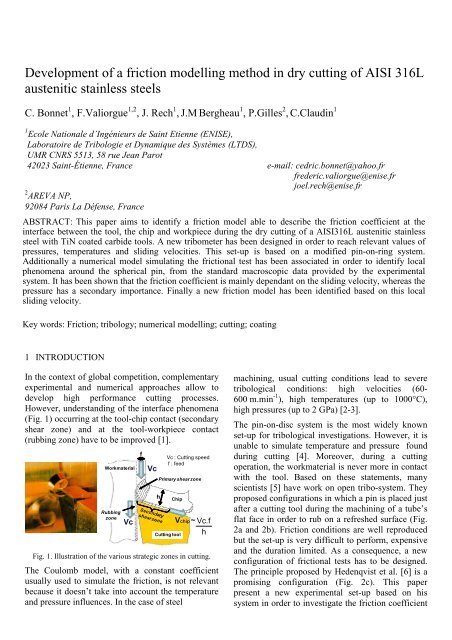
Development of a friction mo<strong>de</strong>lling method in dry cutting of AISI 316Laustenitic stainless steelsC. Bonnet 1 , F.Valiorgue 1,2 , J. Rech 1 , J.M Bergheau 1 , P.Gilles 2 , C.Claudin 11 Ecole Nationale d’Ingénieurs <strong>de</strong> Saint Etienne (ENISE),Laboratoire <strong>de</strong> Tribologie et Dynamique <strong>de</strong>s Systèmes (LTDS),UMR CNRS 5513, 58 rue Jean Parot42023 Saint-Étienne, France e-mail: cedric.bonnet@yahoo.frfre<strong>de</strong>ric.valiorgue@enise.frjoel.rech@enise.fr2 AREVA NP,92084 Paris La Défense, FranceABSTRACT: This paper aims to i<strong>de</strong>ntify a friction mo<strong>de</strong>l able to <strong>de</strong>scribe <strong>the</strong> friction coefficient at <strong>the</strong>interface between <strong>the</strong> tool, <strong>the</strong> chip and workpiece during <strong>the</strong> dry cutting of a AISI316L austenitic stainlesssteel with TiN coated carbi<strong>de</strong> tools. A new tribometer has been <strong>de</strong>signed in or<strong>de</strong>r to reach relevant values ofpressures, temperatures and sliding velocities. This set-up is based on a modified pin-on-ring system.Additionally a numerical mo<strong>de</strong>l simulating <strong>the</strong> frictional test has been associated in or<strong>de</strong>r to i<strong>de</strong>ntify localphenomena around <strong>the</strong> spherical pin, from <strong>the</strong> standard macroscopic data provi<strong>de</strong>d by <strong>the</strong> experimentalsystem. It has been shown that <strong>the</strong> friction coefficient is mainly <strong>de</strong>pendant on <strong>the</strong> sliding velocity, whereas <strong>the</strong>pressure has a secondary importance. Finally a new friction mo<strong>de</strong>l has been i<strong>de</strong>ntified based on this localsliding velocity.Key words: Friction; tribology; numerical mo<strong>de</strong>lling; cutting; coating1 INTRODUCTIONIn <strong>the</strong> context of global competition, complementaryexperimental and numerical approaches allow to<strong>de</strong>velop high performance cutting processes.However, un<strong>de</strong>rstanding of <strong>the</strong> interface phenomena(Fig. 1) occurring at <strong>the</strong> tool-chip contact (secondaryshear zone) and at <strong>the</strong> tool-workpiece contact(rubbing zone) have to be improved [1].WorkmaterialRubbingzoneVcfVchVc : Cutting speedf : feedPrimary shear zoneChipCutting toolVchip~Vc.fhFig. 1. Illustration of <strong>the</strong> various strategic zones in cutting.The Coulomb mo<strong>de</strong>l, with a constant coefficientusually used to simulate <strong>the</strong> friction, is not relevantbecause it doesn’t take into account <strong>the</strong> temperatureand pressure influences. In <strong>the</strong> case of steelmachining, usual cutting conditions lead to severetribological conditions: high velocities (60-600 m.min -1 ), high temperatures (up to 1000°C),high pressures (up to 2 GPa) [2-3].The pin-on-disc system is <strong>the</strong> most wi<strong>de</strong>ly knownset-up for tribological investigations. However, it isunable to simulate temperature and pressure foundduring cutting [4]. Moreover, during a cuttingoperation, <strong>the</strong> workmaterial is never more in contactwith <strong>the</strong> tool. Based on <strong>the</strong>se statements, manyscientists [5] have work on open tribo-system. Theyproposed configurations in which a pin is placed justafter a cutting tool during <strong>the</strong> machining of a tube’sflat face in or<strong>de</strong>r to rub on a refreshed surface (Fig.2a and 2b). Friction conditions are well reproducedbut <strong>the</strong> set-up is very difficult to perform, expensiveand <strong>the</strong> duration limited. As a consequence, a newconfiguration of frictional tests has to be <strong>de</strong>signed.The principle proposed by He<strong>de</strong>nqvist et al. [6] is apromising configuration (Fig. 2c). This paperpresent a new experimental set-up based on hissystem in or<strong>de</strong>r to investigate <strong>the</strong> friction coefficient
occurring at tool-chip-workpiece interfaces during<strong>the</strong> high speed dry cutting of a AISI 316L stainlesssteel with TiN coated carbi<strong>de</strong> tools.(a)Fig. 2. Various technologies of tribometer (a) Olsson’stribometer [5], (b) Zemzemi’s tribometer [5], (c) He<strong>de</strong>nqvist’stribometer [6].(c)2 EXPERIMENTAL SET-UP2.1 Material <strong>de</strong>scriptionA cylindrical bar, ma<strong>de</strong> of AISI 316L, is fixed ontoa la<strong>the</strong> chuck, as illustrated in Figure 3.4-Pneumatic jack6-DynamometerForcesmeas.FtFn2-Cutting toolrefreshing<strong>the</strong> surface5-Pin hol<strong>de</strong>r(b)3- Pin :Carbi<strong>de</strong> +TiN coating7-Thermistor1-Workpiece :316LHeat Fluxmeas.Fig. 3. Tribometer <strong>de</strong>signed for cutting applications.A pin ma<strong>de</strong> of cemented carbi<strong>de</strong> with a TiN coatingand having a spherical geometry Ø 9 mm is pressedonto <strong>the</strong> cylindrical surface by means of a jack.Thanks to <strong>the</strong> helical trajectory of pin, <strong>the</strong> surfacecontact is continuously regenerated. The pin ismaintained by an instrumented pin-hol<strong>de</strong>r able toprovi<strong>de</strong> data about <strong>the</strong> instantaneous heat fluxentering into <strong>the</strong> pin [7]. It is fixed onto adynamometer, in or<strong>de</strong>r to provi<strong>de</strong> <strong>the</strong> apparentnormal and tangential force (macroscopic forces).After each friction test, a cutting tool refreshes <strong>the</strong>surface and a belt finishing operation is performed inor<strong>de</strong>r to obtain a very low initial surface roughness.2.2 Testing conditionsTesting conditions have to be chosen in accordancewith <strong>the</strong> frictional conditions estimated along <strong>the</strong>tool/chip/workpiece interfaces. For instance, <strong>the</strong>machining of a AISI 316L with a TiN coated carbi<strong>de</strong>tool in dry cutting conditions is around Vc~120m.min -1 . Based on Figure 1, it is of evi<strong>de</strong>nce that <strong>the</strong>macroscopic sliding speed at <strong>the</strong> tool-workpieceinterface is almost equal to <strong>the</strong> cutting speed ~ 120m.min -1 . On <strong>the</strong> chip-tool interface, <strong>the</strong> averagesliding velocity <strong>de</strong>pends on <strong>the</strong> compression ratio β,which is around 2. So at this interface, <strong>the</strong>macroscopic velocity is 2 times lower than <strong>the</strong>cutting speed 60 m.min -1 . As a consequence, <strong>the</strong>characterization of <strong>the</strong> frictional properties at <strong>the</strong>tool/chip/workpiece interface needs performingfriction tests in <strong>the</strong> following conditions: slidingvelocity: 60-120 m.min -1 , pressure: 1-2 GPa [2].2.3 Experimental resultsThe sliding velocity was <strong>the</strong> single modifiedparameter in this work. A normal force equal toabout 1000 N has been applied onto pins, which leadto an average pressure of 1.8 GPa.The first output data provi<strong>de</strong>d by this set-up is <strong>the</strong>ratio between <strong>the</strong> tangential and <strong>the</strong> normal force.This coefficient can be <strong>de</strong>fined as an apparentfriction coefficient Ftµapp= . (1)FThe evolution of µ app versus sliding velocity isplotted in Figure 4. This confirms that it is notrelevant to consi<strong>de</strong>r <strong>the</strong> friction coefficient asin<strong>de</strong>pen<strong>de</strong>nt from sliding speed. Over 120 m.min -1 , amodification of <strong>the</strong> frictional behavior is observed.nWorkmaterial : AISI 316 L steelPin : Carbi<strong>de</strong> + TiN coatingSphere diameter : 9 mmFig. 4. Apparent friction coefficient.
The evolution of heat flux transmitted to <strong>the</strong> pin φ pinversus sliding velocity is plotted in Figure 5. Itappears that heat flow increases with <strong>the</strong> velocity,which is coherent with <strong>the</strong> fact that more energy isproduced and dissipated. The frictional behaviourmay be modified over a certain value (saturation).The Johnson-Cook parameters used have beenchosen thanks to <strong>the</strong> works of Umbrello et al. [8].Moreover our mo<strong>de</strong>l consi<strong>de</strong>rs <strong>the</strong> hypo<strong>the</strong>sis fromBow<strong>de</strong>n et al. [9] with: µ plast <strong>de</strong>scribes <strong>the</strong> plastic<strong>de</strong>formation part of µ app and µ adh corresponds to <strong>the</strong>adhesive friction coefficient: µapp= µadh+ µ . (3)plastThe mo<strong>de</strong>l uses <strong>the</strong>rmo-<strong>de</strong>pen<strong>de</strong>nt properties for <strong>the</strong>WC/Co substrate [6] and <strong>the</strong> AISI 316L workpiece:Workmaterial : AISI 316 L steelPin : Carbi<strong>de</strong> + TiN coatingSphere diameter : 9 mmFig. 5. Heat flux measured into <strong>the</strong> pin.3 NUMERICAL POST-TRAITEMENTA finite element mo<strong>de</strong>l, simulating <strong>the</strong> sameexperimental conditions of plowing and friction, hasbeen <strong>de</strong>veloped. Macroscopic experimental data µ appand φ pin are used to fit <strong>the</strong> numerical mo<strong>de</strong>l for 3sliding velocities: 60-90-120 m.min -1 .3.1 Description of <strong>the</strong> mo<strong>de</strong>lVsVsTable1. AISI 316L workpiece propertiesParameter Temperature ValueSpecific heat 20 450(J.kg -1 .°C -1 ) 300 545500 570800 625Thermal Conductivity(W.m -1 .°C -1 )1100 67020 14300 18500 21800 241100 29Density (kg.m -3 ) 20 8000300 7890500 7800800 76601100 75103.2 Thermal boundaries conditionsThe mo<strong>de</strong>l inclu<strong>de</strong>s <strong>the</strong> heat generation induced by<strong>the</strong> friction in addition to <strong>the</strong> heat dissipated by <strong>the</strong>plastic <strong>de</strong>formation (plowing) of <strong>the</strong> workmaterial.As shown by Figure 7, <strong>the</strong> frictional heat flux φ frictionis dissipated at <strong>the</strong> interface in a narrow layer,whereas <strong>the</strong> plastic <strong>de</strong>formation heat flux φ plast isdissipated only in <strong>the</strong> workpiece in a large volume.Fig. 6 Geometry of <strong>the</strong> numerical friction mo<strong>de</strong>l.The 3D mo<strong>de</strong>l (Fig.6) is based on <strong>the</strong> work ofZemzemi et Al. [5]. Consi<strong>de</strong>ring <strong>the</strong> high strain andstrain rate, an explicit formulation has been chosen.A <strong>the</strong>rmo-mechanical mo<strong>de</strong>l has been programmedwith ABAQUS explicit.A Johnson-Cook flow stress mo<strong>de</strong>l has been used tomo<strong>de</strong>l <strong>the</strong> AISI 316L steel. This mo<strong>de</strong>l is <strong>de</strong>pen<strong>de</strong>nton strainε p, strain-rate ε&pand temperature T so asto observe softening phenomenon:σeqm⎡ ⎛ & ε ⎞⎤⎡np ⎛ T − T ⎞ ⎤0= ⎣⎡ A + B( εp) ⎦⎤ . ⎢1 + C.ln . ⎢1−⎥⎜ ⎥ε ⎟ ⎜ ⎟⎢⎣ ⎝&0 ⎠⎥⎦ ⎢ ⎝ TF− T⎣0 ⎠ ⎥⎦(2)Plastic <strong>de</strong>form ationheat fluxTransm itted to part 1Plastic <strong>de</strong>form ationheat fluxD iffused in part 2Friction heat fluxtransm itted to part 1Friction heat fluxtransm itted to part 2Fig. 7. Heat flux sources during friction tests.3.3 Fitting methodFor each testing condition simulated, <strong>the</strong> in<strong>de</strong>ntation<strong>de</strong>pth h, <strong>the</strong> adhesive friction coefficient µ adh and <strong>the</strong>heat partition coefficient α have to be <strong>de</strong>termined. Inthis aim, an iterative method, presented in Figure 8has been <strong>de</strong>veloped. The experiments has provi<strong>de</strong>d
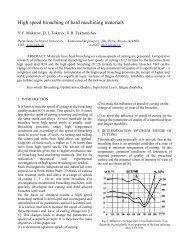
Investigation of friction in warm forging of AA6082B. Buchner, A. Weber, B. BuchmayrChair of Metal Forming, University of Leoben – Franz-Josef-Strasse 18, 8700 Leoben, AustriaURL: www.metalforming.at e-mail: metalforming@unileoben.ac.atABSTRACT: This paper presents an experimental investigation of friction in hot forging of AA6082, whichis a standard forging alloy in automotive engineering, mechanical engineering and in naval architecture, byemploying a modified ring-on-disc test. The experiments were performed with three different commercialgraphite-based lubricants and at various loads, sliding velocities and specimen surface conditions. In addition,some tests were performed without lubrication.KEYWORDS: Friction, Warm Forging, Aluminium1 INTRODUCTIONForged parts ma<strong>de</strong> of aluminium play a significantrole as components of light weight structures in <strong>the</strong>automotive and aerospace industry. The main parametersinfluencing forging processes are <strong>the</strong> flow curvesof <strong>the</strong> specimen material, <strong>the</strong> heat transfer at <strong>the</strong> contactarea and <strong>the</strong> friction in <strong>the</strong> die-workpiece interface[1, 2]. The exact knowledge of <strong>the</strong> latter is paidmuch attention to as it affects power requirements,material flow, die filling, tool life and workpiece quality.In or<strong>de</strong>r to un<strong>de</strong>rstand <strong>the</strong> tribological processesand interactions in <strong>the</strong> tool-workpiece interface, <strong>the</strong>influences of <strong>the</strong> load collective and <strong>the</strong> surface conditionson friction were investigated systematically. Theexperiments were performed with a facility based on<strong>the</strong> ring-on-disc test introduced by Schey [3].2 EXPERIMENTAL WORKforce is realised by ano<strong>the</strong>r load cell, <strong>the</strong> rotationalspeed of <strong>the</strong> specimen is calculated from <strong>the</strong> speed of<strong>the</strong> servo motor. The specimen is brought to forgingtemperature by an inductive heating system, whereas<strong>the</strong> tool is heated by a heating sleeve. The lubricantis sprayed onto <strong>the</strong> tool by an automatic applicationsystem that allows a reproducible dosing. The testing<strong>de</strong>vice is controlled by a programmable logic controlunit (PLC), <strong>the</strong> data acquisition is realised by a measurementamplifier that is connected to a commercialpersonal computer.The tribometer has a maximum upsetting force of approximately100 kN and provi<strong>de</strong>s a maximum torqueof more <strong>the</strong>n 800 Nm on <strong>the</strong> rotary disc. The rotationalspeed can be up to 1.7 s −1 . The sliding distanceis not constrained by <strong>the</strong> testing <strong>de</strong>vice. Themaximum temperature of <strong>the</strong> specimen is 1200 °C,<strong>the</strong> maximum temperature of <strong>the</strong> tool is 450 °C. Thetemperatures can be kept constant in an interval of±2.5 °C.2.1 Testing <strong>de</strong>viceFigure 1 shows <strong>the</strong> Rotational Forging Tribometer.The circular motion is supplied from <strong>the</strong> bottom si<strong>de</strong>by means of a servo motor and a bevel gear system.The compression force is applied by a hydraulic cylin<strong>de</strong>rfrom <strong>the</strong> top si<strong>de</strong>. The specimen (workpiece)is mounted on a rotary disc and transmits <strong>the</strong> frictionaltorque to <strong>the</strong> pivot-mounted ring-shaped tool.The tool is supported by a load cell via a lever armwhich enables an accurate measurement of <strong>the</strong> frictionaltorque. The acquisition of <strong>the</strong> compressionFigure 1: Rotational Forging Tribometer.1
2.2 Toolkit and specimen geometryFigure 2 shows <strong>the</strong> toolkit used in <strong>the</strong> investigations.The ring-shaped workpiece is placed in <strong>the</strong> cavity ofa container and compressed by an annular tool with<strong>the</strong> same inner and outer diameter as <strong>the</strong> specimen.Sliding on <strong>the</strong> bottom face of <strong>the</strong> workpiece is preventedby preparing <strong>the</strong> bottom of <strong>the</strong> cavity with radialridges, and <strong>the</strong> container is split in or<strong>de</strong>r to alloweasy removal of <strong>the</strong> tested specimen. The temperaturesof die and workpiece are measured via <strong>the</strong>rmocouples. Tool and specimen are ma<strong>de</strong> of hot worktool steel 1.2344 (har<strong>de</strong>ned to 55 HRC) and AA6082,respectively.seven tests were performed with exception of series9, where just two experiments were carried out perload level due to heavy wear at some stages.The experiments were carried out in <strong>the</strong> followingway: First, <strong>the</strong> tool was brought to operating temperature.When <strong>the</strong> testing sequence was started by<strong>the</strong> PLC, <strong>the</strong> specimen was heated, and <strong>the</strong> final temperaturewas kept constant for 180 s in or<strong>de</strong>r to allowtemperature equalisation. Then, <strong>the</strong> lubricant was appliedby <strong>the</strong> automatic spraying <strong>de</strong>vice (series 1–8).After lubricating, <strong>the</strong> execution of <strong>the</strong> test itself wasstarted. In or<strong>de</strong>r to avoid an interaction of differentinfluences, <strong>the</strong> specimens were compressed in a firststep and <strong>the</strong>reafter <strong>the</strong> rotation began.Table 1: Lubricant test matrix.lubricant typerec. dilution ratioA dispersion of graphite in water 1:15B dispersion of graphite in water 1: 7C emulsion of a dispersion of 2: 1graphite in water and mineral oilFigure 2: Toolkit used in <strong>the</strong> investigation.2.3 Experimental <strong>de</strong>tailsThe experiments were performed with three differentcommercial graphite-based lubricants (see Table 1)and at various loads (20–150 MPa), sliding velocities(10–100 mm/s) and specimen surface conditions(turned, sand blasted). In addition, some tests wereperformed without lubrication. The changing parametersof <strong>the</strong> test series are summarised in Table 2.On <strong>the</strong> one hand, <strong>the</strong> sliding velocities were varied at<strong>the</strong> same interface conditions (series 1–4), and on <strong>the</strong>o<strong>the</strong>r hand, <strong>the</strong> interface conditions were changed atconstant sliding speeds (series 5–9). Tool and workpiecetemperature were set to 250 °C and 450 °C, respectively,and <strong>the</strong> relative displacement was 70 mm.For each parameter set and when pick-up occurred,<strong>the</strong> tool was prepared with grit 800 sandpaper and3 µm polishing suspension. Within a parameter set,Table 2: Parameters of <strong>the</strong> test series.series no. lubricant surface cond. velocity, mm/s1 B sand-blasted 102 B sand-blasted 403 B sand-blasted 704 B sand-blasted 1005 B, 80 % 1 sand-blasted 406 B, 80 % 1 turned 407 A sand-blasted 408 C sand-blasted 409 without sand-blasted 401 In series 5–6, 20 % less lubricant than in series 1–4 was used.2.4 Evaluation of <strong>the</strong> testsThe evaluation of <strong>the</strong> experiments was performed inthree steps (see Figure 3):1. First, <strong>the</strong> stationary region of <strong>the</strong> experimentwas <strong>de</strong>termined from <strong>the</strong> velocity curve: Constantconditions were assumed in <strong>the</strong> intervalwhere <strong>the</strong> actual velocity at time step i wasequal to or greater <strong>the</strong>n <strong>the</strong> reference velocity.2. In <strong>the</strong> stationary region, <strong>the</strong> mean values of normalpressure σ n , friction stress τ f and frictioncoefficient µ were calculated by <strong>the</strong> following2
equations:σ n =τ f =t1f · (te)e −t b∑ σ n,i , (1)i = t bt1f · (te)e −t b∑ τ f ,i , (2)i = t bµ = τ fσ n. (3)<strong>Here</strong>in, t b and t e indicate <strong>the</strong> begin and <strong>the</strong> endof <strong>the</strong> stationary region and f is <strong>the</strong> samplingrate of data acquisition. σ n,i and τ f ,i are <strong>the</strong>normal pressure and friction stress at time incrementi, respectively.only be explained by <strong>the</strong> adhesion <strong>the</strong>ory, extensivewelding in <strong>the</strong> tool-workpiece interface has to be assumedin <strong>the</strong>se cases. This assumption was verifiedby a visual inspection of <strong>the</strong> surfaces and by a comparisonof <strong>the</strong> lifting forces of <strong>the</strong> friction facility after<strong>the</strong> tests.The shear yield stress of AA6082 at an interface temperatureof 350 °C was <strong>de</strong>termined to be k = 45–50 MPa. From <strong>the</strong> performed experiments, shearingof <strong>the</strong> specimen (and <strong>the</strong>refore sticking friction) canbe presumed at normal pressures equal to or greaterthan 65 MPa. Micrographs confirmed that (most of)<strong>the</strong> relative motion was done by shearing in subsurfacelayers of <strong>the</strong> specimens at all pressure levels.3. For easier illustration, <strong>the</strong> σ n -, τ f - and µ-values of each parameter set were averaged to<strong>the</strong> mean values σ n,m , τ f ,m and µ m and <strong>the</strong>standard <strong>de</strong>viations were calculated. In or<strong>de</strong>rto avoid falsified results, apparent outliers werenot consi<strong>de</strong>red in this calculation.Figure 4: Results of <strong>the</strong> tests without lubrication.3.2 Results of <strong>the</strong> tests with lubricant3 RESULTSFigure 3: Evaluation of <strong>the</strong> measurements.3.1 Results of <strong>the</strong> tests without lubricantThe friction stresses and friction coefficients obtainedfrom <strong>the</strong> experiments without lubrication are presentedin Figure 4. Even at <strong>the</strong> lowest load level,<strong>the</strong> asymptotic behavior of <strong>the</strong> friction stress is wellpronounced; at normal loads higher than 65 MPa, amore or less steady state is reached. When regarding<strong>the</strong> friction coefficient, a <strong>de</strong>crease from an initialvalue of µ = 1.83 (!) to a final value of µ = 0.34 isobserved. As a friction coefficient higher than 1 canFigure 5 presents <strong>the</strong> friction stress at different interfaceconditions. For comparison, <strong>the</strong> region of <strong>the</strong>velocity <strong>de</strong>pen<strong>de</strong>nt curves is indicated hatched. Exceptof series 5, all series have a maximum value at anormal stress of 130 MPa and have similar or lowervalues at contact loads of 150 MPa. However, <strong>the</strong>high friction stress of series 5 at a normal pressureof 150 MPa was due to material extru<strong>de</strong>d in <strong>the</strong> gapbetween tool and container and did not indicate ano<strong>the</strong>rten<strong>de</strong>ncy. In contrast to <strong>the</strong> o<strong>the</strong>r curves, series 7shows a sharp rise from σ n = 100 to σ n = 130 MPa.When comparing <strong>the</strong> sand-blasted with <strong>the</strong> turned surface,<strong>the</strong> curve of <strong>the</strong> untreated specimen rises significantlysteeper than that of <strong>the</strong> sand-blasted workpiece.The lowest friction stresses are obtained with lubricantC (series 8), whereas <strong>the</strong> highest friction stressesare caused by <strong>the</strong> conditions present in series 7 (lubricantA). Figure 6 shows <strong>the</strong> friction coefficients in<strong>de</strong>pen<strong>de</strong>nce of <strong>the</strong> surface conditions.3
In general, <strong>the</strong> friction coefficient increases significantlyat low normal pressures and stays approximatelyconstant or shows an light <strong>de</strong>crease at elevatedcontact stresses. Lubricant A has a well pronouncedlocal maximum at σ n = 130 MPa, and <strong>the</strong>friction coefficient rises at high normal pressured inseries 5. However, <strong>the</strong> behavior of series 6 is contrary:<strong>Here</strong>, <strong>the</strong> friction coefficient rises from <strong>the</strong> beginning,reaches a maximum at a normal pressure of 130 MPa,and <strong>de</strong>creases slightly at σ n = 150 MPa.confirmed that shearing was restricted to <strong>the</strong> graphitelayer and <strong>the</strong> asperities; <strong>the</strong> bulk material of <strong>the</strong> specimenwas not affected.4 CONCLUSIONSThe present analysis aimed in <strong>the</strong> characterisation of<strong>the</strong> load collective and <strong>the</strong> interface conditions onfriction. From this point of view, especially two conclusionscan be ma<strong>de</strong>:1. As in solid lubricated interfaces (nearly) allshearing is done in <strong>the</strong> lubricant layer, <strong>the</strong> lubricantitself and <strong>the</strong> surface conditions of <strong>the</strong>friction partners are <strong>the</strong> dominating parametersof <strong>the</strong> tribological system.2. When regarding <strong>the</strong> load collective, <strong>the</strong> effectof normal pressure was in <strong>the</strong> observed rangemore significant than <strong>the</strong> influence of <strong>the</strong> slidingvelocity.Figure 5: Friction stresses in <strong>the</strong> tests with lubrication. Theregion of <strong>the</strong> velocity <strong>de</strong>pen<strong>de</strong>nt curves is indicated hatched.The results were compared to <strong>the</strong> results of a previousstudy [4] employing a pin-on-disc test for lubricantevaluation, and good qualitative agreement was foundin terms of friction coefficient and friction evolutionduring <strong>the</strong> tests.ACKNOWLEDGEMENTThe authors want to thank <strong>the</strong> fe<strong>de</strong>ral province of Styria(”Zukunftsfonds Steiermark”, Project 19) for financing <strong>the</strong>project and Fuchs Schmiermittel GmbH and Acheson Industriesfor <strong>the</strong> provision of <strong>the</strong> lubricants.REFERENCESFigure 6: Friction coefficients in <strong>the</strong> tests with lubrication. Theregion of <strong>the</strong> velocity <strong>de</strong>pen<strong>de</strong>nt curves is indicated hatched.It has to be stated that all lubricants investigated reducedfriction significantly compared to <strong>the</strong> dry frictioncondition. In fact, lubricant A (series 7) thatshowed <strong>the</strong> poorest lubricating effect reduced <strong>the</strong> frictionstress about 80 %, and lubricant C (series 8) reducedfriction about more than 90 %. Moreover, alllubricants prevented <strong>the</strong> tool from wear. Micrographs[1] P. Groche and U. Weiss. Numerical i<strong>de</strong>ntification of forgingparameters. In Mo<strong>de</strong>lling of Metal Forming Processes: Proceedingsof <strong>the</strong> Euromech 233 Colloquium, pages 237–244,Sophia Antipolis (France), 1988.[2] R. G. Snape, S. E. Clift, A. N. Bramley, and A. N.McGilvray. Forging mo<strong>de</strong>lling – sensitivity to input parametersusing FEA. In 12th National <strong>Conference</strong> on ManufacturingResearch – Advances in Manufacturing TechnologyX, pages 51–55, Bath (UK), 1996.[3] J. A. Schey. Tribology in Metalforming. Friction, Lubricationand Wear. American Society for Metals, Ohio (USA),1983.[4] B. Buchner, G. Ma<strong>de</strong>rthoner, and B. Buchmayr. Characterisationof different lubricants concerning <strong>the</strong> friction coefficientin forging of AA2618. Journal of Materials ProcessingTechnology, 198(1–3):41–47, <strong>2008</strong>.4
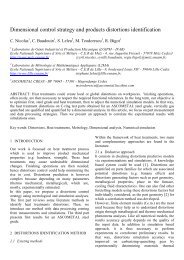
Process parameters influence on friction coefficient in sheet formingoperationsE. Ceretti 1 , A. Fiorentino 1 , C. Giardini 21 University of Brescia, Dept. of Mechanical and Industrial Engineering - Via Branze 38, 25123 Brescia, ItalyURL: www.ing.unibs.it/tecmece-mail: elisabetta.ceretti@unibs.it; antonio.fiorentino@unibs.it2 University of Bergamo, Dept. of Design & Technologies - Viale Marconi 5, 20044 Dalmine (BG), Italye-mail: claudio.giardini@unibg.itABSTRACT: In conventional sheet forming processes, such as stamping or drawing, significant contactphenomena take place between workpiece and die surfaces. Especially, relative motion and normal loadsgenerate friction which influences some aspects of processes such as material flow, tools wear and life andtotal force nee<strong>de</strong>d to complete <strong>the</strong> process. In <strong>the</strong> current paper an experimental test campaign has beencarried out using a large scale pin-on-disk <strong>de</strong>vice <strong>de</strong>signed and realized by <strong>the</strong> Authors to investigate <strong>the</strong>influence of pressure, sliding velocity and temperature. The purpose is to test <strong>the</strong> <strong>de</strong>veloped <strong>de</strong>vice and to findwhich and how <strong>the</strong>se parameters mostly affect friction. The pin-on-disk test consists of two specimens, a pinand a plate representing respectively die and workpiece, which are compressed by means of a known forceand <strong>the</strong>n moved one over <strong>the</strong> o<strong>the</strong>r. Compression and friction forces are sampled during <strong>the</strong> tests and <strong>the</strong>friction coefficient is estimated as <strong>the</strong> ratio of <strong>the</strong>se two forces. The tested materials are H13 die steel onFeP04 and AZ31 sheets.Keywords: sheet forming, friction, contact problems, temperature, pressure, velocity.1 INTRODUCTIONIn conventional manufacturing operation significantcontact phenomena take place between tool andworkpiece. Due to this contact and <strong>the</strong> resultingsurface interactions, friction is generated. Frictionknowledge is very important because it affects manyaspects of manufacturing processes, such as <strong>the</strong>required force, <strong>the</strong> die wear and in some cases <strong>the</strong>process feasibility.To investigate and to <strong>de</strong>termine <strong>the</strong> friction valueseveral tests, such as ring test [1] and strip test [2],and <strong>the</strong> Pin-on-Disk [3] have been introduced. Inrecent years many Authors have proposed newmethods to evaluate friction, for example <strong>the</strong>modified LDH [4], <strong>the</strong> Twist Compression Test [5].Among <strong>the</strong>se tests Pin-on-Disk (PoD) allows todirectly measure <strong>the</strong> compression (F) and friction(T) forces and to estimate <strong>the</strong> friction coefficient(µ=T/F) using one single couple of surfaces incontact.In previous works <strong>the</strong> Authors studied <strong>the</strong> influenceof contact pressure, sliding velocity and materialroughness on friction coefficient by using a self<strong>de</strong>signedPin-on-Disk equipment [6, 7, 8]. In <strong>the</strong>seworks, <strong>the</strong> H13 steel and different die coatings weretested on AISI 5115 and on Series 1 Aluminiumpainted sheets. The i<strong>de</strong>a was to i<strong>de</strong>ntify <strong>the</strong><strong>de</strong>pen<strong>de</strong>nce of friction on <strong>the</strong> process parametersand to implement it in FE co<strong>de</strong>s.The aim of <strong>the</strong> present work is to study <strong>the</strong> influenceof contact pressure, sliding velocity and temperatureon friction while forming different materials, namely<strong>de</strong>ep drawing steel FeP04 and AZ31 Magnesiumalloy sheets. Since this latter is characterized by ahigh formability in warm forming [9], <strong>the</strong>temperature influence was studied too.2 EXPERIMENTAL EQUIPMENTThe experimental <strong>de</strong>vice (Fig. 1 left) is a large scalePin-on-Disk tribometer <strong>de</strong>signed by <strong>the</strong> Authors [7].The friction coefficient is evaluated by pushing intocontact two components called Pin and Plate. ThePin (a cylin<strong>de</strong>r with a diameter of 12 mm and acorner radius of 2 mm) stands for <strong>the</strong> die (or more ingeneral <strong>the</strong> tool) and is mounted on a carriage whichcan move orthogonally with respect to <strong>the</strong> platesurface. The Plate (flat) represents <strong>the</strong> workpieceand it is mounted on a disk that rotates so
<strong>de</strong>termining a relative movement between <strong>the</strong> twosurfaces whose parallelism is guaranteed by <strong>the</strong>accuracy of <strong>the</strong> pin realization and of its holdingsystem. The two bodies are kept in contact by meansof a hydraulic cylin<strong>de</strong>r acting on <strong>the</strong> carriage. Theuse of a pressure transducer and load cells allows tomeasure <strong>the</strong> normal (F) and <strong>the</strong> friction (T) forcesacting between pin and plate. The dynamic frictioncoefficient can be estimated by using <strong>the</strong> Coulombrelationship (µ=T/F).The test data are collected by an acquisition systemsampling and processing <strong>the</strong> transducer signals.To carry out tests at different working temperaturesan additional <strong>de</strong>vice for heating <strong>the</strong> plate was used.This heating system (Fig. 1 right) consists of a baseplaced between <strong>the</strong> disk and <strong>the</strong> plate and containinga heating rod. A feedback system based on<strong>the</strong>rmocouples positioned one un<strong>de</strong>r <strong>the</strong> plate andone in <strong>the</strong> rod, keeps <strong>the</strong> plate at <strong>the</strong> <strong>de</strong>sired constanttemperature (up to 310°C).3 EXPERIMENTAL TESTSTests were conduced using H13 steel pins on AZ31magnesium alloy and on FeP04 <strong>de</strong>ep drawing steelplates.The experimental campaign was <strong>de</strong>signed as ageneral full factorial experiment with multiplefactors and multiple levels. Each factor combinationwas performed with 3 replications. The consi<strong>de</strong>redfactors were: velocity and contact pressure for bothFeP04 and AZ31. Temperature influence wasstudied on AZ31 due to its higher formability atwarm temperature.Since <strong>the</strong> forces exchanged between punch, die andblank hol<strong>de</strong>r with <strong>the</strong> material un<strong>de</strong>r <strong>de</strong>formation arestrictly related with its yield strength in stampingoperations, <strong>the</strong> contact pressures were chosen asgiven percentage of <strong>the</strong> yield stress itself. In such away, it was also possible to consi<strong>de</strong>r <strong>the</strong> yield stressreduction due to <strong>the</strong> temperature influence for AZ31alloy. All tests were performed in dry conditions andwith <strong>the</strong> same sliding length.The tests summary is reported in Table 1.Table 1 – Design of <strong>the</strong> experiments.Plate FeP04 <strong>de</strong>ep drawing steel sheet (t=2 mm)Pin H13 steelVelocity 21 – 42 mm/sPressure 7.5 – 15 – 27% σ 0Temperature 20°Cσ 0 170 MPaLubrication DryPlate AZ31 magnesium alloy sheet (t=1 mm) Pin H13 steelVelocity 21 – 42 mm/sPressure 7.5 – 15% σ 0Temperature 200 – 250 – 300 °Cσ 0 (T) 127 – 86 – 63 MPaLubrication DryThe working procedure adopted for <strong>the</strong> tests was:• specimens surfaces cleaning;• machine set-up and compression load (F)application;• temperature assessment (if necessary);• plate movement and data acquisition;• load removal.Each repetition was performed with a new pin andplate couple.4 EXPERIMENTAL RESULTS AND ANALYSISThe results were statistically analyzed and comparedto i<strong>de</strong>ntify which of <strong>the</strong> tested parameterssignificantly affects <strong>the</strong> µ behaviour and how itdoes. Single and multiple interactions wereconsi<strong>de</strong>red too.4.1 FeP04 resultsThe typical friction coefficient behaviour duringFeP04 tests is shown in Fig. 2. It is characterized byan initial transient (A) followed by <strong>the</strong> steady state(B).The friction coefficient for each test was estimatedas <strong>the</strong> average value in <strong>the</strong> steady state interval (B).MOTORDISKPLATETPINFPTHEATING RODANDTHERMOCOUPLECARRIAGECASELCHYDRAULICCYLINDERTHERMOCOUPLEPLATEFig. 1. PoD (left) and heating <strong>de</strong>vice (right).
Table 2 reports <strong>the</strong> experimental friction valueresults in terms of mean and standard <strong>de</strong>viation,estimated consi<strong>de</strong>ring three repetitions for each testparameters combination.µ0.080.060.040.02FeP04 vs vs H13 H13 | p | p = = 7.5%0σ- 0 v - v = = 4242mm/sA00 0.5 1 time [s]Fig. 2. Example of <strong>de</strong>tected friction profile for FeP04.Bpressure causes an increase of friction for both <strong>the</strong>sliding velocities. Consi<strong>de</strong>ring sliding velocity Fig. 4seems to <strong>de</strong>monstrate a <strong>de</strong>pen<strong>de</strong>nce of friction onvelocity, but this is not confirmed by <strong>the</strong> statisticaltest (see Fig. 3).4.2 AZ31 resultsA typical friction profile for AZ31 tests is shown inFig. 5: after an initial transient (A) <strong>the</strong> curve growsas <strong>the</strong> two surfaces sli<strong>de</strong> (B). The slope in B intervalincreases as <strong>the</strong> temperature increases.Also for AZ31 sheets, <strong>the</strong> friction coefficient wasestimated as <strong>the</strong> mean value in <strong>the</strong> B interval.The results are reported in Table 3 and Fig. 6 where<strong>the</strong> parameters effect on friction is shown.Table 2 – FeP04 experimental results summary.Plate FeP04Pin H13Velocity Pressure ratio µ[mm/s] [% σ 0 ] mean σ7.5 % 0.080 0.01121 15 % 0.125 0.01827 % 0.143 0.0377.5 % 0.082 0.01742 15 % 0.094 0.00927 % 0.140 0.019pp*vvPareto Chart of <strong>the</strong> Standardized Effects(α=0.05)Standardized EffectFig. 3. Pareto Chart for FeP04 results.[% σ 0 ] p7.515.0 p27.0Interaction Plot (data means) for µ21 [mm/s]Fo limitFo42 [mm/s]0.140.120.10AZ31 vs H13 | T = 300°C - p = 15% σFeP04 vs H13 | p = 7.5% ∠ 0 - v = 0 - v = 21mm/s42 mm/sµAB0.40.30.20.100 0.5 1 1.5 2 2.5 time 3[s]Fig. 5. Example of friction profile for AZ31.Table 3 – AZ31 experimental results summary.Plate AZ31Pin H13Temp. Velocity Pressure ratioµ[°C] [mm/s] [% σ 0 ] mean σ200217.5 % 0.205 0.08615 % 0.179 0.055427.5 % 0.216 0.09015 % 0.167 0.098250217.5 % 0.314 0.09515 % 0.320 0.044427.5 % 0.265 0.06915 % 0.213 0.031300217.5 % 0.630 0.05115 % 0.274 0.013427.5 % 0.449 0.01815 % 0.366 0.0540.140.120.100.087.5 % 15.0 % 27.0 %[mm/s] v21v42Fig. 4. FeP04 parameters interaction effects.Fig. 3 compares <strong>the</strong> Fisher reference values with <strong>the</strong>relative F 0 value estimated for single and multipleparameter interactions. The comparison shows thatpressure strongly influences friction. In particularFig. 4 shows <strong>the</strong> parameters interaction effectswhere it is possible to see how an increase of0.08In particular, Fig. 6 compares <strong>the</strong> estimated Fishervalues for <strong>the</strong> AZ31 results. It is possible to observethat temperature and contact pressure affect frictionin <strong>the</strong> tested ranges, while velocity does not. Inparticular, <strong>the</strong> most affecting parameter istemperature which causes a friction raise, while anincreasing contact pressure causes a frictionreduction as shown in Fig. 7.An explanation of <strong>the</strong> temperature influence can begiven as follows: as <strong>the</strong> temperature increases, <strong>the</strong>material surface (at peaks roughness level) is more<strong>de</strong>formed. This means that, for <strong>the</strong> same pressureratio, <strong>the</strong> real contact area and, consequently, <strong>the</strong>
force nee<strong>de</strong>d to move <strong>the</strong> pin (friction force)increase. This is in agreement with <strong>the</strong> experiencewhere hot forming causes higher friction forces.Observing <strong>the</strong> contact surfaces after <strong>the</strong> tests, it wasfound a <strong>de</strong>position of AZ31 on H13. In this situation<strong>the</strong> material sli<strong>de</strong>s on itself so varying <strong>the</strong> frictionconditions. This fact can explain <strong>the</strong> friction growthhighlighted in B interval of Fig. 5. This implies <strong>the</strong>need of lubricant in AZ31 warm forming to keep <strong>the</strong>integrity of <strong>the</strong> die and workpiece surfaces.Pareto Chart of <strong>the</strong> Standardized Effects(α=0.05)common trend between <strong>the</strong> two curves with a moreevi<strong>de</strong>nt friction minimum at <strong>the</strong> temperature of300°C and at a pressure of 15% of <strong>the</strong> yield stress.4.3 Consi<strong>de</strong>rations on data scatteringComparing <strong>the</strong> standard <strong>de</strong>viations reported inTable 2 and Table 3, it is possible to observe that <strong>the</strong>tests conduced on AZ31 sheets are affected by anhigher scattering. This scattering <strong>de</strong>creases as <strong>the</strong>temperature increases and should be correlated witha problem in temperature control system.TpT*pT*v*pvp*vT*vFo limitFoStandardized EffectFig. 6. Pareto Chart for AZ31 results.5 CONCLUSIONS AND FUTURE STUDIESThe present study allowed to i<strong>de</strong>ntify <strong>the</strong> frictionmost affecting parameters while forming AZ31 andFeP04 sheets. Fur<strong>the</strong>rmore, it was i<strong>de</strong>ntified how<strong>the</strong>se parameters influence friction.Fur<strong>the</strong>r studies will be conducted to un<strong>de</strong>rstand <strong>the</strong><strong>de</strong>pen<strong>de</strong>nce of friction on pressure, temperature andlubrication especially for AZ31 sheets.0.500.350.200.500.350.20µ[°C] T200T 250300200°C 250°C 300 °C0,550,500,450,400,350,300,250,20Interaction Plot (data means) for µ7,5 % 15,0 %0.50[% σ ] p07.5p15.00.350.20[mm/s] vv214221 mm/s 42 mm/sFig. 7. AZ31 parameters interaction effects.[°C]T2003007.5 % 11.5 % 15.0 % 18.5 %p [% σ 0]Fig. 8. Results of <strong>the</strong> tests at 200°C and 300°C and slidingspeed equal to 21 mm/s.To better un<strong>de</strong>rstand <strong>the</strong> contact pressure influence,additional tests were performed. Namely 11.5% and18.5% of <strong>the</strong> yield stress at <strong>the</strong> temperature of 200°Cand 300°C and a sliding velocity of 21 mm/s wereconsi<strong>de</strong>red. The result comparisons (Fig. 8) show aREFERENCES1. H. Sofuoglu, J. Rasty, On <strong>the</strong> measurement of frictioncoefficient utilizing <strong>the</strong> ring compression test, TribologyInternational, 32 (1999) 327-335.2. R. Combarieu, , P. Montmitonnet, Effect of additives onfriction during plane strain compression of aluminiumstip test, Wear, 257 (2004) 1071-1080.3. E. Yoon, H. Kong, O. Kwon, J. Oh, Evaluation offrictional characteristics for a pin-on-disk apparatus withdifferent dynamic parameters, Wear, 203-204 (1997)341-349.4. H. Cho, T. Altan, Determination of flow stress andinterface friction at elevated temperatures by inverseanalysis technique, J. of Mat. Proc. Tech., 170 (2005)64-70.5. Y.C. Lam, S. Khoddam, P.F. Thomson, Inversecomputational method for constitutive parametersobtained from torsion, plane-strain and axisymmetriccompression test, J. of Mat. Proc. Tech., 83 (1998) 62-71.6. F. Klocke, G. Messner, C. Giardini, E. Ceretti, FEsimulationof micro-tribological contacts in coldforming: experimental validation, In: 2° Int. Conf. onTribology in Manuf. Proc, ICTMP, Nyborg – Denmark(2004), 395-402.7. E. Ceretti, A. Fiorentino, A. Attanasio, C. Giardini,Influence of die material and roughness on frictioncoefficient in cold forming, In: Proceedings of <strong>the</strong> 8 thAITeM conference, CET, Montecatini Terme (PT) – Italy(2007) 115-116.8. E. Ceretti, C. Contri, C. Giardini, Study on microtribologicalcontacts in cold forming: simulations an<strong>de</strong>xperimental validation, In: Proceeding of 7th A.I.Te.M<strong>Conference</strong>, CET, Lecce – Italy (2005)117-118.9. F.K. Chen, T.B. Huang, Formability of stampingmagnesium-alloy AZ31 sheets, J. of Mater. Proc. Tech.,142 (2003) 643-647.
Effects of lubricant and lubrication parameters on friction during hotsteel forgingE. Daouben 1,2 , A. Dubois 1 , M. Dubar 1 , L. Dubar 1 , R. Deltombe 1 ,N.G Truong Dinh 2 , L. Lazzarotto 31 Laboratoire d’Automatique, <strong>de</strong> Mécanique et d’informatique Industrielles et Humaines, UMR 8530,University of Valenciennes, F-59313 Valenciennes Ce<strong>de</strong>x 9, FranceURL: www.univ-valenciennes.fr/LAMIH e-mail: andre.dubois@univ-valenciennes.fr2 CONDAT Lubrifiants –Avenue Frédéric Mistral, F-38670 Chasses sur Rhônes, France3 CETIM – Etablissement <strong>de</strong> Saint Etienne – 7 rue <strong>de</strong> la presse – BP 802, F-42952 Saint Etienne Ce<strong>de</strong>x 9,FranceABSTRACT: The aim of <strong>the</strong> present work is to improved comprehension of wear phenomenon during hotsteel forging with sprayed lubricants. The study reported in this paper uses a specific friction test, called <strong>the</strong>Warm Hot Upsetting Sliding Test (WHUST), which reproduces hot forging contact conditions. Wear markers–such as friction force/normal load ratio or sliding distance before <strong>the</strong> first scratch– are proposed tocharacterize <strong>the</strong> contactor wear at microscopic and macroscopic scales. Friction tests are performed on1100°C heated specimens to characterize <strong>the</strong> influence of graphite based lubricant film thickness and particlesizes on friction and wear in <strong>the</strong> flash zone of a nitri<strong>de</strong>d steel die.Key words: Hot forging; steel; friction test, wear, lubricant, graphite1 INTRODUCTIONThe choice of an efficient lubricant is still a criticalpoint in <strong>the</strong> <strong>de</strong>velopment of a metal forming process.A bad lubricant, or a good lubricant appliedaccording to bad conditions, may lead toprematurely tool wear, and consequently have adramatic influence on production. The aim of <strong>the</strong>present work is to improve <strong>the</strong> comprehension ofwear phenomenon during hot steel forging withsprayed lubricants [1]. The study uses a specifictribological testing <strong>de</strong>vice: <strong>the</strong> Warm Hot UpsettingSliding Test (WHUST). The WHUST simulates hotforging contact conditions between specimensheated up to 1100°C and contactor heated up to200°C. Friction tests are performed so that WHUSTcontact pressure, sliding velocity, contactor slidingvelocity, contactor and specimen temperatures aresimilar to industrial ones. Before performing <strong>the</strong>friction tests, lubricant is sprayed on contactorsurface. Then <strong>the</strong> contactor sli<strong>de</strong>s against <strong>the</strong>specimen with a constant penetration, leaving aresidual <strong>de</strong>formed track on its surface. MainWHUST results are tangential and normal loads oncontactor, surface roughness and chemicalcompositions on both specimen and contactorsurfaces. A methodology is proposed to analyse<strong>the</strong>se results and provi<strong>de</strong> “wear markers” whichcharacterized <strong>the</strong> contactor wear at microscopic andmacroscopic scales. The methodology is <strong>the</strong> appliedto <strong>the</strong> hot forging of a steel tripod using water basedgraphite lubricants. The effect on friction oflubricant film thickness, and solid lubricant particlesize are analysed.2 WHUST PRINCIPLEDuring <strong>the</strong> test, <strong>the</strong> contactor penetrates <strong>the</strong>specimen and moves along specimen surface with aconstant penetration and sliding velocity. TheWHUST parameters are <strong>the</strong> specimen and contactortemperatures, <strong>the</strong> contactor velocity, <strong>the</strong> contactorgeometry and <strong>the</strong> contactor penetration within <strong>the</strong>specimen (figure 1). Those test parameters areadjusted so that <strong>the</strong> test temperatures, <strong>the</strong> contactpressure at contactor/specimen interface, <strong>the</strong>specimen plastic strain and <strong>the</strong> sliding velocity areclosed to those of <strong>the</strong> studied process.Contactors are machined from actual industrial tools
and specimens are parts of actual industrial workpieces. That specificity enables <strong>the</strong> WHUST tosimulate physical and chemical contact conditionsencountered in <strong>the</strong> studied forming process: <strong>the</strong>lubricant, surface roughness, chemical propertiesinvolved in <strong>the</strong> test are <strong>the</strong> same as those of <strong>the</strong>process [2].3 WHUST RESULTSFig. 1. Overview of <strong>the</strong> W.H.U.S.TWHUST direct results are normal and tangentialforces on contactor, specimen and contactor surfaceprofiles. From <strong>the</strong>se results we can <strong>de</strong>finemacroscopic or microscopic “wear markers”.3.1 Macroscopic markersThree parameters are <strong>de</strong>fined: <strong>the</strong> lubrication in<strong>de</strong>xLi, <strong>the</strong> contactor roughness Ra and <strong>the</strong> critical lengthLc [3].3.1.a Lubrication in<strong>de</strong>x LiThe lubrication in<strong>de</strong>x corresponds to <strong>the</strong> ratio of <strong>the</strong>tangential and normal forces: Li = F t /F n . This in<strong>de</strong>xprovi<strong>de</strong>s quick and reliable information on <strong>the</strong>evolution of friction. Correlation betweenlubrication in<strong>de</strong>x Li and <strong>the</strong> Coulomb’s coefficientof friction can be found in [4].3.1.b Contactor roughness RaThe mean surface roughness Ra is measured oncontactor contact surfaces before and after each test.It provi<strong>de</strong>s information on <strong>the</strong> occurrences ofadhesive and/or abrasive wear.3.1.c Critical length LcPlastic strains generate a residual track on <strong>the</strong>specimen surface during <strong>the</strong> tests. Scratches can beobserved on this track when <strong>the</strong> lubricant filmbreaks down. The critical length Lc corresponds to<strong>the</strong> dimensionless distance measured along <strong>the</strong> track,from <strong>the</strong> beginning of <strong>the</strong> contact to <strong>the</strong> point where<strong>the</strong> first scratch is observed. Lc equals zero whenscratches appears as soon as <strong>the</strong> contactor comes incontact with <strong>the</strong> specimen; Lc equals 1 when noscratches are observed. This marker characterizes<strong>the</strong> ability of lubricant to <strong>de</strong>lay <strong>the</strong> first metal-tometalcontact between tool and work piece.3.2 Microscopic markerMicroscopic markers are observed on contactorcontact surfaces. They <strong>de</strong>rive from SEM-EDSanalyses.3.2.a SEM analysisSEM pictures are taken on contactor surface at amagnification of 200. These pictures show <strong>the</strong>presence or absence of material <strong>de</strong>posits oncontactor surface (presence of adhesive wear area,oxi<strong>de</strong> scale…). It allows quantifying <strong>the</strong> size of<strong>the</strong>se <strong>de</strong>posits.3.2.b EDS analysisThe SEM observations are completed by EDSanalyses in or<strong>de</strong>r to <strong>de</strong>termine <strong>the</strong> chemicalcomposition of <strong>the</strong> material <strong>de</strong>posits. First, amapping is taken before <strong>the</strong> friction test in or<strong>de</strong>r toexamine lubricant structure. Then, two mappings arerealised after <strong>the</strong> test, one to <strong>de</strong>termine <strong>the</strong> presenceand nature of oxi<strong>de</strong> scale [5] and <strong>the</strong> o<strong>the</strong>r toquantify <strong>the</strong> residual lubricant on contactor surface.4 APPLICATION4.1 Forming process: hot forging of a tripodThe hot forging of a tripod (work piece with threesymmetry planes at 120°) is studied in <strong>the</strong> presentwork. The process involves two forming sequences:a preform followed by <strong>the</strong> finishing. Both are carriedout using a mechanical press with a maximumvelocity of 1m/s [6]. The present study focuses on<strong>the</strong> lubricant behaviour in <strong>the</strong> flash zone, at <strong>the</strong> endof <strong>the</strong> preform sequence.Dies are ma<strong>de</strong> of nitri<strong>de</strong>d tool steel and <strong>the</strong> tripod isin medium alloyed steel. Dies and work piecetemperatures respectively equal 200°C and 1100°Cwhen <strong>the</strong>y come in contact. A graphite suspension inwater lubricant is sprayed on <strong>the</strong> dies before formingto reduce friction and limit wear [7]. Measurementsoperated on industrial dies show that <strong>the</strong> graphitefilm thickness varied from 10 to 40 µm, <strong>de</strong>pendingon <strong>the</strong> angle between <strong>the</strong> lubricant spray nozzle and<strong>the</strong> surface of <strong>the</strong> tool. A finite element simulationof <strong>the</strong> process shows <strong>the</strong> contact pressures equalled
to 190 MPa and sliding velocities equalled to 60mm/s in <strong>the</strong> flash zone [2]. Each testing condition isperformed three times, with three “new” contactors.4.2 Effect of lubricant film thicknessFour film thicknesses are simulated on <strong>the</strong> WHUST:• 0 µm: dry lubrication,• 10 µm and 40 µm, which correspond to <strong>the</strong>minimum and maximum thicknessesmeasured on <strong>the</strong> industrial tools,• 30 µm which is <strong>the</strong> mean film thicknessmeasured on <strong>the</strong> flash zone of <strong>the</strong> dies.Table one sums up <strong>the</strong> main results for <strong>the</strong>macroscopic wear markers. Contactor surfacesbefore and after <strong>the</strong> friction tests are presented onfigures 2 and 3.Bonding elements used in <strong>the</strong> formulation of <strong>the</strong>lubricant have a great influence on <strong>the</strong> structure of<strong>the</strong> graphite layer on tool surface. In <strong>the</strong> presentstudy, for thin lubricant thickness, <strong>the</strong> graphite layeris almost only composed of pow<strong>de</strong>r, withoutparticular structure (figure 2b). The layer structureevolves to a “honeycomb” structure when <strong>the</strong> filmthickness equal 30µm (figure 2c), and to a stratifiedlayer for thicker films (figure 2d).WHUST performed without lubricant lead to strongmaterial <strong>de</strong>posit on contactor surface. Thelubrication in<strong>de</strong>x is <strong>the</strong>n very high and scratchesappears on <strong>the</strong> work piece surface after a shortsliding distance (Lc = 0.5). SEM-EDS analysisshows that <strong>the</strong> material <strong>de</strong>posit is oxi<strong>de</strong> scalecoming from specimen surface.Large oxi<strong>de</strong> scales particles are observed oncontactor surface when performing test with a 10µmlubricant film thickness (figure 3b). The lubricationin<strong>de</strong>x Li is 28% lower than in dry contact condition,and <strong>the</strong> critical length Lc increase from 0.5 to 0.87.The graphite layer reduces friction and <strong>de</strong>lay <strong>the</strong>first direct metal-to-metal contact, but is not bon<strong>de</strong>dsufficiently to <strong>the</strong> surface to avoid scratchoccurrence.Friction tests operated on thicker lubricant filmspresent less material <strong>de</strong>posit on contactor surface(figures 3c-d). SEM-EDS show that <strong>the</strong> surface ismostly cover with residual graphite. No scratch isobserved on <strong>the</strong> specimen surfaces and <strong>the</strong>lubrication in<strong>de</strong>x <strong>de</strong>creases with <strong>the</strong> increase of filmthickness.As a conclusion, <strong>the</strong> film thickness in <strong>the</strong> flash zonemust by greater than or equal to 30µm to limit toolwear and reduce friction. None<strong>the</strong>less, it should benotice that <strong>the</strong> aim of <strong>the</strong> flash being to slow downmaterial flow in or<strong>de</strong>r to guaranty a good die filling,a strong reduction of friction is not always wanted.So, for <strong>the</strong> studied process, a film thickness equal to30µm is <strong>the</strong> better compromise between surface<strong>de</strong>fect protection and friction control.Fig. 2. SEM pictures of contactor surface before friction testa) dry friction, b) 10 µm, c) 30 µm, d) 40 µmFig. 3. SEM pictures of contactor surface after friction testsa) dry friction, b) 10 µm, c) 30 µm, d) 40 µmTable 1. Evolution of Li and Lc macroscopic markers infunction of lubricant film thicknessLubricant filmthickness0 µm 10 µm 30 µm 40 µmLubrication in<strong>de</strong>x Li 0.81 ±0.07 0.58 ±0.04 0.39 ±0.03 0.26 ±0.02Critical length Lc 0.50 ±0.04 0.87 ±0.04 1.00 ±0.00 1.00 ±0.00
4.3 Effect of lubricant particle sizeCommon particle sizes in graphite lubricants rangefrom 2 to 50 µm [8]. To study <strong>the</strong> lubricant gradingeffect, two lubricants are tested, one with mediumparticle sizes (25-30 µm), ano<strong>the</strong>r with large particlesizes (50µm). Both lubricants have <strong>the</strong> samecomposition (same bonding agent), and are sprayedon <strong>the</strong> contactor so that <strong>the</strong>ir thickness equals 30µm.Table 2 exhibits <strong>the</strong> change of tribological behaviourwhen increasing <strong>the</strong> particle sizes of <strong>the</strong> lubricant:<strong>the</strong> lubrication in<strong>de</strong>x increases from 0.39 to 0.48 and<strong>the</strong> critical length becomes lower than 1.Figure 4 presents <strong>the</strong> surface of <strong>the</strong> contactor justbefore <strong>the</strong> test. Blue areas are for carbon and red foriron. Lubricant with medium particle sizes has amore homogeneous covering on tool surface. Zoneswhere almost no graphite is present are observed oncontactor surfaces sprayed with <strong>the</strong> large particlesize lubricant. As a consequence, <strong>the</strong> wholecontactor surface is not protected, direct metal-tometalcontact occurs between specimens andcontactors and scratches appear on specimensurface. Scratches lead to an increase of <strong>the</strong> frictionforce.As a conclusion of <strong>the</strong>se tests, when large particlesizes are used, <strong>the</strong> lubricant film layer has to bethicker so that <strong>the</strong> bonding agent can react to form ahomogeneous graphite layer.5 CONCLUSIONSAn original methodology focused on <strong>the</strong> analysis ofwear phenomena in hot forging of steel has beenpresented. A prototype testing <strong>de</strong>vice calledWHUST reproduces industrial hot forging contactconditions. WHUST results are analysed usingmicroscopic and macroscopic wear markers. Testsoperated with different lubricant film thicknessesand different lubricant particle sizes have shown that<strong>the</strong> efficiency of <strong>the</strong> lubricant film is linked tostructure of <strong>the</strong> graphite layer more than <strong>the</strong>lubricant thickness.These results are very promising and will help toun<strong>de</strong>rstand wear mechanisms in a very near future.The next steps of this study will be <strong>the</strong>un<strong>de</strong>rstanding of <strong>the</strong> behaviour of graphite freelubricant for hot forging and <strong>the</strong> testing of industrialdies at <strong>the</strong> end <strong>the</strong>ir lifecycle.Table 2. Evolution of Li and Lc macroscopic markers infunction of lubricant film thicknessLubricant particle size 25-30 µm 50 µmLubrication in<strong>de</strong>x Li 0.39 ±0.03 0.48 ±0.02Critical length Lc 1.00 ±0.00 0.90 ±0.04Fig. 4. SEM-EDS pictures of contactor surface before frictiontests a) EDS, medium grading, b) EDS, large gradingACKNOWLEDGEMENTSThe present research work has been supported by <strong>the</strong> EuropeanCommunity, <strong>the</strong> Délégation Régionale à la Recherche et à laTechnologie, <strong>the</strong> Ministère <strong>de</strong> l’Education Nationale, <strong>de</strong> laRecherche et <strong>de</strong> la technologie, The Région Nord-Pas <strong>de</strong>Calais, <strong>the</strong> Centre National <strong>de</strong> la Recherche Scientifique,CONDAT SA and CETIM, ASCOFORGE and Forges <strong>de</strong>Courcelles. The authors gratefully acknowledge <strong>the</strong> support of<strong>the</strong>se institutions and industrial partners.REFERENCES1. O. Barrau, C. Boher, R.Gras, F. Rezaï-Aria, ‘Analysis of<strong>the</strong> friction and wear behaviour of hot forging’, Wear 255(2003) 1444-1454.2. R. Deltombe, N. Morgado, M.Dubar, A.Dubois and L.Dubar, Hot forming of aluminium: a new methodology toi<strong>de</strong>ntify friction parameters, 7 th <strong>ESAFORM</strong>, Norway –Trondheim (2004) 253-256.3. E. Daouben, L. Dubar, M. Dubar, R. Deltombe, A.Dubois, N. Truong-Dinh, L. Lazzarotto, ‘Friction andwear in hot forging of steels’, Proceedings of <strong>the</strong> Int.Conf. <strong>ESAFORM</strong> 2007, Zaragoza, Spain (2007)4. L. Lazzarotto, L. Dubar, A. Dubois, P. Ravassard and J.Oudin, ‘I<strong>de</strong>ntification of Coulomb’s friction coefficientin real contact conditions applied to a wire drawingprocess’, Wear, 211 (1997) 54-635. B. Picqué, P.O. Bouchard, P. Montmitonnet and M.Picard, ‘Mechanichal of iron oxi<strong>de</strong> scale: Experimentaland numerical study’, Wear, 260 (2005) 231-242.6. S.Sheljaskow, Tool lubricating systems in warm forging.J. Mater. Process. Technol., 113 (2001) 16-21.7. T.Iwama and Y. Morimoto, Die life and lubrication inwarm forging. Journal of Materials ProcessingTechnology 71 (1997) 43-48.8. R. F. Deacon and J.F. Goodman, ‘Spreading Behavior ofwater based graphite Lubricants on Hot Die Surfaces’,CIRP 55/1 (2006) 299-302.
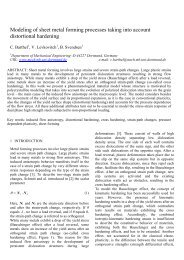
Behaviour of oxi<strong>de</strong> scales in hot steel strip rollingC. Grenier 1,2 , P.-O. Bouchard 1 , P. Montmitonnet 1,* , M. Picard 21 Ecole <strong>de</strong>s Mines <strong>de</strong> Paris - ParisTech, UMR CNRS 7635, BP 207, 06904 Sophia-Antipolis Ce<strong>de</strong>x, FranceURL: www.cemef.ensmp.fr e-mail: Claire.Grenier@ensmp.fr ;Pierre-Olivier.Bouchard@ensmp.fr ;Pierre.Montmitonnet@ensmp.fr2ArcelorMittal, R&D Centre, BP 30320, 57214 Maizières-les-Metz Ce<strong>de</strong>x, Francee-mail: Michel.Picard@arcelormittal.comABSTRACT: The behaviour of oxi<strong>de</strong> scales in <strong>the</strong> finishing Hot Strip Mill is simulated by <strong>the</strong> hot PlaneStrain Compression Test (PSCT). Compared with <strong>the</strong> i<strong>de</strong>al case of homogeneous plastic co-<strong>de</strong>formation of<strong>the</strong> oxi<strong>de</strong> layer and <strong>the</strong> un<strong>de</strong>rlying metal, different types of <strong>de</strong>fects are <strong>de</strong>scribed: <strong>de</strong>lamination at <strong>the</strong> interfaceor within <strong>the</strong> oxi<strong>de</strong> layer; interfacial plastic instability due to <strong>the</strong> jump of <strong>the</strong> mechanical properties;perpendicular, through-thickness cracks where <strong>the</strong> axial strain parallel to <strong>the</strong> interface dominates, followed bymicro-extrusion of metal between <strong>the</strong> fragments; oblique cracks followed by sliding along <strong>the</strong> lips, whereshear dominates. The Finite Element Method (FEM) is used to bring elements of interpretation, as to whichconditions <strong>de</strong>termine each mechanism. Conclusions for <strong>the</strong> behaviour in hot rolling are sketched.Key words: Oxi<strong>de</strong> scales, hot rolling, Plane Strain Compression Test, PSCT, Finite Element Mo<strong>de</strong>lling1 INTRODUCTIONIn hot rolling of steels, <strong>the</strong> rolled material in factconsists of thin layers of a ceramic, <strong>the</strong> complex ironoxi<strong>de</strong> layers (20 – 50 µm thick), on hot metal. Thedifference in hardness and ductility of <strong>the</strong>se twomaterials [1] often leads to oxi<strong>de</strong> cracks of variouskinds, through-thickness or interfacial (oxi<strong>de</strong>spalling) [2-5]. The present paper focuses onthrough-thickness cracks.In a previous work [6-7], fracture occurring justbefore bite entry had been studied bo<strong>the</strong>xperimentally (hot bending test) and <strong>the</strong>oretically(FEM). Cracks open wherever superficial tensilestresses occur, <strong>the</strong>n <strong>the</strong>y may open wi<strong>de</strong> in <strong>the</strong> bitedue to strip elongation. If <strong>the</strong> pressure is highenough, "micro-extrusion" of fresh hot metal takesplace through <strong>the</strong> open cracks. The interfacebecomes wavy as in Figure 1 ("rolled-in scale"), a<strong>de</strong>fect which may become visible after pickling andremain even after cold rolling. A numericalparametric study resulted in a damage risk chart,where thicker oxi<strong>de</strong>s (e.g. due to high temperatures)were found to be most <strong>de</strong>trimental, unless sufficientplasticity allows <strong>the</strong>m to keep up with part of <strong>the</strong>elongation of <strong>the</strong> strip. In terms of material data, <strong>the</strong>oxi<strong>de</strong>-to-steel hardness ratio and <strong>the</strong> temperature<strong>de</strong>pen<strong>de</strong>ntand strain-rate-<strong>de</strong>pen<strong>de</strong>nt oxi<strong>de</strong> fracturestress were found most important.Figure 1: oxi<strong>de</strong> cracks and wavy oxi<strong>de</strong> – metal interface.Above: top view [2] shows an array of cracks normal to rollingdirection (RD). Below: cross section (this work).The present work aims at extending <strong>the</strong>se notions tocracks opening in <strong>the</strong> roll-strip contact (bite). Thereare few data available on <strong>the</strong> morphology, natureand origins of this particular category.yzxxzyx
2 EXPERIMENTAL2.1 PSCT set-up and procedurezyxFigure 2: PSCT test rig (left) and procedure (right).PSCT consists in upsetting a strip between two flatdies (figure 2 left). <strong>Here</strong>, <strong>the</strong> oxidation of steel stripsamples is ma<strong>de</strong> in situ, by allowing temporarily anoxidative atmosphere in <strong>the</strong> protective glass vessel(figure 2 right). The oxidation temperature is 900°Cin all tests, i.e. close to entry temperature in <strong>the</strong>finishing Hot Strip Mill (HSM). The oxidation timeis varied to give oxi<strong>de</strong> thickness between 10 µm and100 µm. The system is <strong>the</strong>n brought up or down to<strong>the</strong> mechanical test temperature. After temperatureequilibration, <strong>the</strong> test is performed in a fraction of asecond; in <strong>the</strong> tests reported, no lubricant was used.Then <strong>the</strong> sample is allowed to cool freely in N 2 .2.2 MaterialsThe steel strip is an ultra-low carbon, DWI <strong>de</strong>epdrawingsteel, with 0.015%C, 2.29% Mn, 0.23% Si(atomic concentrations). The coupons are 5 mmthick, 50 mm wi<strong>de</strong> and 62 mm long.The die material is yttria-toughened zirconia; diesare 70 mm long and 12 mm wi<strong>de</strong>. Rough dies (Ra =3.6 µm, isotropic) are compared with smooth dies(Ra = 0.42 µm, isotropic); on occasion, grooved diesare used to simulate damaged (“ban<strong>de</strong>d”) rolls; <strong>the</strong>grooves are in <strong>the</strong> punch width direction x,equivalent to <strong>the</strong> rolling direction (RD).2.3 Experimental plantemperature (°C)11001000900800700600500400N 2 N 2Oxidation(N 2 +O 2 +H 2 O)Deformation0 500 1000 1500time (s)Oxi<strong>de</strong> thickness: 10µm, 25 µm, 50 µm, 75 µm.PSCT Temperature: 800°C, 900°C and 1050°CStrain: ε = 0.2 ; 0.4 ; 0.6 ; 0.8.Strain rate: 0.1 s -1 , 1 s -1 and 10 s -1 .3 EXPERIMENTAL RESULTS3.1 General observations: cracks and interfaceabFigure 3: Top view: vertical, normal cracks on <strong>the</strong> si<strong>de</strong> of aPSCT in<strong>de</strong>ntation. (a): enlarged view of <strong>the</strong> framed area in (b);<strong>the</strong> white bar is 1 mm.1ε , & ε = 1.s− , T = 900°C, 50 µm oxi<strong>de</strong>.Smooth die, = 0. 4yFigure 4: SEM picture of a cross-section in <strong>the</strong> flow direction(x = punch width direction ↔ RD). Same conditions. Metal iswhite, oxi<strong>de</strong> is light grey.Figure 3 shows a typical aspect in top view, an arrayof cracks perpendicular to <strong>the</strong> major flow directionx, very similar to cracks opening before <strong>the</strong> bite [6-7]. Figure 4 shows <strong>the</strong>y run through <strong>the</strong> oxi<strong>de</strong>thickness, with a uniform <strong>de</strong>nsity. Their origin hereis not <strong>the</strong> oxi<strong>de</strong> bending ahead of <strong>the</strong> bite as in [6-7]but probably <strong>the</strong> flow of <strong>the</strong> un<strong>de</strong>rlying metalputting <strong>the</strong> oxi<strong>de</strong> in tension. It might also be due topunching by die roughness peaks; this will bediscussed using numerical simulation in paragraph 4.Spalling (figure 4) may be due to sample polishingbefore microscopic observation; but slight interfacewaviness suggests spalling or crushing during <strong>the</strong>tests, followed by micro-extrusion, as in [6-7].This observation answers one of <strong>the</strong> questionsbehind this work: crack array formation may go onin <strong>the</strong> contact - PSCT is known to be a goodsimulator of strip rolling. The subsequent evolutionseems very similar to pre-bite cracks.In <strong>the</strong> case of pre-bite cracks, <strong>the</strong> <strong>de</strong>nsity could berelated to oxi<strong>de</strong> thickness, oxi<strong>de</strong> fracture stress andinterface shear stress [6-8]. We expect numericalsimulation to help <strong>de</strong>termine <strong>the</strong> parametric<strong>de</strong>pen<strong>de</strong>ncies for <strong>the</strong> present, in-bite opening cracks.It has been found occasionally that cracks may notalways be normal to <strong>the</strong> surfaces. Figure 5 shows acase where oblique cracks, followed by rotation offragments, have occurred near <strong>the</strong> edge of a die(note that rotation may have been facilitated by <strong>the</strong>presence of a thick lubricant film in this particularx
case). The same pattern has been found by [9] on hotrolled strips. This proves <strong>the</strong> relevance of thisphenomenon, tentatively attributed to <strong>the</strong> presenceof significant shear stress (die edge / friction) whichinduces <strong>the</strong> rotation of principal axes.zx3.3 Interface3.3.a Delamination / spallingThis is ano<strong>the</strong>r failure mechanism whereby oxi<strong>de</strong>fragments may be spalled off <strong>the</strong> sample surface; inrolling, such fragments may <strong>the</strong>n be embed<strong>de</strong>dinsi<strong>de</strong> <strong>the</strong> strip surface by <strong>the</strong> contact pressure.zyFigure 5: oblique cracks (top) near <strong>the</strong> PSCT die edge,(bottom) on a rolled strip [9].3.2 Roughness transferFigure 6: comparison of <strong>the</strong> oxi<strong>de</strong> surface state after PSCT1with rough / smooth dies. Die width 12 mm. ε = 0. 4 , & ε = 1.s− ,T = 900°C, oxi<strong>de</strong> thickness 50 µm.Figure 8: two examples of <strong>de</strong>lamination. Left: interfacial<strong>de</strong>lamination on <strong>the</strong> flank of a groove. Right: <strong>de</strong>laminationwithin <strong>the</strong> oxi<strong>de</strong> layer.In figure 8 (left), bending of <strong>the</strong> sample in <strong>the</strong> flankof a grooved die (representing <strong>the</strong> “roll banding”<strong>de</strong>fect, i.e. peeling of an orthoradial strip of rolloxi<strong>de</strong>) has resulted in a normal, through-thicknesscrack which has bifurcated along <strong>the</strong> interface; insuch situations, <strong>the</strong> formation and embedding of afragment becomes highly probable. The die grooveis oriented in <strong>the</strong> die width direction, equivalent to<strong>the</strong> rolling direction. Such a crack would thus belongitudinal, contrary to those shown above. Figure8 (right) shows <strong>de</strong>lamination within <strong>the</strong> oxi<strong>de</strong>. Linesof pores have occasionally been found in oxi<strong>de</strong>layers, parallel to <strong>the</strong> interface; <strong>the</strong>y may be <strong>the</strong>origin of such <strong>de</strong>fects. Yet <strong>de</strong>lamination might alsohave taken place at <strong>the</strong> interface, with subsequent reoxidationduring cooling in imperfectly pure N 2 .<strong>Here</strong> again, fragmentation and embedding of <strong>the</strong>spalled layer in <strong>the</strong> next rolling stand is inevitable.Figure 7: cross-section of <strong>the</strong> samples shown in figure 5,showing <strong>the</strong> smooth metal (white) – oxi<strong>de</strong> (grey) interface,whatever <strong>the</strong> die roughness.Ano<strong>the</strong>r possible <strong>de</strong>fect is interface waviness due totool roughness printing, in particular when rolls areseverely worn. Figure 6 shows that <strong>the</strong> oxi<strong>de</strong>surface, to a large extent, takes <strong>the</strong> roll roughness,which suggests a certain <strong>de</strong>gree of plasticity of <strong>the</strong>oxi<strong>de</strong>, but <strong>the</strong> oxi<strong>de</strong> – metal interface remainssmooth (figure 7). This may not be a generalconclusion however, certainly <strong>de</strong>pen<strong>de</strong>nt (i) on <strong>the</strong>ratio of <strong>the</strong> tool roughness to <strong>the</strong> oxi<strong>de</strong> thickness,and (ii) of <strong>the</strong> temperature-<strong>de</strong>pen<strong>de</strong>nt mechanicalproperties of <strong>the</strong> oxi<strong>de</strong> (toughness, oxi<strong>de</strong>-to-metalyield stress ratio). <strong>Here</strong> again, numerical simulationcan contribute in <strong>the</strong> study of <strong>the</strong>se parameters.3.3.b Interface instabilityIn a series of tests <strong>de</strong>voted to varying strain rate, asinusoidal interface waviness has been observed at<strong>the</strong> lowest strain-rate, <strong>de</strong>creasing and disappearingas ε & increases (figure 9).Figure 9: Interface waviness without cracking. Strain rateincreases from top to bottom (0.1, 1 and 10 s -1 ).There is no evi<strong>de</strong>nce of any crack / micro-extrusionphenomenon, hence <strong>the</strong> interpretation by plastic co<strong>de</strong>formationinstability (see [10] e.g.). It is not surethat this can occur in strip rolling, since it has been
found here only in a low strain rate range; yet itmight occur at higher speeds un<strong>de</strong>r differentconditions (temperature…).4 THEORETICAL INTERPRETATION4.1 Mo<strong>de</strong>l <strong>de</strong>scriptionThe Forge2005® FEM software has been used forthis study. Its <strong>de</strong>scription can be found in [6,7],toge<strong>the</strong>r with <strong>the</strong> ad<strong>de</strong>d through-thickness crackopeningalgorithm (based on a critical fracturestress). Only such cracks are addressed here,although a <strong>de</strong>lamination capability has also beenad<strong>de</strong>d (Cohesive Zone Mo<strong>de</strong>lling approach).4.2 An application to interpretation of crack originFigure 10 shows a crack opening simulation in <strong>the</strong>PSCT at 1000°C and 1 s -1 , with a critical fracturestress of 200 MPa for <strong>the</strong> oxi<strong>de</strong>. The oxi<strong>de</strong> and <strong>the</strong>metal yield stresses are respectively given by:σ ( & ε0.00299. T ( K ) 0.2230.159MPa ) = 69 . exp . ε . ( 3. ) (1)⎛ 3340 ⎞σ ( &⎜ε( )⎟⎝ T K ⎠MPa 0.22 0.09) = 8.5 . exp⎜⎟ . ε . ( 3. ) (2)The die-oxi<strong>de</strong> friction factor is m = 0. 08 . The oxi<strong>de</strong>metalinterface is assumed perfectly adherent.Figure 10: PSCT FEM mo<strong>de</strong>lling and crack formation.Un<strong>de</strong>r <strong>the</strong>se conditions, cracks form ei<strong>the</strong>r un<strong>de</strong>r dieedges (figure 10, left) due to <strong>the</strong> stress singularity, orat asperity tops (figure 10, insert right), but never onflat parts of <strong>the</strong> die. Looking in more <strong>de</strong>tails, with<strong>the</strong> roughness peak height chosen (3 µm, to becompared with oxi<strong>de</strong> thickness 50 µm), fracturedoes not occur because of <strong>the</strong> stress singularity atpeak apex, since full penetration of <strong>the</strong> asperity into<strong>the</strong> plastic oxi<strong>de</strong> occurs before crack opens. Thecritical tension is in fact reached later on, when <strong>the</strong>flow of <strong>the</strong> un<strong>de</strong>rlying metal shears <strong>the</strong> interface andputs <strong>the</strong> oxi<strong>de</strong> in tension. In ano<strong>the</strong>r simulation witha periodic roughness covering <strong>the</strong> whole die width(Ra = 0.3 µm), cracks appear periodically, but <strong>the</strong>wavelength is much larger than <strong>the</strong> roughnesswavelength. Study of <strong>the</strong> influence of parametersand comparison with experiments are in progress.The effect of friction and shear stress on obliquecrack formation (as in figure 5) is also un<strong>de</strong>r study.5 CONCLUSIONSExperimental results present a number of<strong>de</strong>formation and fracture phenomena which occur inoxidized metal / tool contact; <strong>the</strong>ir relevance towardsinterface <strong>de</strong>fects in hot strip rolling has beencommented. A first example of application of multibodyFEM to <strong>the</strong> analysis of <strong>the</strong> origins of <strong>the</strong>seoxi<strong>de</strong> and interface <strong>de</strong>fects has been presented.ACKNOWLEDGEMENTThe authors thank ArcelorMittal (Arcelor Research S.A.) forfinancial support and authorization to publish <strong>the</strong> results.REFERENCES1. G. Vagnard and J. Manenc, Etu<strong>de</strong> <strong>de</strong> la plasticité duprotoxy<strong>de</strong> <strong>de</strong> fer et <strong>de</strong> l’oxy<strong>de</strong> cuivreux. Mem. Et. Sci.Rev. Met. LXI 11 (1964) 768-776 (in French).2. Y.H. Li and C.M. Sellars, ‘Mo<strong>de</strong>lling <strong>de</strong>formation ofoxi<strong>de</strong> scales and <strong>the</strong>ir effects on interfacial heat transferand friction during hot steel rolling’, Proceedings of <strong>the</strong>2 nd Conf. Mo<strong>de</strong>lling of Metal rolling processes, London(1996) 192-2013. M. Krzyzanowski and J.H. Beynon, 'Oxi<strong>de</strong> behaviour inhot rolling', in: Metal forming science and practice, ed,J.G. Lenard, Elsevier, Amsterdam (2002) 259-2954. M.F. Frolish, M. Krzyzanowski, W.M. Rainforth andJ.H. Beynon, 'Oxi<strong>de</strong> scale behaviour on aluminium andsteel un<strong>de</strong>r hot working conditions', J. Mater. Process.Technol. 177, 1-3 (2006) 36-405. M. Schütze, 'Mechanical properties of oxi<strong>de</strong> scales',Oxid. Met. 44, 1-2 (1995) 29-606. B. Picqué, Experimental study and numerical simulationof oxi<strong>de</strong> scales mechanical behaviour in hot rolling, PhDThesis, Ecole <strong>de</strong>s Mines <strong>de</strong> Paris (2004)7. B. Picqué, P.-O. Bouchard, P. Montmitonnet and M.Picard, 'Mechanical behaviour of iron oxi<strong>de</strong> scale:experimental and numerical study', Wear 260 (2006) 231-2428. D.C. Agrawal and R. Raj, 'Measurement of <strong>the</strong> ultimateshear strength of a metal-ceramic interface', Acta Met.37, 4 (1989) 1265-12709. F. Platteau, G. Lannoo and D. Espinosa, 'Control of stripsurface quality during hot rolling', Internal Report, CRM(2007) (personal communication).10. S.L. Semiatin and H.R. Piehler, 'Formability of sandwichsheet materials in Plane Strain Compression and rolling',Met. Trans. A 10A (1979) 97-107
Mo<strong>de</strong>lling of friction with respect to size effectsZ. Hu 1 , F. Vollertsen 11 BIAS Bremer Institut fuer Angewandte Strahltechnik – Klagenfurter Str. 2, D-28359 Bremen, GermanyURL: www.bias.<strong>de</strong>e-mail: hu@bias.<strong>de</strong>; vollertsen@bias.<strong>de</strong>ABSTRACT: In this paper a size <strong>de</strong>pen<strong>de</strong>nt FEM-simulation for sheet metal forming was realized applying<strong>the</strong> size <strong>de</strong>pen<strong>de</strong>nt friction functions acquired from strip drawing tests [1]. The software ABAQUS 6.6.3 wasused to simulate <strong>the</strong> strip drawing tests and <strong>de</strong>ep drawing process in different process dimensions. A 2-dimensional mo<strong>de</strong>l was built for strip drawing test and a 3-dimensional mo<strong>de</strong>l was built for <strong>de</strong>ep drawingprocess. Both processes were experimentally carried out in different dimensions. A constant frictioncoefficient as well as a friction function, which shows a <strong>de</strong>pen<strong>de</strong>nce of friction coefficient on <strong>the</strong> contactpressure, was applied in <strong>the</strong> simulation. The simulated punch force vs. punch travel curves were <strong>the</strong>ncompared with <strong>the</strong> experimental curves. A discussion about <strong>the</strong> difference between <strong>the</strong>se curves withconsi<strong>de</strong>ration of tribological size effects will be given.Key words: Scaling, Tribological size effects, Friction1 INTRODUCTIONWhen downscaling <strong>the</strong> size of <strong>the</strong> work piece tomicro forming, not all parameters can be changedaccording to <strong>the</strong> rule of similarity, e.g. grain size.This causes <strong>the</strong> so called size effects, i.e. <strong>the</strong>occurrence of unexpected results concerning <strong>the</strong>forming force of <strong>the</strong> forming limit [1]. Since <strong>de</strong>epdrawing is essentially affected by <strong>the</strong> frictionbetween <strong>the</strong> work piece and tools [2, 3], which isalso affected by <strong>the</strong> size effects [4, 5], <strong>the</strong>tribological size effects in sheet metal forming wereinvestigated in our former work [6, 7] and <strong>the</strong> size<strong>de</strong>pen<strong>de</strong>ntfriction functions were acquired. The aimof this work is to realize size <strong>de</strong>pen<strong>de</strong>nt FEMsimulationfor <strong>de</strong>ep drawing applying <strong>the</strong> acquiredfriction functions.2 TRIBOLOGICAL SIZE EFFECTS2.1 Scaled experimentsCompared to usual <strong>de</strong>ep drawing <strong>the</strong>re is notangential force F t at flange area in strip drawing, seefigure 1.Fig. 1. a) Strip drawing testb) Deep drawingThis difference makes it easier to find <strong>the</strong> relationbetween <strong>the</strong> punch force and <strong>the</strong> friction coefficient.Thus <strong>the</strong> friction function method was <strong>de</strong>velopedonly for <strong>the</strong> strip drawing, which can be used later toi<strong>de</strong>ntify <strong>the</strong> tribological size effects in <strong>de</strong>ep drawing.The effective friction function method yields afriction coefficient from <strong>de</strong>ep drawing (accordingfigure 1b), having some disadvantages concerning<strong>the</strong> <strong>de</strong>pen<strong>de</strong>nce on <strong>the</strong> contact pressure. Bothprocesses were carried out with 5 different punchdiameters in this investigation. They are 50, 20, 10,5 and 1 mm. According to <strong>the</strong> <strong>the</strong>ory of similarity,all process parameters are kept constant whilealmost all geometrical parameters of tools and work
pieces are scaled by <strong>the</strong> same scaling factor. Forexample <strong>the</strong> thickness of <strong>the</strong> work piece has <strong>the</strong>same ratio to punch diameter in each experiment [8].Al99.5 is used as work piece material in everyprocess dimension. The properties of <strong>the</strong> materialare also affected by <strong>the</strong> size effects [9, 10]. For <strong>the</strong><strong>de</strong>termination of <strong>the</strong> friction function and <strong>the</strong> frictioncoefficient in this work <strong>the</strong> flow stress is required.Thus, <strong>the</strong> flow curves of Al99.5 in each thicknesswere acquired through tensile tests and show clearlydifference from each o<strong>the</strong>r, see figure 2. In or<strong>de</strong>r toavoid <strong>the</strong> influence of <strong>the</strong> surface quality on <strong>the</strong>friction, all tools as well as blanks used in this workhave nearly <strong>the</strong> same roughness respectively.mm is <strong>de</strong>scribed, which illustrates a tribological sizeeffect within this investigation.The friction functions can be expressedma<strong>the</strong>matically through an exponential form:μ = C1 + C2⋅ exp( −P⋅C4) + C3⋅ exp( −P⋅C5) (1)Where µ = friction coefficient, P = contact pressure,C 1 -C 5 = coefficients (They are listed in table 1).Table 1. Coefficients of friction functionsPunch diameter C1 C2 C3 C4 C5[mm]50 0.000 0.159 0.130 0.871 0.00720 0.000 0.180 0.130 0.571 0.01110 0.125 12.00 0.449 7.759 1.3465 0.116 0.319 0.032 3.571 2.3481 0.000 0.188 0.180 0.687 0.0102.3 Effective friction coefficientAccording to <strong>the</strong>ory of Storoschew [11] <strong>the</strong> frictioncoefficient in <strong>de</strong>ep drawing can be evaluated from<strong>the</strong> measured maximum punch force for eachprocess dimension [12], see figure 4.Fig. 2. Flow stress of Al99.5 in different thicknesses2.2 Friction functionThe punch force was measured in strip drawing testsand was used later in <strong>the</strong> calculation mo<strong>de</strong>l<strong>de</strong>scribed in [6]. For each punch diameter, a frictionfunction is <strong>de</strong>termined. A graphic display of <strong>the</strong>sefriction functions is shown in figure 3.Fig. 4. Effective friction coefficients from <strong>de</strong>ep drawingIn this <strong>the</strong>ory <strong>the</strong>re is only one friction coefficient.Thus <strong>the</strong> friction coefficient calculated using thismethod is call effective friction coefficient. By <strong>the</strong>seeffective friction coefficients <strong>the</strong> tribological sizeeffects can also be shown: with <strong>de</strong>creasing <strong>the</strong>process dimension <strong>the</strong> friction increases.3 FEM-SIMULATIONFig. 3. Friction functions from strip drawing testsA difference with a factor of about 1.5 between <strong>the</strong>friction functions with punch diameter of 1 and 503.1 Scaled strip drawing testsIn this work <strong>the</strong> software ABAQUS 6.6.3 was usedto simulate both forming processes. A 2-dimensional
mo<strong>de</strong>l was created for <strong>the</strong> strip drawing test, inwhich <strong>the</strong> tools were <strong>de</strong>fined as analytical rigid lineand <strong>the</strong> blank was <strong>de</strong>fined as <strong>de</strong>formable object. The4-no<strong>de</strong> bilinear plane stress element CPS4R wasused to mesh <strong>the</strong> blank. Within <strong>the</strong> thickness of <strong>the</strong>blank <strong>the</strong>re are four elements. For simulation of <strong>the</strong>experiments with blanks in different thicknesses, <strong>the</strong>flow stress curves of Al99.5 in different thicknesseswere applied respectively in <strong>the</strong> simulation mo<strong>de</strong>l.Using <strong>the</strong> normalization <strong>de</strong>scribed in [12] <strong>the</strong>simulated punch force vs. travel curves for stripdrawing with punch diameters of 1 and 50 mmshown in figure 5 were obtained.reason for this might be <strong>the</strong> assumption in <strong>the</strong>calculation mo<strong>de</strong>l: The normal pressure at <strong>the</strong> radiusis uniform [1]. However, <strong>the</strong> simulation shows twolocal contact zones, see figure 6. The pressure on<strong>the</strong>se two zones is much higher than <strong>the</strong> uniformdistributed pressure assumed in <strong>the</strong> calculationmo<strong>de</strong>l. Since <strong>the</strong> friction coefficient <strong>de</strong>pends on <strong>the</strong>normal contact pressure, if <strong>the</strong> pressure on <strong>the</strong>contact surface is not right, <strong>the</strong> incorrect frictioncoefficient will be used. Thus <strong>the</strong> simulated punchforce differs from <strong>the</strong> experimental one.Fig. 6. The local contact zones at radius of <strong>the</strong> die3.2 Scaled <strong>de</strong>ep drawingFig. 5. Comparison of simulated and experimental punch forcevs. punch travel from strip drawing testsFor changes of <strong>the</strong> process dimension <strong>the</strong> simulationprogram can not take into account <strong>the</strong> change of <strong>the</strong>size automatically. Thus <strong>the</strong> result of simulation formicro forming can not differ from that of macroforming using <strong>the</strong> conventional simulation method.Applying <strong>the</strong> friction function obtained above into<strong>the</strong> simulation, <strong>the</strong> simulated curves (<strong>the</strong> curveFEM-1 for <strong>the</strong> punch diameter of 1 mm, <strong>the</strong> curveFEM-50 for punch diameter of 50 mm) show <strong>the</strong>same trend as <strong>the</strong> experimental curves (<strong>the</strong> curveEXP-1 for <strong>the</strong> punch diameter of 1 mm, <strong>the</strong> curveEXP-50 for <strong>the</strong> punch diameter of 50 mm). Thenormalised punch force for punch diameter of 50mm is lower than that for punch diameter of 1 mm.All curves have <strong>the</strong> maximum point at <strong>the</strong>normalised punch travel of about 0.2. A FEMsimulationwith consi<strong>de</strong>ration of tribological sizeeffects was realised.The maximum point of <strong>the</strong> simulated curve FEM-1is about 11% lower than that of <strong>the</strong> experimentalcurve EXP-1. While <strong>the</strong> maximum point of <strong>the</strong> curveFEM-50 is about 8% lower than that of EXP-50. TheSimilar to <strong>the</strong> strip drawing a 3-dimensional mo<strong>de</strong>lwas created for <strong>de</strong>ep drawing. The effective frictioncoefficients from <strong>de</strong>ep drawing as well as <strong>the</strong>friction functions from strip drawing using <strong>the</strong> samepunch diameter were applied in <strong>the</strong> FEM-simulationfor each dimension. The comparison of <strong>the</strong>simulated and experimental punch force vs. punchtravel for <strong>de</strong>ep drawing with punch diameter of 1mm is shown in figure 7.Fig. 7. Comparison of simulated and experimental punch forcevs. punch travel from micro <strong>de</strong>ep drawingThe maximum punch force of <strong>the</strong> simulated curveusing <strong>the</strong> friction function is about 5% higher thanthat using <strong>the</strong> effective friction coefficient. Both of<strong>the</strong>m show a good agreement with <strong>the</strong> experimentalcurve from beginning till <strong>the</strong> maximum punch force.Then both simulated curves begin to <strong>de</strong>crease while
<strong>the</strong> experimental one shows nearly no trend to<strong>de</strong>crease. This result confirms our statement in [12],that <strong>the</strong> thickness of lubricant can result in anincrease in punch force, because in micro <strong>de</strong>epdrawing <strong>the</strong> sum of blank thickness and lubricantthickness might be more than <strong>the</strong> drawing clearance.This effect can not be <strong>de</strong>tected in macro <strong>de</strong>epdrawing and was also not implemented in <strong>the</strong> FEMsimulation.For punch diameter of 50 mm, <strong>the</strong> maximum punchforce of <strong>the</strong> simulated curve using friction functionis about 400 N lower than <strong>the</strong> experimental curve,while <strong>the</strong> one using effective friction coefficientshows a difference of about 1000 N, see figure 8.forming processes with consi<strong>de</strong>ration oftribological size effects.• The distribution of contact pressure will be takeninto account in our future work.ACKNOWLEDGEMENTSThe work reported in this paper is fun<strong>de</strong>d by <strong>the</strong> DeutscheForschungsgemeinschaft (DFG) within <strong>the</strong> project “Mo<strong>de</strong>llingof tribological size-effects in <strong>de</strong>ep drawing” (DFG project no.Vo 530/6). The authors would like thank <strong>the</strong> DFG for <strong>the</strong>irbeneficial support.Moreover <strong>the</strong> authors would like thank <strong>the</strong> institute of MetalForming and Casting (UTG) in Munich in Germany for carryout <strong>the</strong> tensile test for <strong>the</strong> Al99.5 in thicknesses of 0.02, 0.1,and 0.2 mm.REFERENCESFig. 8. Comparison of simulated and experimental punch forcevs. punch travel from macro <strong>de</strong>ep drawingThis means <strong>the</strong> <strong>the</strong>ory of Storoschew is not suited tocalculate <strong>the</strong> friction coefficient precisely frommeasured punch force in different dimensions.Oppositely <strong>the</strong> friction functions from strip drawingtests show a good scalability. However, inaccordance to <strong>the</strong> results in strip drawing, <strong>the</strong>simulated punch force vs. punch travel curve doesnot agree with <strong>the</strong> experimental curve perfectly. Thereason for that might be <strong>the</strong> distribution of contactpressure, since <strong>the</strong> local contact zones exist also in<strong>de</strong>ep drawing. Thus in our future work <strong>the</strong>calculation mo<strong>de</strong>l will be enhanced in or<strong>de</strong>r to takeinto account <strong>the</strong> distribution of contact pressure.4 CONCLUSIONS• Tribological size effects were observed in bothscaled strip drawing tests and <strong>de</strong>ep drawing.• The friction functions from strip drawing testscan be integrated into FEM-simulation e.g.ABAQUS. This enables to simulate sheet metal1. F. Vollertsen, Z. Hu, Tribological Size Effects in SheetMetal Forming Measured by a Strip Drawing Test,Annals of CIRP 2006, vol. 55/1, 291-294.2. D.D. Olssen, N. Bay, Prediction of Limits of Lubricationin Strip Reduction Testing, Annals of CIRP 2004, 53/1,231-234.3. P. Becker, H.J. Jeon, C. C. Chang, A.N. Bramley, AGeometric Approach to Mo<strong>de</strong>lling Friction in MetalForming, Annals of CIRP 2003, 52/1, 209-212.4. F. Vollertsen, Z. Hu, H. Schulze Niehoff, C. Theiler,State of <strong>the</strong> art in micro forming and investigations intomicro <strong>de</strong>ep drawing, Journal of Materials ProcessingTechnology, 2004, 151, 70-79.5. N. Tiesler, U. Engel, Microforming – Effects ofMiniaturisation, Proceedings of <strong>the</strong> 8th International<strong>Conference</strong> on Metal Forming, Eds. Pietrzyk, M.,Kusiak, J., ec al., Kraków, 2000, 355-3606. Z. Hu, H. Schulze Niehoff, F. Vollertsen, Determinationof <strong>the</strong> Friction Coefficients in Deep Drawing, Processscaling, eds.: Vollertsen F., Hollmann, F., BIAS-Verlag,ISBN 3-933762-14-6, Strahltechnik 24, 2003, 27-347. Z. Hu, F. Vollertsen, Scaled Friction Test Integrated inDeep Drawing, ICTMP2004, Denmark, Ed. Niels Bay,ISBN: 87-91035-12-0, 561-5688. Z. Hu, F. Vollertsen, Tribological Size Effects in SheetMetal Forming, ICTMP2007, Yokohama, Japan, Ed.Akira Azushima, ISBN 978-4-9903785-0-9, 163-1689. A. B. Richelson, E. van <strong>de</strong>r Giessen, Size Effects inSheet Drawing, 9th International <strong>Conference</strong> on SheetMetal 2001, eds. Duflou, J.R., Geiger, M., et al., 263-27010. A. Messner, Kaltmassivumformung MetallischerKleinstteile –Werkstoffverhalten, Wirkflaechen -reibung, Prozessauslegung-, Eds. Geiger, M., Feldmann,K., ISBN 3-87525-100-8, 199811. M.W. Storoschew, E. A. Popow, Grundlagen <strong>de</strong>rUmformtechnik, VEB Verlag Technik Berlin, 196812. Z. Hu, H. Schulze Niehoff, F. Vollertsen, Tribologicalsize effects in <strong>de</strong>ep drawing, ICNFT2007, eds. F.Vollertsen, S. Yuan, ISBN 978-3-933762-22-1, 573-582
Discrete Element method, a tool to investigate contacts in materialformingI. Iordanoff 1 , D. Richard 2 , S. Tcherniaieff 11 ARTS ET METIER PARITECH, LAMEFIP – Esplana<strong>de</strong> <strong>de</strong>s ARTS et Metiers, Talence, FRANCEURL: www.lamef.bor<strong>de</strong>aux.ensam.fre-mail: ivan.iordanoff@lamef.bor<strong>de</strong>aux.ensam.fr; Serge.tcherniaeff@bor<strong>de</strong>aux.ensam.fr2 <strong>INSA</strong> <strong>de</strong> LYON, LAMCOS – 18-20 Rue <strong>de</strong>s Sciences, 69621 Villeurbanne Ce<strong>de</strong>x, FRANCEURL: lamcos.insa-lyon.fre-mail:david.richard@insa-lyon.fr;ABSTRACT: This paper is <strong>de</strong>voted to <strong>the</strong> <strong>de</strong>scription of a numerical tool that allows <strong>the</strong> local study ofcontacts in material forming: Discrete Element Method (DEM). Discrete Element Methods allow <strong>the</strong> study oflocal properties (cohesion, <strong>the</strong>rmal generation, fractures) on process behavior. This tool is used as moleculardynamics but allows <strong>the</strong> simulation of much representative volumes. Discrete element method is applied as atool to un<strong>de</strong>rstand/propose/confirm, physical scenario involved in <strong>the</strong> contact zone. It is shown in this paperhow such numerical simulations can be used as a complementary tool for forming processes study. Examplesare given on <strong>the</strong>rmal study in cutting process, subsurface damages analysis in abrasion process and weldingjoint characterization in Friction Stir welding.Key words: Discrete Element Method, Abrasion process, Friction Stir welding, Tool Machining.1 INTRODUCTIONDiscrete element method has been wi<strong>de</strong>ly <strong>de</strong>velopedfor rheological study of true discrete materials likesand, pow<strong>de</strong>r and granular materials [1]. In <strong>the</strong> pastten years, <strong>the</strong>ir fields of applications have beenexten<strong>de</strong>d to heterogeneous materials like concrete,biological materials or foams. Their ability tosimulate multi body behavior is used for problemswhere:- A great number of dissociated elements mustbe taken into account,- A great number of <strong>de</strong>fault is encounteredThe main recent fields of applications are multifracturesproblems, where <strong>de</strong>tached elements mustbe taken into account (wear in tribology [2],avalanches in geophysic, milling, grinding …).In material forming or cutting, <strong>the</strong> contact zonebetween <strong>the</strong> tool and <strong>the</strong> working piece is often verydifficult to analyze because:- The affected area has little dimension,- High mechanical, rheological, <strong>the</strong>rmalgradient are involved,- Physical phenomena are highly dynamic.To analyze <strong>the</strong> contact behavior Go<strong>de</strong>t <strong>de</strong>veloped<strong>the</strong> third body concept [3]. This inclu<strong>de</strong>d a<strong>de</strong>scription of <strong>the</strong> formation and movement offragmented particles in <strong>the</strong> interface region. Tostudy <strong>the</strong> behavior of <strong>the</strong> third body insi<strong>de</strong> andoutsi<strong>de</strong> <strong>the</strong> contact, Berthier proposed [4] <strong>the</strong>tribological circuit which allows <strong>the</strong> study of masstransfers insi<strong>de</strong> <strong>the</strong> contact. Based on thistribological circuit and coupling Discrete Elementmo<strong>de</strong>ls (DEM) to experimental, but simplified, wearstudies, Fillot et al [5] proposed a set of equationsthat allows a qualitative mo<strong>de</strong>ling of wear as a massbalance in <strong>the</strong> contact area. Iordanoff et al. [6]showed how abrasion process can be studied as aparticular and controlled wear process.This paper first presents <strong>the</strong> Discrete ElementMethods <strong>de</strong>veloped in <strong>the</strong> special case of materialforming. Then, three examples are given to illustratehow this numerical tool can be used to study localproperties in material forming: investigation of SubSurface Damage in abrasion process, welding jointcharacterization in Friction Stir welding and <strong>the</strong>rmalinvestigation of <strong>the</strong> tool-chip contact during cuttingoperation.
2 NUMERICAL TOOL2.1 General <strong>de</strong>scriptionThe method <strong>de</strong>scribed is based on smooth particledynamic Method. The material is consi<strong>de</strong>red as a setof discrete particles that moves un<strong>de</strong>r a force field.The forces are contact forces to simulate multi bodyinteractions and joint forces to simulate a solid ma<strong>de</strong>of discrete elements. Particle movements arecalculated using an explicit algorithm to integrate<strong>the</strong> dynamic Newton law. A <strong>the</strong>rmal mo<strong>de</strong>l can becouple with <strong>the</strong> mechanical one. Both Conductionthrough contact and <strong>the</strong>rmal energy source due tomechanical dissipation are taken into account. Thetwo next paragraphs briefly <strong>de</strong>scribed <strong>the</strong>mechanical and <strong>the</strong>rmal part. More <strong>de</strong>tails can befound in references [2] and [7].2.2 Mechanical PartThe particle interaction laws <strong>de</strong>fine <strong>the</strong> micromechanical properties of <strong>the</strong> media. They aredivi<strong>de</strong>d into contact forces and joint forces. Everyparticle is subjected to contact force. This force actsonly when two particles geometrically interact. Twoadjacent particles belonging to <strong>the</strong> same solid arelinked by a solid joint that acts un<strong>de</strong>r traction andshear state.δ sδ ncContact Forceδ ntLink ForceFig. 1. Contact and Link force calculation.Contact forceContact force is divi<strong>de</strong>d into three parts: repulsion,adhesion (both are energy conservative) and energydissipation. Geometrical interaction δ nc allows <strong>the</strong>force calculation (Fig.1).• Repulsion is represented by a linear spring,whose stiffness is K. Repulsive force F r is:Fr= K * δnc(1)• Adhesion has been simplified to a constant γ:Fa= γ(2)• The energy dissipation in <strong>the</strong> contact is due to<strong>the</strong> damping force written as:Fd = 2αK.M &ij* δnc(3)where α is <strong>the</strong> damping coefficient (
een neglected due to <strong>the</strong> strong <strong>de</strong>nsity of <strong>the</strong>domain and <strong>the</strong> higher influence of diffusion.3 APPLICATIONS3.1 SSD Study in abrasion process.zyPeriodical boundariesUpper wallDegradableFirst bodyImposed velocityAbrasive particlesLower wallxFig.2 Simulated domain3.1.a Simulated domainThe studied material is silica. According to fig. 2,<strong>the</strong> upper first body (Silica piece to be surfaced) isconstituted by spheres linked toge<strong>the</strong>r by elasticsolid joints. This first body is linked to <strong>the</strong> upperwall. A normal load is applied to <strong>the</strong> upper wallwhich is free to move along axis z. The lower firstbody (tool) is simply <strong>de</strong>fined as a lower rigid wallma<strong>de</strong> of adjacent spheres. A constant velocity alongx is applied to <strong>the</strong> lower wall. The abrasive particlesare plates composed by 4 adjacent spheres linked byan elastic non breakable solid link.The effect of abrasive size and abrasive quantitythrough <strong>the</strong> contact are studied. Abrasive size is <strong>the</strong>same than silica particles (*1) or twice silicaparticles (*2). Table 1 summarizes <strong>the</strong> studied cases.Nb of Abra. plates abrasive sizeCase ‘DiscreteBig’ 6 *2Case ‘LayerOfLittle’ 39 *1Case ‘DiscreteLittle’ 19 *1Case ‘L.ayerOfbig’ 24 *2Table 1 :Abrasive layer <strong>de</strong>finition.3.1.b ResultsCalculations are carried out till a certain amount ofsilica particle is removed from <strong>the</strong> silica volume, by<strong>the</strong> effect of broken links. The fixed amount is 150particles. Broken links through <strong>the</strong> volume areplotted in terms of <strong>the</strong> distance from <strong>the</strong> surface.Curves fig. 3 show <strong>the</strong> results. The thickness isdivi<strong>de</strong>d by particle mean radius.Nb/unit of Volume10 010 -110 -210 -31 : DiscreteBig2 : DiscreteLittle3 : LayerOfLittle4 : LayerOfBig12 45 0 10 5 15 10 20 15 25 20 3025Dimensionless ThicknessFig.3 :Number of broken joint through <strong>the</strong> thicknessThe number of broken joints <strong>de</strong>creases exponentiallywith <strong>the</strong> <strong>de</strong>pth. It greatly <strong>de</strong>pends on abrasivegeometrical properties and quantity. A little numberof big abrasive particles creates more residual cracksin <strong>the</strong> material. These results are qualitatively inaccordance with experimental results [9]. This firstsimple study <strong>de</strong>monstrates how discrete elementsimulations have <strong>the</strong> ability to simulate <strong>the</strong>formation of a great number of cracks and <strong>the</strong> linkbetween sub surface damage and abrasive properties.33.2 FSW joint characterization50+100454035-10V low302520150 0.1 0.2 0.3 0.4 0.5 0.6 0.7 0.8 0.9 1V high0% 50%100%Fig.4 : quality of mixture in an FSW joint.Simulating friction Stir welding requires <strong>the</strong>simulation of material flow, material mixture, toolmaterialcontact and <strong>the</strong>rmo mechanical coupling.D.E.M. could be in that case an interesting tool,because it has been wi<strong>de</strong>ly used to simulate mixtureof true granular flow. A first simulation is carriedout with a tool that passes through two bodiesinitially in contact (two colours in fig.4). The bodiesare simulated by an assembly of cohesive sphericalparticles. The particles of <strong>the</strong> two bodies are able tomix thanks to <strong>the</strong> rotating tool that pass through <strong>the</strong>interface. Fig.4 shows <strong>the</strong> result, in terms of mixturequality for two cases. For one simulation <strong>the</strong>translation velocity has <strong>the</strong> same or<strong>de</strong>r of magnitu<strong>de</strong>than <strong>the</strong> rotating velocity. For <strong>the</strong> o<strong>the</strong>r one <strong>the</strong>translation velocity is largely less than rotatingvelocity. It is found that <strong>the</strong> quality of mixture is
much better when rotating velocity is high comparedto translation velocity3.3 Thermal Tool-Chip Contact investigationPeriodical boundariesAIR/CHIP SURFACEPressureCHIPVelocityCUTTING TOOL SURFACEFig. 5. Tool-chip contact domain in DEMThe chip is mo<strong>de</strong>lled as a set of cohesive sphereswith Steel properties. The upper wall represents <strong>the</strong>contact between <strong>the</strong> chip and <strong>the</strong> ambient air (forconvection process) and <strong>the</strong> lower wall is <strong>the</strong> cuttingtool surface (for diffusion process) sliding on <strong>the</strong>chip. During its generation, <strong>the</strong> chip faces differentpressure fields from high levels (penetration of <strong>the</strong>tool in <strong>the</strong> material) to low levels (evacuation of it).The rheology of <strong>the</strong> chip greatly varies for each levelof constraint, leading to different velocityaccommodation processes and heat generationlocalisation [7]. The pressure effects on temperatureincrease within <strong>the</strong> chip and <strong>the</strong> tool are studied,assuming that all <strong>the</strong> mechanical dissipative power(from Eq. 3) is converted into heat.Chip thicknessToolLow pressureIntermediate pressureHigh pressure0 10 20 30 40 50 60 70 80Temperature increase °KFig. 6. Temperature profiles in <strong>the</strong> chip and part of <strong>the</strong> toolthickness for 3 different applied pressures.Simulations have been carried out for a slidingvelocity of 0.58m/s and three pressures (10, 20 and200Mpa). It shows that <strong>the</strong> air plays an importantinsulating role: <strong>the</strong> maximum temperature is at <strong>the</strong>air-chip interface. The temperature increase of <strong>the</strong>tool is very small compared to <strong>the</strong> chip, <strong>the</strong> diffusionallowing an efficient evacuation of <strong>the</strong> heat,especially during <strong>the</strong> high pressure process. Thesefirst results are in accordance with classical <strong>the</strong>rmalstudy of <strong>the</strong> tool-chip interface.4 CONCLUSIONThe discrete Element mo<strong>de</strong>l has been presented.Three examples showed <strong>the</strong> capability of suchsimulations to analyse locally <strong>the</strong>rmo mechanicalproperties of contacts between <strong>the</strong> tool and <strong>the</strong>material. The studied cases are very simplified butallow finding classical results from <strong>the</strong> literatures.Generally, to find such results with continuousmo<strong>de</strong>ls, both rheological laws and numericalmethods reach high level of complexity. <strong>Here</strong>, <strong>the</strong>micro-mechanical mo<strong>de</strong>l is simple and <strong>the</strong> behaviouris complex (multi-cracks, high <strong>de</strong>formation levels,<strong>the</strong>rmo-mechanical interaction). D.E.M is apromising tool for <strong>the</strong> material forming field, wherematerials are submitted to very high stress, strainand <strong>the</strong>rmal gradients and where rheologicalcharacterisation is still a true challenge. The main<strong>de</strong>fault of such method is <strong>the</strong> limitation in terms of<strong>the</strong> number of simulated particles (10 4 to 10 6 ) due tocalculation duration. Coupling discrete mo<strong>de</strong>l in <strong>the</strong>contact areas to continuous mo<strong>de</strong>l elsewhere shouldbe a solution for future and more realistic studies.REFERENCES1. GDR MIDI, On Dense Granular Flows, Eur. Phys. J. E14, 341-365, 20042. Fillot, Iordanoff, Berthier, “Mo<strong>de</strong>lling third body flowswith a discrete element method-a tool for un<strong>de</strong>rstandingwear with adhesive particles”, Tribology International,Volume 40, Issue 6, June 2007, Pages 973-9813. Go<strong>de</strong>t, M., 1984, “The Third Body Approach: aMechanical View of Wear”, Wear, 100, pp. 437-452.4. Berthier, Y., 1995, “Maurice Go<strong>de</strong>t’s Third Body”, 22 ndLeeds-<strong>Lyon</strong> Symposium on Tribology, Tribology series,31, pp. 21-30.5. N.Fillot, I. Iordanoff, Y. Berthier : « Wear mo<strong>de</strong>lling and<strong>the</strong> Third Body concept », Wear, Elsevier, 2007, Vol.262n°7-8, pp. 949-957.6. Iordanoff, I., Charles, J.L., 2007, “Discrete ElementMethod: An Helpful Tool for Abrasion Process Study”,proceedings of <strong>the</strong> I MECH E Part B, Journal ofEngineering Manufacture, Vol 221, Vol 6, pp 1007-1019.7. Richard, D., Iordanoff, I., Renouf, M., Berthier, Y., <strong>2008</strong>,“public ASME <strong>2008</strong>”, to be published in ASME Journal oftribology8 Verlet, L., 1967, Computer “Experiments” on ClassicalFluids. I. Thermodynamical Properties of Lennard-JonesMolecules, Phys. Rev., 159, pp. 98-1039 T. Sutatwala, L. Wong, P. Miler, M. D. Feity, J.Menapace, R. Steele, P. Davis and D. Walmer, "Subsurfacemechanical damage distribution during grinding offused silica", J. Non Crys. Sol. 352 (2006) 5601-561710 Vargas, W. L., McCarthy, J. J., 2001, “Heat Conductionin Granular Materials,” AIChE Journal, 47, pp. 1052-10
Simulation of interface temperature and control of lubrication in <strong>the</strong>study of friction and wear in cold rollingK. Louaisil 1 , M. Dubar 1* , R. Deltombe 1 , A. Dubois 1 , L. Dubar 11 Laboratoire d’Automatique, <strong>de</strong> Mécanique et d’informatique Industrielles et Humaines, UMR 8530Université <strong>de</strong> Valenciennes et du Hainaut Cambrésis, F-59313 Valenciennes Ce<strong>de</strong>x 9, FranceURL: www.univ-valenciennes.fr/LAMIH/*e-mail: mirentxu.dubar@univ-valenciennes.frABSTRACT: A prototype testing <strong>de</strong>vice called upsetting rolling test (URT) was <strong>de</strong>veloped a few years agoand was recently optimised in our laboratory to simulate mechanical and <strong>the</strong>rmal contact conditions in coldrolling. Moreover a new experimental protocol has been <strong>de</strong>signed to reproduce <strong>the</strong> industrial quasi-boundarylubrication regime. Numerous experiments have been <strong>the</strong>n carried out to study <strong>the</strong> influence of contacttemperature and forward slip on friction, iron fines residues and microscopic surface aspects. A greatinfluence of temperature on friction and wear has been put forward. An increase of <strong>the</strong> Coulomb frictioncoefficient associated with a <strong>de</strong>crease of <strong>the</strong> iron fines quantities has been shown when temperature increaseswhich seems to indicate more adhesive wear.Key words: Cold rolling; Experimental simulation; Lubrication; Interface temperature; Friction; Iron fines1. INTRODUCTIONIn cold rolling, contact at roll-strip interface, whichis <strong>the</strong> main location of slipping, chattering orimportant wear rate phenomena, has to becontrolled. Thus a simulation test, <strong>the</strong> UpsettingRolling Test (URT) [1], was <strong>de</strong>veloped in ourlaboratory LAMIH to study <strong>the</strong> contact for <strong>the</strong>industrial Sendzimir’s 20-high, a few years ago. Thisreversible mill is used for reduction of low carbonsteel strips. Lubrication is ma<strong>de</strong> by an emulsion ofoil in water.All industrial contact conditions have to bereproduced on URT tool. Mechanical, <strong>the</strong>rmal andlubrication contact conditions are first presented andspecified. Then <strong>the</strong> principle and <strong>the</strong> methodology of<strong>the</strong> URT and its recent optimisations are <strong>de</strong>scribed.Finally many tests have been performed in differentcases of contact temperature and relative speed.Results such as mean Coulomb friction coefficient,iron fines pollution and observations of strip surfaceaspects are reported and analysed.2. INDUSTRIAL CONTACT CONDITIONS2.1 Mechanical contact conditionsOperators drive <strong>the</strong> mill with force parameters: <strong>the</strong>roll separating force, <strong>the</strong> rear and front tensions and<strong>the</strong> torque. Output parameters are exit speed, V s ,peripheral roll speed, R and reduction rate. Motionparameters are generally <strong>de</strong>fined by <strong>the</strong> forward slip,S fwd = (V s – R)/R. The strip is driven forwardthanks to <strong>the</strong> front tension and <strong>the</strong> frictional forcesbetween rolls and strip [1].2.2 Thermal contact conditionsTemperature has a <strong>de</strong>cisive effect on lubrication,especially on <strong>the</strong> efficiency of additives [2].The interface temperature <strong>de</strong>pends on a lot offactors: contact partners properties as well as rollingparameters and convective cooling by <strong>the</strong> emulsionwater are influent. First, heat created by plasticstrain and friction are respectively favoured byreduction rate and rolling speed [3]. Secondly, agood efficiency of a<strong>de</strong>quate lubricant additiveslimits friction and heat generation. Finally, heat
transfer across <strong>the</strong> roll-strip interface has also a<strong>de</strong>cisive impact. From a general point of view <strong>the</strong>contact can be <strong>the</strong>rmally <strong>de</strong>fined by a mean contact<strong>the</strong>rmal resistance which <strong>de</strong>pends on strip and rollproperties, such as roughness and conductivity,contact pressure and lubricant behaviour [4,5].Never<strong>the</strong>less, it is quite important to note that <strong>the</strong>reare important temperature gradients across <strong>the</strong>interface [4]. It present peaks on asperity locationswhere conditions, such as local plastic strain andfriction, are more severe and where a temperature of300°C could be locally reached [6].Therefore, consi<strong>de</strong>ring all <strong>the</strong>se factors, it is quitedifficult to <strong>de</strong>termine <strong>the</strong> mean contact temperaturecorresponding to <strong>the</strong> studied process from literature.In<strong>de</strong>ed <strong>the</strong> <strong>the</strong>rmal studies for cold rolling weregenerally carried out on tan<strong>de</strong>m mill with notably<strong>the</strong> use of bigger work rolls than on a Sendzimir one[3,4,7]. According to <strong>the</strong> value of <strong>the</strong> convectivecoefficient used to <strong>de</strong>fine <strong>the</strong> cooling by emulsion,<strong>the</strong> mean interface temperature is evaluated between100°C and 160°C [7].As a conclusion, <strong>the</strong> mean contact temperaturecannot be <strong>de</strong>fined accurately for process analysedherein: a temperature of 120°C will be first tested.2.3 Lubrication contact conditionsis representative of <strong>the</strong> lubrication regime. In coldrolling process, most of <strong>the</strong> computations carried outat <strong>the</strong> end of <strong>the</strong> roll bite estimate this ratio at morethan 0,8 [8]: strip-roll interface is essentiallygoverned by contact between asperities. Industrialstrips have been observed by SEM after pickling(Fig. 1.a), after two passes (Fig 1.b) and in its finalstate after four passes (Fig. 1.c). Once <strong>the</strong> secondpass is performed (Fig 1.b), a scaly surface ispointed out: <strong>the</strong> quasi-boundary lubrication regimeconcerning <strong>the</strong> studied process is confirmed.3. UPSETTING ROLLING TEST (URT)3.1 ObjectivesThe upsetting rolling test (Fig. 2.) was <strong>de</strong>signed byR. Deltombe & al. [1] and has been recentlyoptimised. The mechanical running of <strong>the</strong> machineis <strong>de</strong>tailed in [1]. Its aim is to reproduce contactcharacteristics in or<strong>de</strong>r to study <strong>the</strong>ir influence on<strong>the</strong> following parameters:• friction: a mean Coulomb friction coefficient isi<strong>de</strong>ntified [1]• iron fines production [1]• surface aspects thanks to SEM observationsFig. 2. Upsetting rolling test <strong>de</strong>signed by authors’ laboratoryLAMIH [1]Fig. 1. SEM observations (a) pickled strip (b) industrial rolledstrip after two passes (c) industrial rolled strip after four passes(d) experimental rolled strip after two passes on URTThe contact ratio, R = A r /A a , where A r and A a arerespectively <strong>the</strong> real and <strong>the</strong> apparent contact areas,3.2 Principle: reproduction of industrial contactconditions3.2.a Materials and geometryIndustrial roll and strip specimens are used in or<strong>de</strong>rto reproduce industrial geometry roll bite and realmaterial contact conditions.3.2.b Stresses and plastic strainIt is first important to note that <strong>the</strong> test is driven in adifferent, but equivalent, way than on industrial mill.The test parameters are sliding forward and
eduction rate (normal and tangential forces aremeasured as output parameters). A methodology was<strong>de</strong>veloped by Deltombe & al. [1]: thanks toindustrial and experimental FEM mo<strong>de</strong>ls, <strong>the</strong> testparameters enabling <strong>the</strong> experimental reproductionof industrial contact stresses and industrial plasticstrain are computed.3.2.c Thermal conditionsA convective heating system has been recently<strong>de</strong>signed to control interface temperature. Thissystem is associated with a convective coolingsystem to protect sensors and thus to avoid drift ofmeasurements or even <strong>the</strong>ir <strong>de</strong>gradation.3.2.d Lubrication conditionsA new methodology of lubrication application hasbeen <strong>de</strong>signed to solution this problem andreproduce industrial lubrication regime.4. SIMULATION OF LUBRICATION4.1 Lubrication by oil-in-water emulsion in coldrolling processThe Wilson <strong>the</strong>ory, called dynamic concentration<strong>the</strong>ory [9] corresponds to <strong>the</strong> process studied herein.Because of oil high viscosity, this <strong>the</strong>ory supposesthat quasi no water or a tiny amount of water enters<strong>the</strong> roll bite [10]: water is mainly used as coolantfluid.The thickness of oil penetrating <strong>the</strong> contact isdirectly influenced by rolling speeds, oil viscosityand concentration, materials, contact pressure androll bite geometry [8]. In section 2, lubrication was<strong>de</strong>fined as almost boundary. Generally <strong>the</strong> minimallimit of a mixed regime thickness is consi<strong>de</strong>re<strong>de</strong>qual to:h lim = 0,35.R a [6] (1)where R a = mean strip roughness.4.2 Methodology: computation of required oilquantity to applyNo water is consi<strong>de</strong>red entering <strong>the</strong> roll bite: testwill be ma<strong>de</strong> with neat oil. Speeds not beingreproducible, lubricant feeding cannot be simulatedon URT: <strong>the</strong> solution is to apply <strong>the</strong> good amount ofneat oil on URT specimen beforehand. The usedlubricant thickness for this study is <strong>the</strong> most criticalvalue we could meet in cold rolling, i.e. h lim , <strong>de</strong>finedin 4.1. The mass corresponding to this thickness iscomputed according to <strong>the</strong> following procedure.Thanks to a 3D profilometer, <strong>the</strong> first step is tocalculate <strong>the</strong> mean roughness, R a , of strip studiedherein and to <strong>de</strong>duce (1) <strong>the</strong> corresponding thicknessto apply on it. Then, from a 5 mm² specimen surfacepreviously analysed by <strong>the</strong> profilometer, computersoftware enables to calculate which volume of oil isnecessary to fill in <strong>the</strong> valleys in or<strong>de</strong>r to obtain <strong>the</strong>required lubricant thickness computed in first step.Finally, knowing oil <strong>de</strong>nsity <strong>the</strong> mass is <strong>de</strong>duced.As a validation of <strong>the</strong>se recent optimisations,experimental surface aspect shows a scaly surface asfor <strong>the</strong> industrial one after two passes (Fig. 1.b, 1.d).5. TESTS AND RESULTS5.1 Test objectives and conditionsThe aim is to analyse <strong>the</strong> influence of rollingparameters such as <strong>the</strong> pass number, <strong>the</strong> interfacetemperature and <strong>the</strong> forward slip on friction andwear (iron fines creation and surface aspects). All<strong>the</strong> test configurations are indicated for each pass ontable 1. The quantity of lubricant applied onspecimen strip is <strong>the</strong> mass corresponding to <strong>the</strong>thickness h lim (Eq. 1). Each configuration of test hasbeen reproduced twenty five times.Table 1. URT test configurations for each passConfiguration number 1 2 3 4Forward slip 2% 2% 7% 7%Interface temperature 40°C 120°C 40°C 120°C5.2 Results and discussions• Friction:The coefficient values corresponding to eachconfiguration are represented on Fig. 3.a:o Coulomb friction coefficient is higher in passtwo than in pass one whatever <strong>the</strong> testconfiguration. This can be explained by <strong>the</strong>increase of <strong>the</strong> contact ratio with <strong>the</strong> passnumber. As an evi<strong>de</strong>nce, nearly no hole (orlubricant “traps”) remains once pass 2 has beenperformed (Fig 1.b)o Coulomb friction coefficient increases withtemperature. For a quasi-boundary lubrication
egime, <strong>the</strong> contact behaviour is governed bycontact between asperities where no lubricantfluid film can remain [2]. To prevent realcontacts between roll and strip at asperitieslocations, additives react with surfaces to form aprotective film. The friction reducer additives are<strong>the</strong> polar ones and <strong>the</strong>y get <strong>de</strong>sorbed from acritical temperature estimated at about 100°C[2].o No clear influence of forward slip on frictioncoefficient is observed• Iron fines residues:After pass one, iron fines are measured only on roll.After pass two, <strong>the</strong>y are measured both on URTspecimen and roll. The quantities of iron finesresidues collected for each configuration test arerepresented on Fig. 3.b:o The quantity of iron fines measured <strong>de</strong>creaseswith temperature contrary to friction coefficient.As previously observed (Fig. 3.a), a highercontact temperature causes a higher frictioncoefficient which favours <strong>the</strong> wrenching ofasperities: a high amount of iron fine residuesshould be found [1] contrary to what has beenobserved and measured (Fig. 3.b). As aconsequence, <strong>the</strong> high temperature conditionsimply that more wrenched particles must adhere(directly or indirectly) on strip or roll and cannotbe collected.o No clear influence of forward slip on <strong>the</strong>quantity of iron fine residues is observeda) b)Fig. 3. Results for each test configuration (a) Mean computedCoulomb coefficient (b) Total iron fine residues collected onroll and strip6. CONCLUSIONS AND PERSPECTIVESTo better un<strong>de</strong>rstand cold rolling contact behaviour anew methodology was created and recentlyoptimised to simulate mechanical, <strong>the</strong>rmal andlubrication contact conditions. It has enabled topoint out that:o friction increases with temperature because of<strong>the</strong> <strong>de</strong>sorption of polar additiveso quantity of iron fines residues <strong>de</strong>creases withtemperature. It means that adhesive wear andtransfer layer formation is favoured by a hightemperature.o friction increases with <strong>the</strong> number of <strong>the</strong> passbecause of <strong>the</strong> <strong>de</strong>crease of <strong>the</strong> contact ratioDespite <strong>the</strong>se interesting conclusions, importantquestions remain: What are <strong>the</strong> nature and <strong>the</strong> realimpact of <strong>the</strong> transfer layer? What is <strong>the</strong> pertinenceof <strong>the</strong> current industrial measurement of iron finespollution? Finally, what are <strong>the</strong> behaviour and <strong>the</strong>role of <strong>the</strong> lubricant additives?ACKNOWLEDGEMENTSThe present research work has been supported by Myriad, aCORUS group company, <strong>the</strong> CNRS, <strong>the</strong> European Community,<strong>the</strong> Association Nationale <strong>de</strong> la Recherche Technique, <strong>the</strong>Conseil Régional du Nord Pas <strong>de</strong> Calais. The authors gratefullyacknowledge <strong>the</strong> support of <strong>the</strong>se institutions.REFERENCES[1] R. Deltombe, M. Dubar, A. Dubois, L. Dubar, A newmethodology to analyse iron fines during steel cold rollingprocesses, Wear 254 (2003) 211-221[2] P. Montmitonnet, Tribologie du laminage à froid <strong>de</strong> tôles,Revue <strong>de</strong> la Métallurgie Paris, N°2 (2001), 125-130[3] S. Matysiak, S. Konieczny, A. Yevtushenko, Distribution offriction heat during cold rolling of metals by using compositerolls, Numerical Heat Transfer, Part A, 34: 719-729 (1998)[4] A.K. Tieu, P.B. Kosasih, A. Godbole, A <strong>the</strong>rmal analysis ofstrip-rolling in mixed film lubrication with O/W emulsions,Tribology International 39 (2006) 1591-1600[5] A. Boutonnet, Etu<strong>de</strong> <strong>de</strong> la résistance <strong>the</strong>rmique <strong>de</strong> contactà l’interface <strong>de</strong> soli<strong>de</strong>s déformables en frottement : applicationaux procédés <strong>de</strong> forgeage, Thèse <strong>INSA</strong> <strong>de</strong> <strong>Lyon</strong>, 1998[6] J. Molimard, Etu<strong>de</strong> expérimentale du régime <strong>de</strong>lubrification en film mince – Applications aux flui<strong>de</strong>s <strong>de</strong>laminage, Thèse <strong>INSA</strong> <strong>de</strong> <strong>Lyon</strong> (1999)[7] O. U. Khan, A. Jamal, G. M. Arshed, A. F. M. Arif, S. M.Zubair, Thermal analysis of a cold rolling process – Anumerical approach, Numerical Heat Transfer, Part A, 46:613-632 (2004)[8] N. Letalleur, Influence <strong>de</strong> la géométrie <strong>de</strong>s aspérités dansun contact hydrodynamique ultramince. Effets locaux etcomportements moyen, Thèse <strong>INSA</strong> <strong>de</strong> <strong>Lyon</strong> (2000)[9] A.D. Bugg, A. Shirizly, J.G. Lenard, The use of emulsionsduring cold rolling of steel strips,, The second Europeanrolling conference rolling , VASTERAS Suè<strong>de</strong>, (2000)[10] K. Dick, J. G. Lenard, The effect of roll roughness andlubricant viscosity on <strong>the</strong> loads on <strong>the</strong> mill during cold rollingof steel strips, Materials Processing Technology 168 (2005) 16-24
Metrology of <strong>the</strong> burr amount - correlation with blanking operationparameters (blanked material – wear of <strong>the</strong> punch)H. Makich 1 , L. Carpentier 1 , G. Monteil 1 , X. Roizard 1 , J. Chambert 2 , P. Picart 21 LMS – ENSMM, 26 Chemin <strong>de</strong> l’Epitaphe 25000 Besançon, FranceURL: www.lms.ens2m.fre-mail:hamid.makich@ens2m.fr; Luc.Carpentier@ens2m.fr;guy.monteil@ens2m.fr; xavier.roizard@ens2m.fr2 Institut FEMTO-ST – DMARC, 24 Chemin <strong>de</strong> l’Epitaphe 25000 Besançon, FranceURL: www.femto-st.fre-mail: jchamber@univ-fcomte.fr; philippe.picart@univ-fcomte.frABSTRACT: Blanking burr and punch wear are two phenomena closely linked. This leads to consi<strong>de</strong>r burr as<strong>the</strong> best criterion for regrinding or renewing tools. Thus, in or<strong>de</strong>r to control <strong>the</strong> quality and cost in blankingprocess, it is necessary to measure with <strong>the</strong> best accuracy <strong>the</strong> amount of burr and wear punch. To do this, amethod for measuring <strong>the</strong> volume of burr was <strong>de</strong>veloped. This method is based on <strong>the</strong> use of 3Dtopographical images. On <strong>the</strong> o<strong>the</strong>r hand, punch wear was calculated by combination of a ma<strong>the</strong>maticalmo<strong>de</strong>l to <strong>the</strong> geometric shape of punch. This mo<strong>de</strong>l gives <strong>the</strong> geometry variations of <strong>the</strong> punch, <strong>de</strong>pending on<strong>the</strong> number of press storks. At <strong>the</strong> end, <strong>the</strong> aim of this study is to i<strong>de</strong>ntify a relationship between burr andpunch wearKey words: Blanking, Burr amount, Punch wear, Cut edge profile, Worn geometry1 INTRODUCTIONIn <strong>the</strong> blanking industry, <strong>the</strong> punch wear has asignificant impact on production. In particular,important wear causes a wrong geometry of <strong>the</strong> cutpieces, which can lead to a rejection of products.Among o<strong>the</strong>r <strong>de</strong>fects, <strong>the</strong> apparition of burr is <strong>the</strong>most incapacitating in <strong>the</strong> use of <strong>the</strong> blanking piece.So, in or<strong>de</strong>r to overcome this problem, industrialsregrind <strong>the</strong>ir tools after a number of press storks. Butthis operation has a negative consequence on costs.In fact, <strong>the</strong> production stopping for regrindingpunches creates substantial losses for <strong>the</strong> industry.Thus, it is important to control aspects of <strong>the</strong>blanking operation leading to <strong>the</strong> appearance of burr.To do this, it is necessary to have in advance areliable way to measure <strong>the</strong> quantity of burr. In thispaper, we present an original method for <strong>the</strong>quantification of <strong>the</strong> volume of burr. Moreover, afirst approximation of <strong>the</strong> burr amount with <strong>the</strong> levelof wear and <strong>the</strong> cutting materiel is also presented.2 BLANKING BURRamount, <strong>the</strong> cutting pieces can be unusable.Fig. 1.Geometry of <strong>the</strong> cutting edge.HR : Roll-over <strong>de</strong>pth.HS : Sheared edge.HF : Fracture <strong>de</strong>pth.Hb : Burr height.φ : Fracture angle.Given <strong>the</strong> important issues related to <strong>the</strong> appearanceof blanking burr, a lot of work has been un<strong>de</strong>rtakento explain <strong>the</strong> appearance. Most of this work was<strong>de</strong>voted to <strong>the</strong> study of <strong>the</strong> influence of blankingconditions (clearance, radius, etc...) (Fig. 2), on <strong>the</strong>appearance of burr.The burr occurs on <strong>the</strong> cutting edge of pieces (fig.1),this presence is one of <strong>the</strong> most serious limitations of<strong>the</strong> blanking process. In<strong>de</strong>ed, beyond a certain burr
eJ / 2βD pD mr pJ / 2PunchFig. 2.Geometrical parameters characteristic of blanking.The main conclusions of <strong>the</strong>se studies show that <strong>the</strong>size of burr <strong>de</strong>pends mainly on <strong>the</strong> blankingclearance, <strong>the</strong> wear condition of <strong>the</strong> tool edge andproperties of <strong>the</strong> cutting materials and <strong>the</strong> toolmateriel. According to <strong>the</strong> studies carried out in [1]and [2], it appears that <strong>the</strong> wear promotes <strong>the</strong>appearance of burr and that <strong>the</strong> increase in <strong>the</strong>blanking clearance results in an increase in <strong>the</strong>fracture angle of <strong>the</strong> shear zone and <strong>the</strong> height of <strong>the</strong>burr. This is confirmed also in [3] and [4]. Withregards to <strong>the</strong> properties of blanking materials,Gréban in [5] says that <strong>the</strong> composition of cuttingalloys has a strong influence on <strong>the</strong> quantity of burrsthat is created during <strong>the</strong> blanking operation.However, <strong>the</strong> works are more on <strong>the</strong> <strong>the</strong>oreticalstudy of <strong>the</strong> conditions of burr appearance, than onan experimental metrology on <strong>the</strong> burr amount.αr mBlank-hol<strong>de</strong>rSheet metalDie3.1 MetrologyWe can see that in literature, <strong>the</strong>re are many ways ofmeasuring burr, but fundamentally based on a<strong>de</strong>structive test of blanking pieces and <strong>the</strong>refore ofmetrology in a few positions of <strong>the</strong> cutting edge.O<strong>the</strong>r methods that have been proposed formetrology burr heights were <strong>the</strong> non-contact ortactile optical profilometry [7], or <strong>the</strong> visionmetrology [8] of <strong>the</strong> cutting edge, which is aimed atpieces with straight faces. The latter allows <strong>the</strong>naccess to <strong>the</strong> profile heights of burr over a length ofcut board of 4mm. Ano<strong>the</strong>r example is ameasurement using <strong>the</strong> shadow of burr or a moretraditional measure, <strong>the</strong> mechanical profilometry.3.2 Crushed burrIn <strong>the</strong> case of progressive blanking, complexgeometry of <strong>the</strong> parts is produced by several pressstrokes, which has <strong>the</strong> effect of crushing burrs. Thismakes it more difficult to measure <strong>the</strong> height of <strong>the</strong>burr by traditional means.3 METROLOGY OF BURRThe possibility to estimate <strong>the</strong> burr size on <strong>the</strong> blankpieces remains of great importance in <strong>the</strong> blankingindustry, because <strong>the</strong> quality of <strong>the</strong> products is<strong>de</strong>termined with <strong>the</strong> evaluation of <strong>the</strong> level ofacceptable burr on <strong>the</strong> parts. It is possible to study,in <strong>the</strong>ory, <strong>the</strong> emergence of blanking burrs.However, if we wish to verify <strong>the</strong> <strong>the</strong>oreticalpredictions, it is necessary to be able to accuratelyand reliably measure <strong>the</strong> quantity of burrs. Tosummarize, we can return to what might be a<strong>de</strong>finition of <strong>the</strong> burr height, <strong>the</strong> main criterionmentioned here. According to [6], because <strong>the</strong> sheetcan have a residual macroscopic <strong>de</strong>formation during<strong>the</strong> cutting operation, <strong>the</strong> height of burr is <strong>de</strong>fined as"<strong>the</strong> difference between <strong>the</strong> highest point of burr and<strong>the</strong> surface of <strong>the</strong> sheet metal immediately adjacentto <strong>the</strong> burr". This <strong>de</strong>finition seems satisfactory andwill be <strong>the</strong> basis for <strong>de</strong>velopment of our work.Fig. 3. Crushed burr.This has prompted us to seek, in this work, a newmethod more able to give us a precise quantificationof <strong>the</strong> crushed burr. To do this, we sought to <strong>de</strong>fine areference plan around <strong>the</strong> cutting form, because <strong>the</strong>adjacent sheet is distorted.3.3 Establishing a means of measurementIn our approach to <strong>the</strong> burr quantification, we soughtto meet a need, which is to confront <strong>the</strong> <strong>the</strong>oreticalresults with experimental robust measurements.3.3.a Images AcquisitionThe <strong>de</strong>vice used is a microscope Infinitefocus ®
Alicona (Fig.4). It is based on an optical microscopecoupled to a camera. Unlike a confocal microscope,which uses a monochromatic sensor, <strong>the</strong> <strong>de</strong>vice usesa sensor of contrast in color. On <strong>the</strong> whole height,<strong>the</strong> microscope collects images which are <strong>the</strong>nanalysed by <strong>the</strong> software. The latter analyses eachpixel and compares it to its neighbours to see if it isfocused or not. Then, it reconstructs a threedimensionalimage from this focus. From this image,surface-, volume-, surface state- and topographydimensional measurements are possible. Inaccordance with selected lens, <strong>the</strong> image size rangesfrom 2.1x1.6mm ² to 103x83 µm² and resolution inheight from 444nm to 20nm. If <strong>the</strong> sample or area ofinterest is larger than <strong>the</strong> size of capture of <strong>the</strong>selected lens, it is possible to achieve a multi-fieldacquisition through motorized tables. We only needto i<strong>de</strong>ntify <strong>the</strong> entire area to be analysed, and byinterconnection between image fields acquired withrecoveries, we reconstructed a joined-fie image.Profile afterstraighteningProfile beforestraighteningFig. 5 . Profiles on <strong>the</strong> surface of <strong>the</strong> sheet before and afterstraightening .• Secondly, an image processing is performed inor<strong>de</strong>r to extract <strong>the</strong> profiles that we wishvertically from <strong>the</strong> contour of <strong>the</strong> blanked shape(Fig. 6).Blanked ShapeSheet metalProfile beginningProfileFig. 4. The optical <strong>de</strong>vice measurement: InfiniteFocus ®3.3.b MeasurementThe measurement method is <strong>de</strong>veloped within <strong>the</strong>LMS specifically for quantifying <strong>the</strong> burr volume.The originality of this method lies in <strong>the</strong>transformation of <strong>the</strong> blanked shape, (here a circularshape). The main stages of this transformation are:Fig. 6. Example of obtained profile.• Thirdly, <strong>the</strong> profiles are extracted in multiples soas to build a rectangular matrix; each profilebeing <strong>the</strong> average of 100 adjacent profiles.Thereafter, <strong>the</strong> image is adjusted, outsi<strong>de</strong> <strong>the</strong>zone of <strong>the</strong> blun<strong>de</strong>r, with a linear polynomial of<strong>de</strong>gree 2, which assembles all <strong>the</strong> profile (Fig. 7).• First, a straightening of <strong>the</strong> image around <strong>the</strong>blanked shape (hole) is achieved (Fig. 5). This isdone in or<strong>de</strong>r to eliminate any imperfections in<strong>the</strong> image rectitu<strong>de</strong>. The straightening of <strong>the</strong>image (outsi<strong>de</strong> <strong>the</strong> zone of burr) is ma<strong>de</strong> with <strong>the</strong>method of least squares.Fig. 7. Representation of <strong>the</strong> profiles assembling.• Finally, <strong>the</strong> volume is <strong>de</strong>termined only in <strong>the</strong>areas of <strong>the</strong> burr presence on <strong>the</strong> image.
number of profiles, which has <strong>the</strong> advantage ofallowing a complete scan of <strong>the</strong> blanking edge.REFERENCESFig. 8. Calculations on <strong>the</strong> <strong>de</strong>fined area4 RESULTS AND CONCLUSIONSFigure 9 shows <strong>the</strong> evolution of <strong>the</strong> burr volumeaccording to <strong>the</strong> number of press stroke. We observean increase of a burr volume with <strong>the</strong> increasingnumber of press stroke.Burr volume(µm3)1,20E+061,00E+068,00E+056,00E+054,00E+052,00E+050,00E+000 50000 100000 150000 200000 250000 300000Number of press strokesFig. 9. Burr volume.O<strong>the</strong>r results (Fig. 10) can show several veryinteresting phenomena. In<strong>de</strong>ed, a quick initialanalysis of <strong>the</strong> curve allows noting that <strong>the</strong> kineticsof appearance of burr, as it was highlighted byGréban [5], <strong>de</strong>pends directly on <strong>the</strong> blankingmaterial.1. N. Hatanaka, K. Yamaguchi, N. Takakura, T. Iizuka «Simulation of sheared edge formation process inblanking of sheet metals » Journal of MaterialsProcessing Technology, 140 (2003) 628-634.2. C. Husson, C. Poizat, L. Daridon, S. Ahzi « Travail <strong>de</strong>smétaux en feuilles - Simulation numérique 2D dudécoupage d’alliages <strong>de</strong> cuivre » 7ème ColloqueNational en Calcul <strong>de</strong>s Structures, 2005.3. A. Touache « Contribution à la caractérisation et à lamodélisation <strong>de</strong> l’influence <strong>de</strong> la vitesse et <strong>de</strong> latempérature sur le comportement en découpage <strong>de</strong> tôlesminces. » Thèse à l’Université <strong>de</strong> FRANCHE-COMTÉ,14 Décembre 2006.4. Z. Tekiner, M. Nalbant, H. Gürün « An experimentalstudy for <strong>the</strong> effect of different clearances on burr,smooth-sheared and blanking force on aluminium sheetmetal » Materials & Design, 27 (2006) 1134-1138.5. F. Gréban, G. Monteil, X. Roizard « Influence of <strong>the</strong>structure of blanked materials upon <strong>the</strong> blanking qualityof copper alloys » Journal of Materials ProcessingTechnology, Vol 186 N°1-3, (2007), pp 27-32.6. M. Grünbaum, J. Breitling, Influence of high cuttingspeeds on <strong>the</strong> quality of blanked parts. ERC report N°5-96-19, 1996.7. F. Gréban « Découpabilité du cuivre et <strong>de</strong>s alliagescuivreux. » Thèse à l’Université <strong>de</strong> FRANCHE-COMTÉ, 21 février 2006.8. E. Levy « Mise en oeuvre <strong>de</strong>s systèmes <strong>de</strong> vision pour lecontrôle <strong>de</strong>s pièces découpées ».Document interneStatimage. 2000.Burr volume(µm3)1,60E+061,40E+061,20E+061,00E+068,00E+056,00E+054,00E+052,00E+05Mat 1Mat 2Mat 1 Mat 10,00E+000 100000 200000 300000 400000 500000 600000 700000 800000Number of press strokeMat 3Fig. 10. Burr volume for different materials.Because of <strong>the</strong> non-homogeneity of <strong>the</strong> burrs on <strong>the</strong>blanked contour, <strong>the</strong> method seems <strong>the</strong> mostappropriate, because it is obtained from a large
Laboratory and field analysis on <strong>the</strong> tribological behavior of coated anduncoated forming toolsM.A.R.S. Men<strong>de</strong>s 1 , R.M. Souza 1 , P.K. Vencovsky 2 , Y. Berthier 31 Surface Phenomena Laboratory, Department of Mechanical Engineering, Polytechnic School of <strong>the</strong>University of São Paulo – Av. Prof. Mello Moraes, 2231, 05508-900 São Paulo, SP, BrazilURL: www.poli.usp.bre-mail: roberto.souza@poli.usp.br; marcorsm@usp.br2 Bodycote Brasimet – Av. Nações Unidas, 21476, 04795-912 São Paulo, SP, BrazilURL: www.brasimet.com.bre-mail:Paulo.vencovsky@bodycote.com3 <strong>INSA</strong> <strong>de</strong> <strong>Lyon</strong>, LaMCoS – 20 avenue Einstein, 69621 Villeurbanne, FranceURL: lamcos.insa-lyon.fre-mail: yves.berthier@insa-lyon.frABSTRACT: Frequently, <strong>the</strong> life of <strong>the</strong> tools used in sheet metal forming operations is <strong>de</strong>termined by aphenomenon known as galling, which originates from <strong>the</strong> adhesion of <strong>the</strong> sheet to <strong>the</strong> forming tool surface.The application of coating architectures composed by single or multiple layers of Physical Vapor Deposition(PVD) films, such as TiN, TiCN, CrN, TiCNAl, may significantly reduce <strong>the</strong> chemical interaction in <strong>the</strong>contact, up to <strong>the</strong> point that no significant adhesion may be observed for an exten<strong>de</strong>d number of formingoperations. Usually, <strong>the</strong> evaluation of <strong>the</strong> behavior of different thin film architectures is conducted usingtribometers that may or may not reproduce <strong>the</strong> conditions found in industrial practice. This work presents atribological analysis of coated and uncoated surfaces of tools used in industrial sheet metal formingoperations and discusses <strong>the</strong> capability of laboratory tests in reproducing <strong>the</strong> situations found in practice.Key words: Galling, PVD coatings, Laboratory tests, Field tests1 INTRODUCTIONFrequently, <strong>the</strong> life of <strong>the</strong> tools used in sheet metalforming operations is <strong>de</strong>termined by a phenomenonknown as galling. Galling is <strong>de</strong>scribed in <strong>the</strong> ASTMG40 Standard [1] as “a form of surface damagearising between sliding solids, distinguished bymacroscopic, usually localized, roughening andcreation of protrusions above <strong>the</strong> original surface; itoften inclu<strong>de</strong>s plastic flow or material transfer orboth”. In spite of <strong>the</strong> significant number ofpublications on this phenomenon, some attention isstill <strong>de</strong>voted towards its effective occurrence [2]and, more importantly, towards <strong>the</strong> <strong>de</strong>velopment oftests able to reproduce galling in laboratory [2-10].One important reference regarding <strong>the</strong>se tests is <strong>the</strong>ASTM G98 method [3], according to which athreshold pressure for galling is calculated based on<strong>the</strong> visual inspection of <strong>the</strong> presence of galling at <strong>the</strong>surfaces of a button and/or a block that were pressedagainst and manually rotated with respect to eacho<strong>the</strong>r at increasing loads. Despite <strong>the</strong> popularity of<strong>the</strong> ASTM G98 test method, many works criticize<strong>the</strong> applicability of such threshold pressure value for<strong>de</strong>sign purposes and suggest modifications to <strong>the</strong>original standard method. These changes intend toovercome some of <strong>the</strong> method limitations, such as<strong>the</strong> heterogeneity of contact pressure distribution [4]or <strong>the</strong> fact that <strong>the</strong> velocity is zero at <strong>the</strong> centre of<strong>the</strong> rotating button [2,4]. O<strong>the</strong>r questionings on <strong>the</strong>ASTM G98 test method inclu<strong>de</strong> <strong>the</strong> nonconsi<strong>de</strong>ration of <strong>the</strong> statistical nature of galling[4,5]; <strong>the</strong> absence of constant speed during manualrotation [6] and even cost issues associated with <strong>the</strong>necessity of a large number of specimens or <strong>the</strong>availability of an equipment capable of applyinglarge normal loads [7].Some of <strong>the</strong> alternatives for laboratory testing ofgalling inclu<strong>de</strong> a modification in <strong>the</strong> geometry of <strong>the</strong>specimens, such as <strong>the</strong> shape of initial contact,which is consi<strong>de</strong>red as a line [8] or a point [7,9],ra<strong>the</strong>r than an area (ASTM standard). In <strong>the</strong>se tests,<strong>the</strong> analysis of <strong>the</strong> occurrence of galling may remainbased on <strong>the</strong> visual inspection of contact surfaces [8]or, as in <strong>the</strong> case of two crossed cylin<strong>de</strong>rs that sli<strong>de</strong>against each o<strong>the</strong>r, may be based on <strong>the</strong> frictioncoefficient calculated during <strong>the</strong> experiments [7,11].
In spite of <strong>the</strong> predominance, galling is not <strong>the</strong> onlyphenomenon observed in forming operations and,during <strong>the</strong> past <strong>de</strong>ca<strong>de</strong>s, more sophisticated testshave been <strong>de</strong>veloped [10,12-15] aiming a betterlaboratory reproduction of <strong>the</strong> conditions found inpractice. Most of <strong>the</strong>se tests are conducted inspecially <strong>de</strong>signed rigs and involve <strong>the</strong> actualcontact of metal strips against tool materials.Many of <strong>the</strong> laboratory studies mentioned above[2,9,13] have also explored <strong>the</strong> point that <strong>the</strong>evolution of galling at a given surface presents acorrespon<strong>de</strong>nce with variations in roughness [16].The intensity and continuity of <strong>the</strong> search for alaboratory test that accurately reproduces <strong>the</strong>tribological conditions in forming operations areun<strong>de</strong>rstandable, not only based on <strong>the</strong> possibility ofknowing <strong>the</strong>se operations in <strong>de</strong>tail, but also based on<strong>the</strong> ability that such test would have to provi<strong>de</strong> hintstowards materials <strong>de</strong>velopment. In particular, suchtest would provi<strong>de</strong> a means of keeping track of <strong>the</strong>applicability in forming operations of constantlyemerging <strong>de</strong>velopments of Physical VaporDeposition (PVD) coating architectures.In this work, eight sheet metal operations, conductedwith coated and uncoated tools, were analysed interms of wear phenomena observed at tool surface.Results were <strong>the</strong>n discussed in <strong>the</strong> light of <strong>the</strong>laboratory tests mentioned in <strong>the</strong> previousparagraphs.2 FIELD TESTS AND ANALYSISTable 1 presents a list of <strong>the</strong> industrial sheet metaloperations studied in this work. All operations werepart of <strong>the</strong> actual production line of a bearingindustry. Operations 1 to 6 were conducted as stepsof <strong>the</strong> manufacturing process of cups with diameterof 30 mm and <strong>de</strong>pth of 25 mm. Similarly, operations7 and 8 were part of <strong>the</strong> manufacturing procedure ofcups with diameter of 16 mm and <strong>de</strong>pth of 12 mm.As indicated in <strong>the</strong> table, two types of tool steel wereselected for <strong>the</strong> tools (or substrates), AISI H13 andAISI M2, which presented Rockwell C hardness of52 (approx. 6.0 GPa) and 61 (approx. 7.5 GPa),respectively. The TiCN and TiCNAl coatings were<strong>de</strong>posited in a commercial cathodic arc evaporation<strong>de</strong>position chamber and, according to <strong>the</strong>manufacturer, presented hardness on <strong>the</strong> or<strong>de</strong>r of 29GPa and 35 GPa, respectively. All operations listedin table 1 were lubricated with oil and conducted on0.8 mm thick 16MnCr6 steel sheets. In table 1, <strong>the</strong>column labelled as “Production” indicates <strong>the</strong>number of parts manufactured by each tool, whoselife limiting factor was based on <strong>the</strong> quality of <strong>the</strong>formed part. The end life of all uncoated operations(1-4) was <strong>de</strong>termined by galling and <strong>the</strong> end life ofall coated tools was not <strong>de</strong>termined by galling, butby o<strong>the</strong>r wear phenomena that resulted from <strong>the</strong>contact between <strong>the</strong> punch and <strong>the</strong> die (e.g. wear on<strong>the</strong> si<strong>de</strong>s of <strong>the</strong> punches due to slight centremisalignment).Table1. Overall conditions in sheet metal forming operations.Operations were lubricated with oil and conducted on 8.0 mmthick 16MnCr6 steel sheetsOperationnumberSubstrate Coating Type ofOperation1 AISI H13 None Ironing 322 AISI M2 None Blanking 1753 AISI M2 None Bending 1754 AISI M2 None Coining 945 AISI H13 TiCN Ironing 10006 AISI M2 TiCN Coining 10007 AISI M2 TiCNAl Ironing 1<strong>2008</strong> AISI M2 TiCNAl Coining 1200Production(x10 3 parts)After removal from <strong>the</strong> press, tool surfaces werecleaned and observed with optical and scanningelectron microscopy (SEM). Surfaces were alsoanalysed in terms of roughness.Figure 1 presents a <strong>de</strong>tail of <strong>the</strong> surface of <strong>the</strong> toolused in operation 2. Two distinct regions may beobserved in figure 1, one that presents <strong>the</strong> originalsurface, and an external ring where <strong>the</strong> originalgrinding lines are no longer visible. Additionalanalyses of <strong>the</strong> external ring revealed featurestypical of galling, such as surface protrusions(figure 2) and <strong>the</strong> presence of additional peaks andvalleys in <strong>the</strong> roughness profile (figure 3).Fig. 1. Optical microscopy of <strong>the</strong> tool used in <strong>the</strong> blanking of8.0 mm thick 16MnCr6 steel sheets (operation 2 in table 1)
as an absence of particles adhered to <strong>the</strong> tool surfaceand <strong>the</strong> absence of additional peaks and valleys in<strong>the</strong> roughness profile.a50 µmFig. 2. SEM analysis of <strong>the</strong> tool used in <strong>the</strong> blanking of 8.0 mmthick 16MnCr6 steel sheets (operation 2 in table 1). Arrowscoinci<strong>de</strong> with <strong>the</strong> radial direction of <strong>the</strong> cylindrical tool: (a)Secondary electron image and (b) backscattered electron imagebUnwornWorn ringµmammFig. 3. Roughness analysis of <strong>the</strong> tool used in <strong>the</strong> blanking of8.0 mm thick 16MnCr6 steel sheets (operation 2 in table 1): (a)Unworn surface and (b) worn external ring.Operations 4 and 6 are representative of <strong>the</strong>differences observed with coated and uncoated tools,since <strong>the</strong> same tool geometry and overall operationconditions were present in both cases. In <strong>the</strong> toolused in operation 4, it was once again possible toobserve that worn surfaces present additional peaksand valleys in <strong>the</strong> roughness profile, which were notclearly noticeable at <strong>the</strong> surface of tool used inoperation 6.Differences between coated and uncoated surfaceswere also observed in <strong>the</strong> SEM analysis. Although ina scale different from that shown in figure 2, gallingfeatures were also observed at <strong>the</strong> surface of <strong>the</strong>uncoated tool used in operation 4. These featureswere not distinguishable at <strong>the</strong> TiCN coated surface(figure 4), which presented several scratches in <strong>the</strong>radial direction, but where it was not possible toi<strong>de</strong>ntify <strong>the</strong> presence of material transferred from <strong>the</strong>sheet to <strong>the</strong> coated tool surface, in spite of <strong>the</strong> largernumber of parts produced with this tool.3 DISCUSSIONµmAs a general trend, coated tools, in<strong>de</strong>pen<strong>de</strong>nt of <strong>the</strong>coating material, outperformed uncoated tools in allindustrial operations analysed in this work. Thebetter performance of <strong>the</strong> coated tools may beattributed to <strong>the</strong>ir ability to minimize, or postpone,<strong>the</strong> occurrence of galling; an ability that was verifiedbmmFig. 4. SEM analysis of <strong>the</strong> TiCN coated tool used in <strong>the</strong>coining of 8.0 mm thick 16MnCr6 steel sheets (operation 6in table 1).It is not appropriate to make a direct comparison of<strong>the</strong> results obtained in this work with those of <strong>the</strong>tests presented in <strong>the</strong> literature, since most of <strong>the</strong>elements of <strong>the</strong> tribossystem were different,including materials, geometries, loads andlubrication condition. However, some consi<strong>de</strong>rationsare still possible and, to this end, <strong>the</strong> laboratory testswere intentionally grouped into three categories,which are <strong>the</strong> tests based on <strong>the</strong> ASTM G98standard; tests with initial line or point contact andtests that involve actual sliding of strips against <strong>the</strong>surface of tools.It is possible to suppose that <strong>the</strong> use of <strong>the</strong> toolmaterials of this work in tests based on <strong>the</strong> ASTMG98 standard would provi<strong>de</strong> lower threshold gallingpressures for <strong>the</strong> uncoated tools than <strong>the</strong> coatedones. However, in addition to <strong>the</strong> questionings on<strong>the</strong> concepts of ASTM G98 standard [2,4-8],literature [4,9] data also indicates that <strong>the</strong>preparation of <strong>the</strong>se tests must be careful in or<strong>de</strong>r toprovi<strong>de</strong> good alignment between <strong>the</strong> contactingsurfaces, even if some of <strong>the</strong> alternatives to <strong>the</strong>original standard are selected.The simplicity and quickness of tests with line orpoint contact may be advantageous. However, taking<strong>the</strong> example of <strong>the</strong> crossed cylin<strong>de</strong>r test, it ispossible to state that <strong>the</strong> use of <strong>the</strong> outputs of thistest to study forming operations is based on <strong>the</strong>assumptions that: (i) galling is associated with anincrease in friction coefficient and (ii) galling is <strong>the</strong>predominant mechanism in forming operations. Thefirst of <strong>the</strong>se assumptions may seem intuitivelycorrect and a direct correlation between friction andgalling has been observed in some cases [14]. On <strong>the</strong>
o<strong>the</strong>r hand, it has not been observed in o<strong>the</strong>rs [2].The second assumption is also plausible, but <strong>the</strong>literature also presents examples where wear waspredominantly dictated by ploughing, ra<strong>the</strong>r than bygalling [14]. In terms of <strong>the</strong> comparisons provi<strong>de</strong>dby <strong>the</strong> crossed cylin<strong>de</strong>r test, Podgornik [7] observedthat uncoated tools performed better than toolscoated with titanium nitri<strong>de</strong> (TiN). Based on <strong>the</strong>results of <strong>the</strong> industrial operations analysed in thiswork, it is difficult to imagine that this result wouldoccur in industry. Therefore, in addition to <strong>the</strong>validity of <strong>the</strong> assumptions presented above, it ispossible to suppose that some of <strong>the</strong> conditionsimposed during <strong>the</strong> line or point contact tests areunable to entirely reproduce <strong>the</strong> conditions found inpractice. One of <strong>the</strong> possible explanations for <strong>the</strong>sedifferences is <strong>the</strong> nominal contact pressure, which,in <strong>the</strong>se tests, tends to be larger than in <strong>the</strong> industrialconditions [9]. A reduction in pressure would bepossible in <strong>the</strong> crossed cylin<strong>de</strong>r test, but, in this case,<strong>the</strong> sliding distance would probably have to besignificantly increased until <strong>de</strong>tectable wear wouldbe noticed. As a result, repetition of <strong>the</strong> regions incontact would possibly occur during each test cycle;a condition that is frequently not observed informing operations [12].Finally, it is possible to expect that tests that involveactual sliding of strips against <strong>the</strong> surface of toolswould provi<strong>de</strong> results in good agreement with thoseobserved in industrial operations. However, <strong>the</strong>setests frequently <strong>de</strong>mand specially <strong>de</strong>signe<strong>de</strong>quipment and may require large and complexshaped specimens.4 CONCLUSIONSThe literature presents a large number of laboratorytests <strong>de</strong>dicated to <strong>the</strong> study of <strong>the</strong> wear phenomenonknown as galling and/or <strong>the</strong> tribology in formingoperations as a whole. A qualitative comparison ofsome of <strong>the</strong>se tests with results obtained directly inindustrial operations indicate that, in spite of <strong>the</strong>large number, most of <strong>the</strong> options are still notentirely satisfactory. Apparently, none of <strong>the</strong>m isable to provi<strong>de</strong> a simple means to analyse factorssuch as contact pressure, lubrication, continuous orintermittent contact, refreshment of contact area, inor<strong>de</strong>r to not only analyse galling, but also, ifnecessary, conduct <strong>the</strong> test with different levels ofpredominance of galling over o<strong>the</strong>r phenomena.ACKNOWLEDGEMENTSThe authors acknowledge two Brazilian founding agencies forfinancial support: <strong>the</strong> São Paulo State Research Foundation -FAPESP through projects number 2006/02006-2 and2003/10157-2 and The National Council for Scientific andTechnological Development (CNPq) through project550235/03-5.REFERENCES1. ASTM G40, Standard Terminology Relating to Wearand Erosion, ASTM International, West Conshohocken(2005).2. K.G. Budinski, M.K. Budinski and M.S. Kohler, Agalling-resistant substitute for silicon nickel, Wear 255(2003) 489-97.3. ASTM G98, Standard Test Method for GallingResistance of Materials, ASTM International, WestConshohocken (2002).4. S.R. Hummel, Development of a galling resistance testmethod with a uniform stress distribution, Tribol. Int. 41(<strong>2008</strong>) 175-80.5. S.R. Hummel and B. Partlow, Comparison of thresholdgalling results from two testing methods, Tribol. Int. 37(2004) 291-5.6. K. Gurumoorthy, M. Kamaraj, K. Prasad Rao and S.Venugopal, Development and use of combined weartesting equipment for evaluating galling and high stresssliding wear behaviour, Mater. Des. 28 (2007) 987-92.7. B. Podgornik, S. Hogmark and J. Pezdirnik, Comparisonbetween different test methods for evaluation of gallingproperties of surface engineered tool surfaces, Wear 257(2004) 843-51.8. S.R. Hummel, New test method and apparatus formeasuring galling resistance, Tribol. Int. 34 (2001)593-7.9. P.A. Swanson, L.K. Ives, E.P. Whitenton and M.B.Peterson, A study of <strong>the</strong> galling of two steels using twotest methods, Wear 122 (1988) 207-23.10. L.M. Bernick, R.R. Hilsen and C.L. Wandrei,Development of quantitative sheet galling test, Wear 48(1978) 323-46.11. M. Hanson, N. Stavlid, E. Coronel and S. Hogmark, Onadhesion and metal transfer in sliding contact betweenTiN and austenitic stainless steel, Wear in press.12. E. Schedin, Galling mechanisms in sheet formingoperations, Wear 179 (1994) 123-8.13. F. Clarysse, W. Lauwerens and M. Vermeulen,Tribological properties of PVD tool coatings in formingoperations of steel sheet, Wear 264 (<strong>2008</strong>) 400-4.14. C. Boher, D. Attaf, L. Penazzi and C. Levaillant, Wearbehaviour on <strong>the</strong> radius portion of a die in <strong>de</strong>ep-drawing:I<strong>de</strong>ntification, localisation and evolution of <strong>the</strong> surfacedamage, Wear 259 (2005) 1097-108.15. M. Hirasaka and H. Nishimura, Effects of <strong>the</strong> surfacemicro-geometry of steel sheets on galling behavior, J.Mater. Process. Technol. 47 (1994) 153-66.16. J.L. Andreasen, N. Bay and L. <strong>de</strong> Chiffre, Quantificationof galling in sheet metal forming by surface topographycharacterization, Int. J. Mach. Tool Manu., 38 (1998)503-10.
DFT – Mo<strong>de</strong>ling of <strong>the</strong> Reaction of a Polysulfur Extreme-PressureLubricant Additive on Iron SurfaceB. Monasse, P. MontmitonnetEcole <strong>de</strong>s Mines <strong>de</strong> Paris PARISTECH, CEMEF, UMR 7635, BP 207, 06904 Sophia-Antipolis Ce<strong>de</strong>x, FranceURL: www-cemef.cma.fr e-mail: bernard.monasse@ensmp.fr e-mail: pierre.montmitonnet@ensmp.frABSTRACT: sulfur-containing molecules are used as extreme pressure additive for low-alloy steel surfaces.These molecules react with ferrous surfaces and form FeS x compounds which strength <strong>the</strong> surface and reducescuffing. The stable conformation and <strong>the</strong> chemical stability and reactivity of an alkyl sulfur molecule(DTDP) with oxygen and an iron surface are here predicted by DFT mo<strong>de</strong>l. The effect of <strong>the</strong> conformation of<strong>the</strong> molecule respective to <strong>the</strong> surface acts on <strong>the</strong> surface reactivity.Key words: polysulfur, iron, reactivity, semi-empirical functional,1 INTRODUCTIONSulfur-containing organic molecules have been usedfor a long time as extreme pressure additives inlubricating oils. Several papers report oncomparisons of <strong>the</strong> tribological efficiency of organosulfuradditives as a function of number of sulfuratoms, alkyl- or aryl-chains [1]. In tribotests,involving ferrous materials and S-containingadditives, <strong>the</strong> formation of <strong>the</strong> FeS x compound hasbeen <strong>de</strong>tected in superficial layers by differentsurface analysis techniques [2, 3]. FeS, also knownas troilite, has a layered hexagonal structure, lowshear strength and high melting point (1100 °C), soit is an effective solid lubricant like graphite andMoS 2 [4]. HSAB <strong>the</strong>ory may also shed light on thosespecies which react to form <strong>the</strong>se layers [5]. Themolecule may be <strong>the</strong>rmally <strong>de</strong>composed or oxidizedin <strong>the</strong> lubricant during rolling process or reacts on<strong>the</strong> metallic surface. The <strong>de</strong>tails of <strong>the</strong> reaction pathare never<strong>the</strong>less poorly known, and so is <strong>the</strong> effectof <strong>the</strong> environment (dissolved oxygen, temperature,…) on preferred reaction paths and reactivity andwill be analyzed in <strong>the</strong> present work.Quantum mo<strong>de</strong>ls have been applied to study <strong>the</strong>reactivity of some sulfur molecules on variousmetallic surfaces [6]. Most of <strong>the</strong> papers are focusedon copper, palladium and nickel for catalyticpurpose with simple sulfur molecules. Reactions acton <strong>the</strong> first layers of metal mainly for gas phasereactions [6,7]. The sulfur may be randomlydistributed on copper surface or organized asmobile sulfur metal clusters Cu 3 S 3 [8]. Theorganisation of metal sulfur molecules may <strong>de</strong>pendon <strong>the</strong> reaction path of <strong>the</strong> sulfur during its reactionwith metal surface. We consi<strong>de</strong>r here <strong>the</strong> reaction ofa di-tertio-do<strong>de</strong>cyl-pentasulfur molecule (C 12 H 25 S 5C 12 H 25 , DTDP) with a bcc iron [001] surface.2 SIMULATIONThe simulations have been done with a semiempiricalmo<strong>de</strong>l MOPAC using <strong>the</strong> functional PM5.The results were confirmed by simulations witho<strong>the</strong>r semi-empirical functionals AM1 and PM3 anda DFT functional B88-LYP. The MOPAC softwareis coupled to <strong>the</strong> graphical user interface CAChe.Full geometry optimization of a standalone moleculeis searched first to <strong>de</strong>fine <strong>the</strong> equilibriumconformation of <strong>the</strong> molecule. This conformation issearched from various initial non-equilibrated state.A molecular dynamics simulation allows us tofollow <strong>the</strong> conformational change around <strong>the</strong>equilibrium conformation. The stable conformation
corresponds to <strong>the</strong> minimum energy state. Thereactivity of this molecule at <strong>the</strong> contact is <strong>the</strong>npredicted with various approaches of this moleculenear <strong>the</strong> metal surface.3 RESULTS3.1 Molecular conformation of DTDP moleculeThe DTDP molecule is symmetrical from <strong>the</strong> centralsulfur atom, which may act of its equilibriumconformation. A fully exten<strong>de</strong>d molecule is createdwith CAChe software and relaxed with varioussemi-empirical and DFT functionals at 0K (fig. 1).C1C2C3C4C5C6C7C8C9C10C11C12C29C28C27C26C25C24C23C22C21C20C19C18S13 S14 S16 S17S15a b cFig. 1. Equilibrium conformation of DTDP molecule along <strong>the</strong>three main orientation directionsThe molecule forms a loop with parallel alkyl chainsin exten<strong>de</strong>d conformation. The loop results fromgauche conformations of S-S bonds. The parallelchains results from maximal van <strong>de</strong>r Waals an<strong>de</strong>lectrostatic interactions of aliphatic segments. Theconformation change of <strong>the</strong> molecule results onlyfrom <strong>the</strong> S-S bond rotation. The aliphatic chains arealmost normal to <strong>the</strong> mean plane containing sulfuratoms. Complementary simulations with a variablenumber of sulfur atoms show that this loopconformation appears from three sulfur atoms up.Molecular dynamics simulations at 300K of a DTDPmolecule show out a fluctuation of orientation anddistance of almost all-trans aliphatic sequencearound <strong>the</strong> equilibrium conformation. They comefrom fluctuations of dihedral angle S-S-S around <strong>the</strong>equilibrium conformation. The loop corresponds to<strong>the</strong> equilibrium conformation of <strong>the</strong> molecule. Theconformational energy <strong>de</strong>creases by 57.3 kJ.mol -1from <strong>the</strong> fully exten<strong>de</strong>d molecule to <strong>the</strong> stableconformation.3.2 Stability of bonds and oxidationThe homolytic scission of S-S bonds and <strong>the</strong>iroxidation are two main hypo<strong>the</strong>ses proposed toexplain <strong>the</strong> reactivity of sulfur based molecules. Wehave calculated <strong>the</strong> intrinsic stability of <strong>the</strong> variousbonds (S-S, C-S, C-C) insi<strong>de</strong> <strong>the</strong> molecule and <strong>the</strong>irreactivity with O 2 molecules.The energy of each bond is estimated by <strong>the</strong>following energy balance <strong>de</strong>duced from calculationof <strong>the</strong> energy of <strong>the</strong> molecule and of <strong>the</strong> molecularfragments resulting from <strong>the</strong> bond leakage:E bond = E fragment1 + E fragment2 - E molecule (1)The atoms are numbered from one methyl carbonand sulfurs range from S13 to S17, and each bond is<strong>de</strong>fined by <strong>the</strong> linked atoms (fig. 1). The bon<strong>de</strong>nergy <strong>de</strong>pends on <strong>the</strong> nature and localization ofbonds insi<strong>de</strong> <strong>the</strong> molecule, half molecule isrepresented thanks to molecular symmetry and mostof C-C bonds are not consi<strong>de</strong>red for <strong>the</strong>ir high bon<strong>de</strong>nergy (table 1).Table 1: bond energy insi<strong>de</strong> DTDP moleculebond Energy kJ.mol -1C4-C5 268C11-C12 246C12-S13 206S13-S14 215S14-S15 164The sulfur and C-S bonds are significantly weakerthan carbon bonds and <strong>the</strong> two bonds linked to <strong>the</strong>central sulfur are <strong>the</strong> weakest leading to <strong>the</strong> mostprobable position for an homolytic rupture.The following mechanism is consi<strong>de</strong>red for a<strong>the</strong>rmo-oxidative <strong>de</strong>gradation (fig. 3) :C 12 H 25 S 5 C 12 H 25 + O 2 → R-S-O . + R’-S-O (2)and leads to <strong>the</strong> following reaction energy (table 2)Table 2: energy of oxidation reaction on varioussulfur bondsreaction Energy (kJ.mol -1 )C12-O S13-O - 83S13-O S14-O - 171S14-O S15-O -337
The high oxidation energy on bond S14-S15 maysuspect a <strong>the</strong>rmal oxidation of <strong>the</strong> molecule.The relaxation of this molecule on <strong>the</strong> iron surfacepredicts <strong>the</strong> reaction of two non consecutive sulfuratoms with iron atoms (fig. 4).Fig. 2. excited state for oxidative reaction on S14 and S15atomsThe bond S14-S15 is <strong>the</strong> weakest bond for oxidationand for homolytic scission. This part of <strong>the</strong> moleculeis a clear candidate to react with a metallic surface.3.3 Reaction of DTDP molecule with iron surfaceA direct reaction on an iron surface is also analyzed.A layer of Fe atoms is created and locked torepresent a surface of bcc α-iron, with <strong>the</strong> samecrystallographic parameters. The iron functional isavailable insi<strong>de</strong> PM5 basis-set and is able to predictreaction with DTDP sulfur based molecule. A DTDPmolecule is <strong>the</strong>n located near <strong>the</strong> surface withvarious orientations of sulfur atoms. Figure 3presents one initial scheme.Fig. 4. Conformation of a DTDP molecule after reaction with<strong>the</strong> iron surface (tilt/iron plane ~ 60°)This type of reaction leads to isolated sulfur-ironbonds distributed on <strong>the</strong> surface which are weakenedinsi<strong>de</strong> <strong>the</strong> DTDP molecule (fig. 6).O<strong>the</strong>r simulations with <strong>the</strong> same molecule but with adifferent tilt-angle with <strong>the</strong> surface lead a differentreaction path (fig. 5).Fig. 5. Conformation of a DTDP molecule after reaction with<strong>the</strong> iron surface (si<strong>de</strong> and bottom view) (tilt/plane ~ 80°)Fig. 3. An initial conformation of a DTDP molecule near <strong>the</strong>iron surfaceAll <strong>the</strong> sulfur atoms react with an iron atom, ormore, which leads to a cluster of Fe-S bonds on ironsurface. These bonds are strong and weaken <strong>the</strong>intramolecular bonds, measured by <strong>the</strong> reducing<strong>the</strong>ir covalent or<strong>de</strong>r (fig. 7).
10.90.80.70.60.50.40.30.20.100 5 10 15 20 25 30Fig. 6. Covalent or<strong>de</strong>r of intramolecular bonds insi<strong>de</strong> DTDPmolecule (from fig. 4)10.90.80.70.60.50.40.30.2bond or<strong>de</strong>rordre liaisonbond or<strong>de</strong>rC12-S13S13-S14S14-S15S13-S14S14-S15S16-S17S16-S17S17-C18S17-C18S15-S16bond0.1bond liaison00 5 10 15 20 25 30Fig. 7. Covalent or<strong>de</strong>r of intramolecular bonds insi<strong>de</strong> DTDPmolecule (from fig. 5)The two (fig. 6) and four S-S bonds or<strong>de</strong>rs (fig. 7),respectively, are almost reduced to none afterreaction on iron surface in favor to Fe-S bonds. Theiron surface is highly reactive to sulfur atoms. Theresulting sulfur groups can be directly organized incluster and randomly distributed as a function on <strong>the</strong>approach path of <strong>the</strong> DTDP molecule onto <strong>the</strong> ironsurface.4 CONCLUSIONSThe conformation and <strong>the</strong> stability of <strong>the</strong> bonds of asulfur based molecule are mainly <strong>de</strong>pen<strong>de</strong>nt onsulfur bonds. These ones are much more reactiveand oxidized than carbonyl bonds. Sulfur atomspreferentially react with iron surface and lead torandomly distribution of isolated Fe-S bonds and onsmall clusters of Fe-S as an effect of contact path of<strong>the</strong> molecule on <strong>the</strong> surface. These results, in onehand, should be completed with similar analyses ono<strong>the</strong>r crystallographic planes of iron and of ironoxi<strong>de</strong> surfaces and, in o<strong>the</strong>r hand, by prediction of<strong>the</strong> reaction rate of oxidation or bond rupture bycalculation of <strong>the</strong> excited state energy.REFERENCES1. K.D. Allum and J.F. Ford, The influence of chemicalstructure on <strong>the</strong> load carrying properties of certainorgano-sulfur compounds, J. Instit. Petrol., 497 (1965)145-169.2. I. M. Petrushina, E. Christensen, R. S. Bergqvist, P. B.Møller, N. J. Bjerrum, J. Høj, G. Kann and I.Chorkendorff, On <strong>the</strong> chemical nature of boundarylubrication of stainless steel by chlorine- and sulfurcontainingEP-additives, Wear, 246 (2000) 98-105.3. G. Dauchot, R. Combarieu, P. Montmitonnet, M.Repoux, G. Dessalces and F. Delamare, Tribochemicalreactions in cold-rolling : a ToF-SIMS study of <strong>the</strong>chemisorption of <strong>the</strong> lubricant additives on <strong>the</strong> sheet,Rev. Met. Paris, CIT-Science et Génie <strong>de</strong>s Matériaux, 2(2001) 159-168.4. D.M. Zhuang, Y.R. Liu, J.J. Liu, X.D. Fang, M.X.Guang and Y. Cui, Microstructure and tribologicalproperties of sulphi<strong>de</strong> coating produced by ionsulfuration, Wear, 225 (1999) 799-805.5. R.G. Pearson, Chemical hardness, Wiley-VCH, New-York (1997).6. H. Toulhoat, P. Raybaud, S. Kaztelan, G. Kresse, J.Hafner, Transition metals to sulfur binding energiesrelationship to catalytic activities in HDS: back toSabatier with first principle calculations, Catal. Today,50 (1999) 629-636.7. D.R. Alfonso, First-principles studies of <strong>the</strong> √7 x √719.1° structure of sulfur on <strong>the</strong> Pd(111) surface, SurfaceScience, 601 (2007) 4899-4909.8. G.B.D. Rousseau, A. Mulligan, N. Bovet, M. Adam, V.Dhanak and M. Kadodwala, A structural study ofdisor<strong>de</strong>red sulfur overlayers on Cu(111), SurfaceScience, 600 (2006) 873-903.
Research on Friction during Hot Deformation of Al-Alloys at HighStrain RateP. Petrov 1 , M. Petrov 1 , E. Vasileva 1 , A. Dubinchin 11 Moscow State Technical University “MAMI” – B.Semenovskaya str. 38, 107023 Moscow RussiaURL: www.mami.rue-mail: petrov_p@mail.ru; petrovpa@online.ruABSTRACT: The paper is linked to <strong>the</strong> investigation of lubricants for massive hot forging. It was observedtemperature range of 200-470°C and screw press was used for tests. The research on friction has been donefor Al-Mg and Al-Cu-Mg-Fe-Ni aluminium alloys. In this connection, physical and numerical investigation offriction are performed. On <strong>the</strong> basis of <strong>the</strong> ring upsetting technique, <strong>the</strong> effect of temperature on <strong>the</strong> frictionfactor value has been investigated. The regressions for <strong>the</strong> relationship between friction factor andtemperature for all lubricants un<strong>de</strong>r study have been obtained. Moreover, <strong>the</strong> sets of calibration curves weredrawn. Each set of calibration curves corresponds to <strong>the</strong> <strong>de</strong>finite type of aluminium alloy as well as <strong>de</strong>finiteconditions of <strong>de</strong>formation. Some practical recommendations were given.Key words: interfacial friction, friction factor, aluminium alloy, non-ferrous alloy, iso<strong>the</strong>rmal hot forging,lubricant, massive hot forming1 INTRODUCTIONMassive hot forging of any aluminium alloy can beperformed with <strong>the</strong> help of several types of metalformingmachines, namely hydraulic press,mechanical press, screw press etc. Applying one of<strong>the</strong>se machines allows production of ei<strong>the</strong>r typicalforgings or near net shape forgings. On <strong>the</strong> o<strong>the</strong>rhand, <strong>the</strong> quality of a forging ma<strong>de</strong> of an Al-alloy<strong>de</strong>pends on <strong>the</strong> composition of a lubricantsignificantly. The choice of <strong>the</strong> lubricant for hotforging is major task, especially in case ofaluminium alloys <strong>de</strong>formation. Moreover, inaccurate<strong>de</strong>scription of friction for numerical simulation of aforging technology may be one of <strong>the</strong> reasons why<strong>the</strong> results of simulation and experiments are not in agood agreement.The tribological properties of <strong>the</strong> lubricant can be<strong>de</strong>termined with <strong>the</strong> help of <strong>the</strong> ring-compressiontest which is <strong>the</strong> most simple and wi<strong>de</strong>ly usedmethod for <strong>the</strong> quantitative estimation of <strong>the</strong> contactfriction during bulk metal forging. It was <strong>de</strong>velopedby Kunogi [1], Male & Cocroft [2] and fur<strong>the</strong>rmodified by Burgdorf [3] etc.This method allows to <strong>de</strong>fine a friction factor’svalue for <strong>the</strong> <strong>de</strong>finite temperature only. But <strong>the</strong>numerical analysis of forging technology requiresknowing <strong>the</strong> effect of temperature or/and strain rateon <strong>the</strong> value friction factor.In connection with it as well as hot forging of Alalloys<strong>the</strong>re is a lack of systematized dataconcerning <strong>the</strong> research on this effect for wi<strong>de</strong> rangeof temperatures of forging and strain rates. Forinstance, in [4] it is only presented <strong>the</strong> results ofeffect of temperature on friction factor during<strong>de</strong>formation of Al-5Si and Al-4Mg alloys. Thesedata were obtained for temperature range of 20-500°C but it is unknown what <strong>the</strong> value of strain ratein those tests was. Then in [5] <strong>the</strong> properties of twodifferent lubricants were investigated during<strong>de</strong>formation of Al-Mn, Al-Mg, Al-Cu-Mg and Al-Cu-Mg-Fe-Ni alloys within temperature range of200-470°C. In this case <strong>the</strong> hydraulic press was usedfor <strong>de</strong>formation. It provi<strong>de</strong>d <strong>the</strong> initial strain rate of0.14 s –1 . But <strong>the</strong> question is whe<strong>the</strong>r <strong>the</strong> effect oftemperature will be significant if <strong>the</strong> screw press ischosen for <strong>de</strong>formation? It implies that <strong>the</strong>temperature range and <strong>the</strong> materials un<strong>de</strong>r studyshould be <strong>the</strong> same as in [5].So, <strong>the</strong> aim of <strong>the</strong> present paper is linked to <strong>the</strong>investigation of effect of temperature on frictionduring <strong>the</strong> <strong>de</strong>formation of Al-alloys on <strong>the</strong> screwpress and far<strong>the</strong>r generalization of <strong>the</strong> obtained datawhich can be applied in industry in or<strong>de</strong>r to optimize<strong>the</strong> new or/and being technological processes ofmetal forming. In <strong>the</strong> present paper, <strong>the</strong> ring test anda numerical simulation were applied to estimate <strong>the</strong>tribological properties of lubricants.
2 EXPERIMENTAL PROCEDURETwo lubricants were chosen for <strong>the</strong> investigation asin [5]. These are <strong>the</strong> lubricant based on industrial oil(IO+G) and based on syn<strong>the</strong>tic oil (SO+G). Bothlubricants contain colloidal graphite particles aslubricant’s components and <strong>the</strong> size of particles isless than 15 µm. The chemical composition of alloysun<strong>de</strong>r study is given in Table 1 [5]. The bold type inTable 1 indicates <strong>the</strong> amount of <strong>the</strong> basic impurities,which <strong>the</strong> investigated alloys contain.The sizes of <strong>the</strong> ring samples were as follows: innerdiameter = 20 mm; outer diameter = 40 mm; height= 14 mm. The ring samples were heated totemperatures of 200, 350, 430, 450, and 470°C in anelectric furnace. Deformation of <strong>the</strong> heated sampleswas carried out on flat dies that were warmed up totemperature of 120°C. Samples were compressedwith lubrication. Die velocity was constant at V≈400mm/s (screw press with nominal load = 10 MN andmaximum load = 16 MN), which correspon<strong>de</strong>d to aninitial strain rate of 28.6 s –1 . This value of strain ratebelongs to <strong>the</strong> strain rate interval (10 0 -10 2 s -1 ) withinthat <strong>the</strong> massive hot forging is usually carried out.Table 1. Chemical composition of alloys [5]Element Percentage, %A95456 A92618Al base baseCu 0.04 2.12Si 0.16 0.20Mn 0.63 0.03Mg 6.80 1.56Ti 0.1 0.05Zn 0.2 0.06Fe 0.22 1.0Ni - 0.80Cr - -The values of height h exp and inner diameter d expwere <strong>de</strong>termined after compression of <strong>the</strong> ringsamples. The inner diameter was measured in threelocations along <strong>the</strong> height of <strong>the</strong> rings. Finally, <strong>the</strong>value of <strong>the</strong> inner diameter was <strong>de</strong>termined asd exp =(d top +d mid +d bot )/3, where d top , d mid and d bot arerespectively inner diameter at <strong>the</strong> top, middle andbottom along <strong>the</strong> height of <strong>the</strong> ring, accordingly.3 NUMERICAL SIMULATION OF RINGUPSETTINGA numerical simulation of <strong>the</strong> ring test was carriedout by means of <strong>the</strong> FE system QFORM-2D(QuantorForm Ltd., Russia). The aims of <strong>the</strong>simulation were to <strong>de</strong>termine <strong>the</strong> values of <strong>the</strong>friction factor based on <strong>the</strong> obtained experimentaldata for <strong>the</strong> lubricants un<strong>de</strong>r study, and fur<strong>the</strong>r toconstruct calibration curves. Levanov’s frictionmo<strong>de</strong>l [6, 7] was implemented by <strong>the</strong> QFORMsimulation software.Levanov’s friction mo<strong>de</strong>l can be consi<strong>de</strong>red as acombination of Coulomb’s friction law and constantfriction law. It gives almost <strong>the</strong> same results asCoulomb’s friction law for low value of contactpressure σ n . In case of high contact pressure,Levanov’s friction mo<strong>de</strong>l and constant friction lawallow us to obtain approximately <strong>the</strong> same values offriction shear stress.Fig. 1. Scheme of calculationFigure 1 illustrates <strong>the</strong> scheme of numericalcalculation performed. <strong>Here</strong> d exp and d fem are <strong>the</strong>inner diameter of <strong>the</strong> ring sample obtaine<strong>de</strong>xperimentally and by FEM, respectively.The variable parameter in <strong>the</strong> simulation was <strong>the</strong>friction factor. The simulation was carried out for<strong>the</strong> same values of temperature as <strong>the</strong> experimentshad been done.Stress–strain curves of alloys un<strong>de</strong>r study were takenfrom <strong>the</strong> handbook [8]. These curves were obtainedun<strong>de</strong>r <strong>the</strong> conditions given in Table 2.Table 2. I<strong>de</strong>ntification of flow stress-strain curvesAlloy type T, °C ε ε& , s -1A92618 200-470 0-3 0-3A95456 150-450 0-0.8 0.01-100To perform <strong>the</strong> simulation, we assumed that <strong>the</strong>contact friction was constant at <strong>the</strong> <strong>de</strong>finedtemperature of <strong>de</strong>formation within <strong>the</strong> investigatedrange.4 RESULTS4.1 Effect of temperature, strain rate andlubricant’s compositionAccording to scheme (see Fig.1), one parameter
should be compared. That is <strong>the</strong> inner diameter of<strong>the</strong> <strong>de</strong>formed ring specimen.Comparing <strong>the</strong> volumes of a ring before and after<strong>the</strong> FE simulation showed that <strong>the</strong> loss in volumewas approximately equal to 0.5%. As a result, it isuseless to control <strong>the</strong> outer diameter before and aftereach simulation trial. That is why <strong>the</strong> inner diameteris only controlled.The <strong>de</strong>termined values of <strong>the</strong> friction factor k n aregiven in Table 3. Figures 2 and 3 show <strong>the</strong>relationships between <strong>the</strong> friction factors and <strong>the</strong>temperatures for <strong>the</strong> lubricants un<strong>de</strong>r study.Moreover, in Table 3 <strong>the</strong> value of friction factortaken from [5] are given. These data correspond to<strong>the</strong> upsetting of rings ma<strong>de</strong> from <strong>the</strong> same Al-alloyswith <strong>the</strong> help of hydraulic press. The <strong>de</strong>formationprocess was iso<strong>the</strong>rmal in those tests. It means that<strong>the</strong> initial temperature of a specimen and tools wasequal to each o<strong>the</strong>r. The initial strain rate was0.14 s -1 .Table 3. Friction actors k n valuesFriction factor k nT, °C Strain rate, s -10.14 s –1 28.6 s –1 0.14 s –1 28.6 s –1A95456 A95456 A92618 A92618IO+G200 0.171 0.41 0.25 0.21350 0.153 0.287 0.236 0.202430 0.155 0.245 0.146 0.179450 0.118 0.216 0.15 0.17470 0.11 0.21 0.138 0.143SO+G200 0.245 0.45 0.19 0.34350 0.206 0.396 0.223 0.32430 0.15 0.37 0.143 0.26450 0.12 0.31 0.114 0.24470 0.143 0.285 0.133 0.235Figures 2 and 3 illustrate <strong>the</strong> effect of twoparameters on friction factor, i.e. temperature andinitial strain rate. It can be seen that <strong>the</strong> moretemperature of <strong>de</strong>formation, <strong>the</strong> less friction factorvalue is. It is valid for both investigated alloys.On <strong>the</strong> o<strong>the</strong>r hand, using two different presses interms of <strong>the</strong>ir <strong>de</strong>sign allowed to investigate <strong>the</strong>effect of strain rate on friction factor value.Unfortunately, we could not perform thiscomparison within <strong>the</strong> whole range of investigatedtemperatures. The reason for that is linked to <strong>the</strong> factthat <strong>the</strong> conditions of <strong>de</strong>formation in each casesdiffered from each o<strong>the</strong>r. In case of using of <strong>the</strong>screw press for <strong>de</strong>formation <strong>the</strong> iso<strong>the</strong>rmal conditionwas approximately observed at <strong>the</strong> temperature of200°C.Taking it into consi<strong>de</strong>ration it can be conclu<strong>de</strong>d thatat temperature of 200°C <strong>the</strong> effect of strain rate ismore significant for Al-Mg alloy. Moreover, it isin<strong>de</strong>pen<strong>de</strong>nt from <strong>the</strong> lubricant’s composition.Increasing <strong>the</strong> strain rate from 0.14 to 28.6 s -1 givesrise to increase in friction factor in over two times. Itis valid for both lubricants.Fig. 2. Deformation of A92618 alloy: solid and dash lines –regression; points - experimentFig. 3. Deformation of A95456 alloy: solid and dash lines –regression; points - experimentOn <strong>the</strong> o<strong>the</strong>r hand, for Al-Cu-Mg-Fe-Ni alloy <strong>the</strong>effect of strain rate on friction factor value is not soobvious. For <strong>the</strong> lubricant based on syn<strong>the</strong>tic oil(SO+G) <strong>the</strong> influence of initial strain rate on k n isalmost <strong>the</strong> same. The increase in friction factor valueis over 1.5 times. For IO+G lubricant <strong>the</strong> effect ofstrain rate is opposite to it. The difference between<strong>the</strong> values of friction factor for both initial values ofstrain rate is inessential.4.2 Regression for friction factor vs temperatureThe temperature <strong>de</strong>pen<strong>de</strong>nce of <strong>the</strong> friction factor
can be <strong>de</strong>scribed using <strong>the</strong> following equation:2k n = Ao+ A1× To+ A2× To, (1)where A o , A 1 and A 2 = coefficients, and T о = <strong>the</strong>temperature of <strong>the</strong> <strong>de</strong>formed material.The values of <strong>the</strong> coefficients in equation (1) aregiven in Table 4.Table 4. Coefficients of temperature <strong>de</strong>pen<strong>de</strong>nce for k nCoefficientsStrain rate, s -10.14 s –1 28.6 s –1 0.14 s –1 28.6 s –1A95456 A95456 A92618 A92618IO+GA o , °C 0.16 0.387 0.086 0.10A 1 , 1/°C 0.00037 0.00037 0.0013 0.00086A 2 , 1/(°C) 2 -1.01×10 -6 -1.65×10 -6 -2.55×10 -6 -1.6×10 -6SO+GA o , °C 0.155 0.32 0.145 0.224A 1 , 1/°C 0.00088 0.00113 0.00085 0.00101A 2 , 1/(°C) 2 -2.05×10 -6 -2.53×10 -6 -2.03×10 -6 -2.13×10 -65 CONCLUSIONSIn summary, <strong>the</strong> following conclusions can be drawnfrom <strong>the</strong> results presented here:• The obtained temperature equations for <strong>the</strong>friction factor can be used for FE simulation of<strong>the</strong> massive hot forging of A95456 and A92618alloys at strain rate of or<strong>de</strong>r 10 -2 and 10 1 s -1 .• The calculated calibration curves for T о = 450°Ccan be applied to estimate <strong>the</strong> friction factor of alubricant for use in <strong>the</strong> massive hot forging ofinvestigated alloys.4.3 Calibration curvesThe numerical simulation also allowed us toconstruct calibration curves. The results of FEM areshown in Figures 4 and 5, in terms of reduction ininternal diameter of ring specimens as functions of<strong>the</strong> reduction in <strong>the</strong>ir height.Fig. 4. Calibration curves - A92618 alloyThe obtained curves correspond to an initialtemperature of <strong>the</strong> <strong>de</strong>formed material of T о = 450°C.This temperature is <strong>the</strong> optimal temperature ofmassive hot forging of both aluminum alloys un<strong>de</strong>rstudy.These plots allow to estimate <strong>the</strong> friction property ofa new lubricant which is using for <strong>de</strong>formation ofei<strong>the</strong>r A92618 alloy or A95456 alloy. Temperatureof material’s specimen/tools as well as initial strainrate in <strong>the</strong> test should be <strong>the</strong> same as mentioned inSection 2.REFERENCESFig. 5. Calibration curves - A95456 alloy1. M. Kunogi, On Plastic Deformation of Hollow Cylin<strong>de</strong>rsUn<strong>de</strong>r Axial Compressive Loading. Rep. Sci. Res. Inst.(Tokyo) 2 (1954) 63-92.2. A.T. Male, M.G. Cocroft, Method for <strong>the</strong> Determinationof <strong>the</strong> Coefficient of Friction of Metals Un<strong>de</strong>rConditions of Bulk Plastic Deformation. J.Instit.Metals.93 (1964-65) 38-46.3. M. Burgdorf, Investigation of Friction Values for MetalForming Processes by <strong>the</strong> Ring Compression Method.Industrie-Anzierger. 89 (1967) 7994. K.P.Rao, K.Sivaram, A review of ring-compressiontesting and applicability of <strong>the</strong> calibration curves,J.Mat.Proc.Technol. 37 (1993) 295-318.5. P.Petrov, Generalized approach to <strong>the</strong> choice of lubricantfor hot iso<strong>the</strong>rmal forging of aluminium alloys,Computer Methods in Materials Science 7(2) (2007)106-111.6. A.N. Levanov, V.L. Kolmogorov, S.P. Burkin, B.R.Kartak, U.V. Ashpur and U.I. Spasskiy, Contact Frictionin Metal Forging, Metallurgia, Moscow (1976).7. P.Petrov, M.Petrov, Experimental and numericalinvestigation of friction in hot iso<strong>the</strong>rmal <strong>de</strong>formation ofaluminium alloy AA3003, The 7th International<strong>ESAFORM</strong> <strong>Conference</strong> on Material Forming, Norway,Romania, Cluj-Napoca, 27-29 April, 2005, p.511-514.8. P.G. Mikliev, Mechanical properties of Light Alloys inTemperatures and Strain Rates of its Forging,Metallurgia, Moscow (1976).
Performance enhancements of die casting tools trough PVDnanocoatingsM. Rosso 1 , D. Ugues 1 , E. Torres 1 , M. Perucca 2 , P. Kapranos 31 Politecnico di Torino – Cso Duca <strong>de</strong>gli Abruzzi, 24, 10129 Turin (Italy)URL: www.polito.it e-mail: mario.rosso@polito.it; daniele.ugues@polito.it;eloy.torres@polito.it2 Clean NT Lab, Environment Park - Via Livorno, 58/60, 10144 Turin (Italy)URL: http://www.cleanntlab.com/e-mail: massimo.perucca@envipark.com3 The University of Sheffield - Mappin Street, Sheffield, S1 3JD, United KingdomURL: www.shef.ac.uk/materialse-mail: p.kapranos@shef.ac.ukABSTRACT: Wear and failure of die casting dies involve a complex interaction between variousmechanisms. The most important wear and failure mo<strong>de</strong>s are summarized as follows: (i) <strong>the</strong> so-calledwashout damages on working die surfaces are attributed to erosion, corrosion and sol<strong>de</strong>ring; (ii) <strong>the</strong>rmalfatigue is <strong>the</strong> most important failure mo<strong>de</strong> in die casting. The sector of surface thin PVD coatings isconstantly enhancing in or<strong>de</strong>r to meet <strong>the</strong> increasing <strong>de</strong>mand for improved performances of tooling.Advanced PVD coatings are <strong>de</strong>signed to withstand severe mechanical and <strong>the</strong>rmal stress conditions. ACrAlSiN nanostructured coating system was <strong>de</strong>posited on <strong>the</strong> base material, modulating <strong>the</strong> chemicalcomposition so as to increase ei<strong>the</strong>r <strong>the</strong> chromium or <strong>the</strong> aluminium-silicon content. Then, ano<strong>the</strong>r set ofspecimens was subjected to a cyclic immersion program in a molten aluminium bath. The washout signs were<strong>de</strong>tected and monitored in function of <strong>the</strong> increasing number of cycles.Key words: PVD ceramic coatings, aluminium die casting, washout, sol<strong>de</strong>ring, modulated PVD composition1 INTRODUCTIONThe process of aluminium die casting presents acomplex phenomenon of <strong>de</strong>gradation, whereerosion, sol<strong>de</strong>ring, corrosion, <strong>the</strong>rmal fatigueusually occur jointly. All of <strong>the</strong>se phenomena aremajor sources of limitation to <strong>the</strong> die castingsservice life. The application of hard PVD coatingsmay result efficient against <strong>the</strong>se <strong>de</strong>gradationmechanisms when applied on particular parts of <strong>the</strong>die: e.g. <strong>the</strong> inlet and <strong>the</strong> pins.The <strong>de</strong>velopment of physical vapour <strong>de</strong>position(PVD) has provi<strong>de</strong>d engineers and systems<strong>de</strong>signers with <strong>the</strong> ability to tailor <strong>the</strong> surfaceproperties of a range of mechanical <strong>de</strong>vices to suit agrowing range of applications. Advanced PVDcoatings are <strong>de</strong>signed to withstand severemechanical and <strong>the</strong>rmal stress conditions.Generally, <strong>the</strong> main requirements expected byadvanced coatings are high hardness andcompression strength, high wear resistance, highmechanical and <strong>the</strong>rmal fatigue resistance and lowfriction coefficient. These parameters may beattained by properly functionalising tools surfaceswith innovative targeted thin films.Fur<strong>the</strong>rmore, <strong>the</strong> adhesion strength at <strong>the</strong> interfacebetween coating and substrate results of majorimportance to guarantee a long endurance of <strong>the</strong> toollifetime and surface properties. In <strong>the</strong> recent years,single layer, multilayer and gradient microstructureshave been <strong>de</strong>veloped and now, withtesting of different coating chemistry andstoichiometry, representing <strong>the</strong> cutting edgesolutions in coating technology.The present paper reports <strong>the</strong> results of a research on<strong>the</strong> effect of PVD films applied on a heat treated hotwork tool steel substrate. The aim of this study wasto <strong>de</strong>termine <strong>the</strong> behaviour exhibited by eachcoatings in relation with <strong>the</strong> modulated chemicalcomposition. To this purpose a set of coatedspecimens with chemical composition variationsbased on <strong>the</strong> CrAlSiN system were produced
through an arc cathodic equipment. The so producedspecimens were subjected to a program of cyclicimmersions in molten aluminium alloy bath. Theassessment of damages on <strong>the</strong> cycled specimens wasperformed through optical and SEM microscopy ofboth surfaces and transverse sections, so as toanalyse <strong>the</strong> presence, if any, of sol<strong>de</strong>ring pits.2 EXPERIMENTAL PART2.1 Specimens fabricationA parent block was cut from an annealed AISI H11hot rolled bar, produced through vacuum meltingand remelting processes. From this test coupon a setof cubic specimens were fabricated. Thesespecimens were <strong>the</strong>n vacuum heat treated accordingto <strong>the</strong> following parameters: austenitizing at 1,000°C– quenching with 5 bar nitrogen flow - firsttempering at 550°C – second and third tempering at595°C to about 45.5 HRC, which is ra<strong>the</strong>r typical forhot work tool steels.Ceramic coatings were <strong>de</strong>posited through <strong>the</strong>Physical Vapor Deposition (PVD) process provi<strong>de</strong>dby <strong>the</strong> PL-55 prototype unit installed at <strong>the</strong> CleanNT Lab. The unit is equipped with <strong>the</strong> innovativeLateral Arc Rotating Catho<strong>de</strong>s (LARC ® ) system.Two rotating cylindrical catho<strong>de</strong>s allow enlargedtarget surface and continuous surface refreshingduring evaporation of <strong>the</strong> metallic constituentscharacterizing <strong>the</strong> ceramic coating.The CrAlSiN coating systems were <strong>de</strong>posited on <strong>the</strong>all specimens steel base material AISI H11 withdifferent modulations of <strong>the</strong> chemical compositionwere <strong>de</strong>veloped so as to increase ei<strong>the</strong>r <strong>the</strong>chromium or <strong>the</strong> aluminium-silicon content. Theobtained coatings were roughly 3 μm thick. Theywere characterized by a multilayered structurecovering about 50% of <strong>the</strong> entire coating <strong>de</strong>pth,followed by a complementary massive monolayer of<strong>de</strong>fined chemical composition. Six chemicalcomposition modulations of <strong>the</strong> external layer wereprepared according to <strong>the</strong> variations of <strong>the</strong> catho<strong>de</strong>arc current and of <strong>the</strong> nitrogen flow.The coating thickness was evaluated through <strong>the</strong> ballcrater technique. A Rockwell in<strong>de</strong>nter was used tostudy <strong>the</strong> adhesion properties of <strong>the</strong> <strong>de</strong>posited filmsby <strong>the</strong> in<strong>de</strong>ntation method.Fracture cross-section of <strong>the</strong> coated AISI H11samples was prepared to <strong>the</strong> scanning electronmicroscope (SEM) morphology investigation. X-raydiffraction (XRD) analysis was performed using aSiemens D5000 X-ray diffractometer.Monochromatic Cu-Kα radiation, produced at anacceleration voltage of 40 keV and 40 mA current,was used an initial inci<strong>de</strong>nce angle of 10°.Table 1. Deposition parameters used for <strong>the</strong> fabrication of <strong>the</strong>six different CrAlSiN coating systemsCathodic arc current AlSi/Cr [A]N 2 [sccm] 110 / 70 100 / 90 80 / 100 60 / 110120 A1 D1150 B2 C2190 A3 D3The coatings hardness was <strong>de</strong>termined using aMitutoyo MVK-G1 microharness tester at 100, 50,25, 10 g loads. Later <strong>the</strong> hardness of <strong>the</strong> differentcoatings was extrapolated from <strong>the</strong> evaluation ofmicrohardness at increasing weights and applying amodified form of <strong>the</strong> work-of-in<strong>de</strong>ntation mo<strong>de</strong>l.HHCf− H− HSS=1+1( β β ) X0Where H c is <strong>the</strong> composite hardness, that is <strong>the</strong>hardness due to <strong>the</strong> effects of <strong>the</strong> film and <strong>the</strong>substrate; Hs is <strong>the</strong> substrate hardness; H f is <strong>the</strong> filmhardness; β is <strong>the</strong> relative in<strong>de</strong>ntation <strong>de</strong>pth (RID),<strong>de</strong>fined as <strong>the</strong> ratio of <strong>the</strong> maximum in<strong>de</strong>nterpenetration <strong>de</strong>pth to <strong>the</strong> coating thickness; β 0 and Xare systems parameters.Tribological properties of <strong>the</strong> coatings <strong>de</strong>posited onAISI H11 substrates were evaluated by means oflow frequency (5 Hz) reciprocating sliding wear test(at 5 N normal load for 500 m sliding distance) witha 10 mm diameter SAE 52100 har<strong>de</strong>ned steel ball, ata temperature 25 ± 2 °C and 50 ± 5 % relativehumidity and amplitu<strong>de</strong> 10mm (according to <strong>the</strong>ASTM G133 standard). The wear scar was observedthrough electronic microscopy (SEM) and EDS spotanalysis was used to confirm whe<strong>the</strong>r <strong>the</strong> coatinghad failed or if <strong>the</strong>re was simply transfer ascounterface material from <strong>the</strong> steel ball.The specimens were <strong>the</strong>n subjected to cyclicimmersions in a molten aluminium alloy so as tosimulate <strong>the</strong> environmental conditions that occur at<strong>the</strong> surface of a high pressure die casting. The(1)
aluminium alloy was AlSi 8 Cu 3 Fe, commonly usedfor die casting. The cooling bath is constituted of adiluted solution (1:80) of a commercial die lubricant.The duration of a typical cycle is of 30s with anactual immersion time of 4s for both <strong>the</strong> aluminiumalloy and cooling baths. All <strong>the</strong> specimens testedwere periodically analyzed to <strong>de</strong>tect <strong>the</strong> formation ofsurface <strong>de</strong>fects by SEM inspection.3 RESULTS AND DISCUSSIONThe reflected light micrograph of <strong>the</strong> ball crater(figure 1) clearly shows <strong>the</strong> multilayer structure of<strong>the</strong> coatings and led to a thickness measurement of2.875±0.074 μm, and clearly shows <strong>the</strong> multilayeredstructure of <strong>the</strong> coatings.Fig. 2. Adhesion Test: appearance of Rockwell in<strong>de</strong>ntations onspecimen A3The coatings <strong>de</strong>posited tested in reciprocatingsliding in term of friction coefficient exhibited asimilar trend, where <strong>the</strong> friction coefficient increasedgradually from 0.55 to 0.65. SEM micrographs of<strong>the</strong> wear scars for coatings A1, A3, B2 and C2(figure 3) shows ploughings marks along <strong>the</strong>direction of sliding, instead for coatings D1 and D3(figure 4) <strong>de</strong>monstrate ploughings marks along <strong>the</strong>direction of sliding plus signs of <strong>de</strong>lamination areas.Fig. 1. Reflected light micrograph of a ball crater on A1The appearance of Rockwell C in<strong>de</strong>ntation onrepresentative coated systems is reported in figure 2.The adhesion was evaluated on <strong>the</strong> base of anobservation of <strong>the</strong> aspects of <strong>the</strong> cracks and of <strong>the</strong>presence of coating <strong>de</strong>tachments around <strong>the</strong>in<strong>de</strong>ntation. The adhesion evaluated through this testcan be consi<strong>de</strong>red good since no <strong>de</strong>tachments of <strong>the</strong>coating along <strong>the</strong> edge of <strong>the</strong> in<strong>de</strong>ntation could berevealed.Fig. 3. SEM micrographic wear scars specimen A1The hardness evaluations for <strong>the</strong> different coatingsas a function of increasing applied weights and, as aconsequence, of increasing in<strong>de</strong>ntation <strong>de</strong>pth. The Acoatings presented <strong>the</strong> highest film hardness (46GPa), <strong>the</strong> D coatings <strong>the</strong> lowest (38 GPa), whereas<strong>the</strong> B and C coatings exhibited an intermediatehardness value (43 GPa).Fig. 4. SEM micrographic wear scars specimen D1
To verify <strong>the</strong> absence of coating in <strong>the</strong> critical zones,a <strong>de</strong>epening was performed using an EDS (EnergyDispersive X-ray Spectrometer) probe (figure 4). Bythis method, <strong>the</strong> coating spoliation could beconfirmed since contents were <strong>de</strong>tected in <strong>the</strong>critical points. figure 5 and figure 6 shows one of <strong>the</strong>critical points and <strong>de</strong>tails of <strong>the</strong> EDS spectrum in <strong>the</strong>two significant zones.after <strong>the</strong> first 5000 cycles.The cyclic immersion test in <strong>the</strong> molten aluminiumalloy clearly <strong>de</strong>monstrated that <strong>the</strong> ceramic coatings<strong>de</strong>posited on <strong>the</strong> steel surface may play a positiverole in terms of <strong>the</strong> reduction of <strong>the</strong> sol<strong>de</strong>ring effect.In <strong>the</strong> best performing systems, A1 and B2, <strong>the</strong>sol<strong>de</strong>ring didn’t appear up to ca. 7500 cycles4 CONCLUSIONSFig. 3. Details of <strong>the</strong> SEM micrographic specimen D1On <strong>the</strong> base of <strong>the</strong> complete coating qualityassessments (thickness, adhesion, hardness,tribological properties), <strong>the</strong> A coatings were(systems with high content aluminum-silicon)consi<strong>de</strong>red <strong>the</strong> most promising candidate for <strong>the</strong>final applications on protection of aluminium diecasting tools. The coatings where a high aluminiumsiliconcomposition with a concurrent medium tolow nitrogen content was realized resulted to be <strong>the</strong>most effective against sol<strong>de</strong>ring. On <strong>the</strong> contrary, <strong>the</strong>enrichment in chromium of coating composition wasfound to be not so effective in preventing aluminiumsol<strong>de</strong>ring.REFERENCESFig. 4. EDS spectrum graphs by 2 different zonesAs for <strong>the</strong> washout resistance, a first ranking of <strong>the</strong>coated specimens performances can be drawn justafter <strong>the</strong> first step of immersion in moltenaluminium. Actually, specimens D1 and D3 (thosewith <strong>the</strong> lowest AlSi/Cr ratio) presented <strong>the</strong>formation of a thick sol<strong>de</strong>red layer just after 5000cycles. On <strong>the</strong> contrary <strong>the</strong> observation of <strong>the</strong> o<strong>the</strong>rspecimens did not revealed at all <strong>the</strong> presence ofsol<strong>de</strong>ring points (specimens A1 and B2) or revealedvery few sol<strong>de</strong>ring points (specimens A3 and C2)1. Chowdhury, A., Cameron, D., Hashmi, M. “Adhesion ofcarbon nitri<strong>de</strong> thin films on tool steel” Surface AndCoatings Technology, 116-119, (1999).p. 462. , D., Holler, F., Mitterer, C. “Hard coatings produced byPACVD applied to aluminium die casting” Surface AndCoatings Technology, 116-119, (1999) p.530.3. Holler, F., Ustel, F., Mitterer, C., Heim, D., Proc.“Thermal cycling and oxidation behaviour of hardcoatings in aluminium die casting” 5th Int. Conf. onTooling, Leoben, Inst. Für Metallkun<strong>de</strong> undWerkstoffprüfung, Leoben, Austria, (1999) p.357.4. Joshi, V., Srivastava, A., R. Shivpuri, R. “Investigatingtribochemical behavior of nitri<strong>de</strong>d die casting surface”Proc. 6th Int. Conf. on Tooling, Karlstad, KarlstadUniversity, Karlstad, Swe<strong>de</strong>n, (2002) p.809.5. Mitterer, C., Holler, F., Ustel, F., Heim, D. “Applicationof hard coatings in aluminium die casting — sol<strong>de</strong>ring,erosion and <strong>the</strong>rmal fatigue behaviour” Surface AndCoatings Technology 125, (2000) p.233.6. J.R. Tuck, A.M. Korsunsky, D.G. Bhatc, S.J. Bull,“In<strong>de</strong>ntation hardness evaluation of cathodic arc <strong>de</strong>positedthin hard coatings” Surface and Coatings Technology 139(2001).p. 63-74.7. Ugues, D., Rosso, M., Albertinazzi, M., Raimondi, F.,Silipigni, A. (2004a) “Heat treatments and innovativesurface treatments for high performing dies” Proc. 2nd Int.Conf. High Tech Die Casting, Brescia, Italy, p. 155.
An improved « plastic wave » friction mo<strong>de</strong>l for rough contact inaxisymmetric mo<strong>de</strong>ling of bulk forming processesE. Vidal-Sallé 1 , S. Boutabba 2 , Y. Cui 1 , J.C. Boyer 11 Département <strong>de</strong> Génie Mécanique Conception, Institut National <strong>de</strong>s Sciences Appliquées, 20 Av A. Einstein,69621 Villeurbanne Ce<strong>de</strong>x, FranceURL: www.insa-lyon.fr e-mail: Emmanuelle.Vidal-Salle@insa-lyon.fr; Jean-Clau<strong>de</strong>.Boyer@insa-lyon.fr2 Département <strong>de</strong> Génie Mécanique, Université <strong>de</strong> Guelma, Guelma, Algériee-mail: boutabba_s_lpg@yahoo.fr;ABSTRACT: In <strong>the</strong> case of a rough contact without friction between axisymmetric billets and punches,experimental evi<strong>de</strong>nces as well as very fine numerical mo<strong>de</strong>lling show that <strong>the</strong> workpiece material flows as alubricant layer in <strong>the</strong> vicinity of <strong>the</strong> contact surface. As no existing friction laws used for bulk formingprocesses can take into account this typical surface behaviour, an improvement of <strong>the</strong> so-called “plastic wave”friction law is proposed in or<strong>de</strong>r to <strong>de</strong>scribe more accurately <strong>the</strong> plastic flow in <strong>the</strong> workpiece-tool interface.Key words: Bulk Forming, Rough Friction, Plastic Wave Mo<strong>de</strong>l1 INTRODUCTIONThe upsetting of billets with conical punches ofknown surface roughness and appropriate angles isproposed as a new friction test for <strong>the</strong> parameteri<strong>de</strong>ntification of workpiece-tool interface behaviourduring bulk forming processes. The experimentaland numerical analysis of this forming operationshowed a plastic flow of <strong>the</strong> material layer beneath<strong>the</strong> workpiece surface that led to an “unpredictable”<strong>de</strong>formed shape of <strong>the</strong> specimen with <strong>the</strong> classicalfriction laws. So, this simple process is simulatedwith <strong>the</strong> finite element method and very fine meshesin or<strong>de</strong>r to predict numerically <strong>the</strong> <strong>de</strong>formed shapeof <strong>the</strong> cylin<strong>de</strong>rs near <strong>the</strong> workpiece-tool interfacewith <strong>the</strong> actual geometry of <strong>the</strong> tool roughness. Inor<strong>de</strong>r to mo<strong>de</strong>l <strong>the</strong> behaviour of <strong>the</strong> actual interfacewith a macroscopic law, an improvement of <strong>the</strong>plastic wave friction mo<strong>de</strong>l is <strong>de</strong>veloped with tiltedboundary conditions linked to <strong>the</strong> displacements of<strong>the</strong> no<strong>de</strong>s sliding on <strong>the</strong> surface tool.2 THE PLASTIC WAVE FRICTION MODEL2.1 Summary of <strong>the</strong> <strong>the</strong>oryFor rough contact, Challen and Oxley [1] hadproposed a friction mo<strong>de</strong>l using <strong>the</strong> plastic<strong>de</strong>formation of <strong>the</strong> material workpiece in localasperities of <strong>the</strong> rigid tool surface. The mo<strong>de</strong>l isbased upon an i<strong>de</strong>al 2D geometry of <strong>the</strong> tool surface.For <strong>the</strong> sake of simplifying <strong>the</strong> <strong>the</strong>ory, <strong>the</strong> actualroughness is supposed to be equivalent to triangularwaves, height and wavelengths of which equal <strong>the</strong>mean height R and <strong>the</strong> mean wavelength AR of <strong>the</strong>actual roughness profile respectively, see figure 1.R/2Ra=R/4-R/2Wawelength = ARRoughness ProfileHeight =RFig. 1. Triangular asperityThese profile parameters are <strong>de</strong>fined by <strong>the</strong> standardISO 4287-1997 and can be measured withprofilometers. With this simple geometry, <strong>the</strong> flowof <strong>the</strong> workpiece material un<strong>de</strong>r <strong>the</strong> tool asperity isanalysed with <strong>the</strong> slip line <strong>the</strong>ory. Assuming aperfectly plastic material, <strong>the</strong> value of <strong>the</strong> frictionstress τ f is given by <strong>the</strong> balance of <strong>the</strong> externaltractions, see equation (1). τ f is a function of twocharacteristic angles Φ and η of <strong>the</strong> plastic wave, σ y<strong>the</strong> yield stress of <strong>the</strong> billets material, α <strong>the</strong> asperityα
angle, and m 0 <strong>the</strong> constant friction coefficientbetween <strong>the</strong> tool asperity and <strong>the</strong> billet surface :σ ⎡⎧ ⎛ π ⎞⎫⎤⎢ ⎜ ⎟ ( ) ⎥2 3 cosα ⎣⎩⎝ 4 ⎠⎭⎦yτf= ⎨1 + 2 + Φ − η ⎬sinα + cos α + 2Φcos m⎧⎪ sinα2 ⎪⎩1 m−10−1α + Φ = η = sin ⎨ ⎬( − )0⎫⎪⎪⎭(1)With this <strong>the</strong>oretical approach, <strong>the</strong> proposed frictionlaw for rough contact looks like a mix of <strong>the</strong>Coulomb and Tresca laws, see figure 2 where <strong>the</strong>abscissa axis is <strong>the</strong> ratio of <strong>the</strong> normal stress to <strong>the</strong>tensile yield stress of <strong>the</strong> workpiece material, and <strong>the</strong>ordinate axis, <strong>the</strong> ratio of <strong>the</strong> friction stress to <strong>the</strong>shear yield stress:Normalised friction stress0.30.250.20.150.10.05Angle = 5°Angle = 4°Angle = 3°Angle = 2°Angle = 1°Angle = 0.5°0 1 2 3 4 5 6 7 8Normalised normal stressFig. 2. Plastic wave friction lawFor normal stress lower than 1.5 <strong>the</strong> tensile yieldstress of <strong>the</strong> workpiece material, <strong>the</strong> friction stressobeys to <strong>the</strong> Coulomb law with a friction coefficientsensitive to <strong>the</strong> angle α of <strong>the</strong> tool asperity. For highnormal stress, <strong>the</strong> friction stress is quite constant asproposed by <strong>the</strong> Tresca mo<strong>de</strong>l with a constantcoefficient also sensitive to <strong>the</strong> asperity angle α. Inor<strong>de</strong>r to use this interface constitutive law, threeparameters have to be i<strong>de</strong>ntified: <strong>the</strong> yield stress of<strong>the</strong> workpiece material in <strong>the</strong> vicinity of <strong>the</strong> contactarea, <strong>the</strong> tool asperity angle α, and <strong>the</strong> constantfriction coefficient m 0 between <strong>the</strong> tool asperity and<strong>the</strong> plastic wave surface. The i<strong>de</strong>ntification of <strong>the</strong>first parameter needs torsion tests of <strong>the</strong> materialworkpiece as <strong>the</strong> plastic strain could reach values in<strong>the</strong> range 100% to 500%. The asperity angle α canbe <strong>de</strong>duced from <strong>the</strong> roughness profile if <strong>the</strong> actualmesoscopic geometry of <strong>the</strong> tool surface is not toofar from <strong>the</strong> assumed triangular profile used for <strong>the</strong>slip line <strong>the</strong>ory discussion. The main unknownparameter is <strong>the</strong> constant coefficient m 0 which, atpresent, is still “measured” with <strong>the</strong> so-called ringcompressiontest proposed first by Kunogi [2] forcomparison of cold forging lubricants for rollingwhere two opposite plastic flows are separated by aneutral zone un<strong>de</strong>r high contact pressure. O<strong>the</strong>rauthors like Petersen et al. [3], proposed alternativering geometries in or<strong>de</strong>r to modify this test for <strong>the</strong>low contact pressure range. Anyway, <strong>the</strong> slidingvelocity distribution and <strong>the</strong> contact pressuredistribution at <strong>the</strong> tool-ring interface are nonuniform,see Vidal-Sallé et al. [4], and <strong>the</strong> influenceof strain har<strong>de</strong>ning is not negligible, so a simple testhas to be <strong>de</strong>signed for a consistent i<strong>de</strong>ntification of<strong>the</strong> constant friction parameter m 0 . As a newattempt, a compression test with conical punchgeometries and low constant friction parameter m 0 isproposed in or<strong>de</strong>r to check <strong>the</strong> predictions of <strong>the</strong>plastic wave mo<strong>de</strong>l on simple axisymmetric cases.2.2 Actual and <strong>the</strong>oretical roughnessFor axisymmetric geometry, <strong>the</strong> punches aremachined by turning and <strong>the</strong> plastic flow of <strong>the</strong>workpiece is purely radial so <strong>the</strong> 2D mo<strong>de</strong>l of <strong>the</strong>plastic wave mo<strong>de</strong>l is pertinent. Nowadays,machining is using inserts of known circulargeometry. The turned punch surfaces were analysedwith a profilometer and <strong>the</strong> roughness profiles of <strong>the</strong>surfaces are similar to <strong>the</strong> record of figure 3:Fig. 3. Actual profile of a turned surfaceFor this conical punch, <strong>the</strong> asperity wave length of<strong>the</strong> circular arc is close to 360 µm and its asperityheight close to 38 µm but one issue to address ishow to transform this circular arc geometry in atriangular profile in or<strong>de</strong>r to evaluate <strong>the</strong> asperityangle α. The simplest solution is a triangularasperity with <strong>the</strong> same height and wave length but<strong>the</strong> volume of <strong>the</strong> plastic wave trapped by <strong>the</strong> toolroughness will be slightly un<strong>de</strong>restimated. If <strong>the</strong>mass balance must be fulfilled, <strong>the</strong> triangularasperity must have an area equal to <strong>the</strong> circular arc.This second solution leads to a height of <strong>the</strong>triangular asperity greater than <strong>the</strong> actual one if <strong>the</strong>wave length is held constant and so to a sharperasperity angle. Numerical tests were conductedwithout local friction for five different roughnessprofiles in <strong>the</strong> range of <strong>the</strong> machined punches inor<strong>de</strong>r to compare displacements, stress and plasticstrain un<strong>de</strong>r a conical punch mo<strong>de</strong>lled with its actual
circular arcs on <strong>the</strong> first hand, triangular asperitieswith equivalent height and triangular asperities wi<strong>the</strong>quivalent area on <strong>the</strong> second hand. From <strong>the</strong>secomparisons, <strong>the</strong> equivalent height triangle asperityhas been found to be <strong>the</strong> better solution withdistributions of displacements and of von Misesstress very close to <strong>the</strong> distributions with <strong>the</strong> actualcircular arc profile. So, for fur<strong>the</strong>r numerical and<strong>the</strong>oretical investigations, <strong>the</strong> equivalent heighttriangle asperity will be used instead of <strong>the</strong> actualcircular arc.12° with different heights and wave lengthasperities, see table 1. Experiments were conductedonly with rough dies.3 EXPERIMENTAL DATA3.1 BilletsThe billets were cylindrical with an initial diameterof 60 mm and an initial length of 80 mm. Thematerial used was an aluminum alloy with a lowyield stress i<strong>de</strong>ntified with a tensile test. The stressstraincurve was measured only up to 10% and <strong>the</strong>nextrapolated with a logarithmic function for largerplastic strain, see figure 4:Fig. 4. Stress-strain curve of <strong>the</strong> billet materialFig. 5. Experimental set upTable1. Roughness parameters of <strong>the</strong> punchesCone Angle R(µm) AR(µm) θ(°)3° 2.913 120.681 2.765° 13.842 238.970 6.6112° 38.310 358.978 12.043° 9.164 240.131 4.367° 20.985 359.060 6.673.3 Experimental resultsTwo different lubrication conditions were appliedfor <strong>the</strong> upsetting with conical punches, <strong>the</strong> first onewas dry friction and <strong>the</strong> second one “perfect sliding”with a bisulphi<strong>de</strong>-molyb<strong>de</strong>num grease. The<strong>de</strong>formed specimens for three different roughnessesare presented on figure 6. Dry friction inducedbulging while perfect sliding led to “diabolo” likeshape. This macroscopic difference can be used toi<strong>de</strong>ntify friction parameter but it is not worthwhile tonotice that <strong>the</strong> displacements of <strong>the</strong> equator of <strong>the</strong>billets <strong>de</strong>pend also on o<strong>the</strong>r parameters than friction.3.2 Upsetting with conical punchesThe classical friction test for bulk forming processesare mainly based on compression that inducesheterogeneous strain har<strong>de</strong>ning in <strong>the</strong> billets withrough punches and friction. In or<strong>de</strong>r to reduce <strong>the</strong>heterogeneity of <strong>the</strong> yield stress in <strong>the</strong> billets, <strong>the</strong>upsetting with conical punch is tested with particularvalues of <strong>the</strong> cone angles set equal to <strong>the</strong> asperityangle α of <strong>the</strong> triangular roughness and quasi perfectsliding. The billets are cylindrical but <strong>the</strong>ir ends aremachined as concave cones for matching with <strong>the</strong>upper and lower punches. Different upsetting testswere conducted for roughness ranging from 3° toFig. 6. Deformed specimens with and without frictionThe variations of <strong>the</strong> upper and lower diameters of<strong>the</strong> <strong>de</strong>formed billets are more representative of <strong>the</strong>workpiece-tool interface behaviour and <strong>the</strong>displacements of <strong>the</strong> upper and lower billet edgeswill be <strong>the</strong> main variables used for <strong>the</strong> i<strong>de</strong>ntificationof <strong>the</strong> constant friction parameter m 0 of <strong>the</strong> plasticwave friction mo<strong>de</strong>l.
4 NUMERICAL MODELLING4.1 Upsetting with conical punchesThe problem symmetries allow consi<strong>de</strong>ring only onehalf of one punch and one quarter of <strong>the</strong> billet.mo<strong>de</strong>l and flat punches. In figure 8 both billets aregiven with <strong>the</strong> same scale. Discrepancies found canbe explained by <strong>the</strong> differences on <strong>the</strong> geometric<strong>de</strong>scription. With <strong>the</strong> rough tool, <strong>the</strong> mesh is fineenough to take into account all <strong>the</strong> asperities of <strong>the</strong>interface. It is not <strong>the</strong> case for <strong>the</strong> left map where <strong>the</strong>meshing is coarse.Fig. 7. Plastic strain distribution in <strong>the</strong> billet for perfect slidingThe punch material is consi<strong>de</strong>red as elastic and <strong>the</strong>billet material elastic-plastic with <strong>the</strong> strainhar<strong>de</strong>ning <strong>de</strong>fined by <strong>the</strong> constitutive law given onfigure 5. In <strong>the</strong> area of contact with <strong>the</strong> punch, <strong>the</strong>mesh of <strong>the</strong> billet is very fine with twelve elementsin front of each tool asperity of a 7° cone angle. Theexplicit algorithm of <strong>the</strong> Abaqus software with anappropriate mass scaling is used for solving thishuge number of equations. In spite of this choice,only small billets with 6 mm diameter and 8 mmlength were analysed in a reasonable time with adual core PC. Never<strong>the</strong>less, <strong>the</strong> results werequalitatively attractive as a mesoscopic effect of <strong>the</strong>roughness was observed. Some kind of Venturieffect is observed in a 0.2 mm thick layer of <strong>the</strong>billet material with very large plastic strains (greaterthan 200%). This plastic flow feeds a flash at <strong>the</strong>edge of <strong>the</strong> billet, see figure 7. Accurateobservations of <strong>the</strong> <strong>de</strong>formed specimens presentedon figure 6 confirm this fact with a 0.7 mm largeflange on both edges of <strong>the</strong> billets.4.2 Improved plastic wave mo<strong>de</strong>lThe plastic flow in <strong>the</strong> vicinity of <strong>the</strong> punch surfacewas found to be sensitive to <strong>the</strong> local slope including<strong>the</strong> roughness profile of <strong>the</strong> tool. As it is not realisticto <strong>de</strong>fine <strong>the</strong> tooling geometry of any bulk formingprocess with any roughness profile, a firstimprovement would be <strong>the</strong> <strong>de</strong>finition of tiltedboundary conditions coupled with <strong>the</strong> displacementsof no<strong>de</strong>s sliding on <strong>the</strong> surface tool. This solutionhas been implemented with <strong>the</strong> plastic wave frictionFig. 8. Upsetting with flat punches - Plastic strain distributionThe prediction of <strong>the</strong> displacements of <strong>the</strong> upperedge with <strong>the</strong> improved plastic wave mo<strong>de</strong>l is veryclose to <strong>the</strong> values of <strong>the</strong> punch <strong>de</strong>fined with itsactual roughness, but <strong>the</strong> <strong>de</strong>formed shape is not ingood agreement as <strong>the</strong> work har<strong>de</strong>ning is found verydifferent in <strong>the</strong> two billets.5 CONCLUSIONSThe numerical analysis of an axisymmetric roughcontact with <strong>the</strong> finite element method and anexplicit integration scheme coupled to a fine meshtaking into account <strong>the</strong> roughness geometry of <strong>the</strong>tools gives results similar to <strong>the</strong> experiment. Theactual plastic flow of <strong>the</strong> billet material in <strong>the</strong> closevicinity of <strong>the</strong> tool has to be introduced in <strong>the</strong>friction laws. Fur<strong>the</strong>r modifications of <strong>the</strong> interfaceconstitutive equations are necessary for improving<strong>the</strong> numerical predictions of <strong>the</strong> billet-tool contact.ACKNOWLEDGEMENTSThe experimental part of this work has been completed un<strong>de</strong>r<strong>the</strong> supervision of Pr. A. Torrance at <strong>the</strong> Department ofMechanical Engineering and Manufacturing of Trinity CollegeDublin with an Erasmus Mundus Masters grant from <strong>the</strong> E.C.REFERENCES1. J.M. Challen, and P.L.B. Oxley, An explanation of <strong>the</strong>different regimes of friction and wear using asperity<strong>de</strong>formation mo<strong>de</strong>ls, Wear 53 ,(1979) 229-2432. M. Kunogi, J. Sci. Res. Inst. .2 ,(1954), 633. S.B. Petersen, P.A.F. Martins and N. Bay, Friction inbulk metal forming, J. of Mat. Proc. Tech. 66, (1997),186-1944. E. Vidal-Sallé, L. Baillet , J.-C Boyer., Friction law andparameter i<strong>de</strong>ntification, 2 nd <strong>ESAFORM</strong> <strong>Conference</strong> onMaterial Forming, Guimarães (1999), 603-606
Measurement of friction in a cold extrusion operation: Study bynumerical simulation of four friction testsQ. Zhang 1 , M. Arentoft 2 , S. Bruschi 3 , L. Dubar 4 , E. Fel<strong>de</strong>r 11 CEMEF, UMR CNRS/Ecole <strong>de</strong>s Mines <strong>de</strong> Paris 7635, B.P. 207, F 06904 Sophia Antipolis Ce<strong>de</strong>x, FranceURL: http://www.cemef.cma.fr/e-mail: qi.zhang@ensmp.fr; Eric.Fel<strong>de</strong>r@ensmp.fr2 IPU, Technical University of Denmark, Produktionstorvet, Bygning 425 DK-2800 Kgs. Lyngby, DenmarkURL: http://www.ipu.dke-mail: ma@ipu.dk3 DIMEG, University of Padova, Via Venezia, 1-35131 Padova, ItalyURL: http://www.dimeg.unipd.it/e-mail: bruschis@ing.unitn.it4 LAMIH, Université <strong>de</strong> Valenciennes Le Mont Houy F59313 Valenciennes Ce<strong>de</strong>x 9, FranceURL: http://www.univ-valenciennes.fr/LAMIH/ e-mail: laurent.dubar@univ-valenciennes.frABSTRACT: The measurement of friction in <strong>the</strong> industrial metal working operations is a complexproblem because <strong>the</strong> friction test must impose at <strong>the</strong> tool/metal interface conditions similar to those in <strong>the</strong>industrial operations. So in <strong>the</strong> European Network VIF (Virtual Intelligent Forging), a workshop (WP3) washeld to evaluate friction condition in cold forging by using numerical simulation and experimental methods. Itwas chosen an industrial cold extrusion operation, in which a low carbon steel bar, covered with phosphatelayer and soap, was drawn, cropped and <strong>the</strong>n formed by extrusion. In or<strong>de</strong>r to know <strong>the</strong> friction condition inthis industrial extrusion operation, four kinds of friction tests, forward extrusion, double-cup extrusion,upsetting-sliding test and T-shape compression were carried out in four labs, IPU, DIMEG, LAMIH andCEMEF, respectively. In a first preliminary step we simulate <strong>the</strong> drawing and extrusion operations in or<strong>de</strong>r toestimate <strong>the</strong> contact conditions in extrusion along <strong>the</strong> container and <strong>the</strong> die surfaces. Then by numericalsimulation we estimate <strong>the</strong> contact conditions in <strong>the</strong> friction tests and <strong>de</strong>fine <strong>the</strong> parameters of <strong>the</strong> tests whichinsure <strong>the</strong> better similarity with <strong>the</strong> industrial operation. In <strong>the</strong> next step experiments will be performed inor<strong>de</strong>r to compare <strong>the</strong> results of <strong>the</strong>se various friction tests.Key words: Friction test, Extrusion, Cold Forging, Low Carbon Steel.1 INTRODUCTIONThe cold forging processes, including extrusion,drawing, upsetting, and heading, have been wi<strong>de</strong>lyused to realize <strong>the</strong> net-shape manufacture in <strong>the</strong>transportation industry. The friction has a largeeffect on <strong>the</strong> cold forging, because it not onlychanges <strong>the</strong> forming force but also <strong>de</strong>termines <strong>the</strong>surface quality of <strong>the</strong> formed part and dies life. Theproblem is especially critical in cold forging of steelwhich induces high contact pressure and new surfacegeneration. So <strong>the</strong> billets are generally coated withzinc phosphate and soap and lubricated with oil toreduce <strong>the</strong> friction during forging [1].For reduction of <strong>the</strong> cost and time of manufacture,almost all of manufacturers and research institutesuse FE simulation to predict <strong>de</strong>fects in <strong>the</strong> forgedpart and optimize <strong>the</strong> die shape. However, it is stilldifficult to choose <strong>the</strong> friction mo<strong>de</strong>l and assign <strong>the</strong>friction coefficient. Therefore, several methods wereinvented to evaluate <strong>the</strong> friction condition duringcold forging, such as ring compression, forwar<strong>de</strong>xtrusion, upsetting-sliding test, spike test, doublecup extrusion and T-shape compression. Studiesillustrated that <strong>the</strong> contact surfaces in ringcompression and spike test are shorn surfaces, whichhaven’t been coated with phosphate/soap layer, sofriction coefficient can not be a<strong>de</strong>quately evaluatedby using <strong>the</strong>m. Forward extrusion and double cupextrusion [2] can induce <strong>the</strong> large contact pressureand new surface generation. Meanwhile, <strong>the</strong> load offorward extrusion and cup height ratio of double cupextrusion are sensitive to friction. In upsettingslidingtest [3] friction coefficient is calculatedstarting from <strong>the</strong> tangential and normal forces of
in<strong>de</strong>nter. T-shape compression, a new friction test,was <strong>de</strong>veloped to evaluate <strong>the</strong> friction condition byusing <strong>the</strong> formed part shape and compression load.So four suitable methods, forward extrusion, doublecupextrusion, upsetting-sliding test and T-shapecompression (see Fig. 1), can be chosen to <strong>de</strong>terminefriction coefficient in cold forging. However, each of<strong>the</strong>m has special features and <strong>the</strong>y haven’t beencompared. In this paper, we investigated <strong>the</strong>ir abilityby FE simulation and evaluated <strong>the</strong> frictioncondition of an industrial cold extrusion process.high pressure condition, if <strong>the</strong> friction coefficient issmall.True stress (MPa)70060050040030020010000.0 0.1 0.2 0.3 0.4 0.5 0.6 0.7 0.8True strainFig. 1 The strain/stress curve of AISI 1010 by uniaxialcompression test (drawn bar with 7.15 mm diameter)3 INDUSTRY COLD EXTRUSION PROCESS(a) Forward extrusion(b) Double-cup extrusion(c) Upsetting-sliding test (d) T-shape compressionFig. 1 Friction tests for cold forging2 MATERIAL PROPERTY AND FRICTIONLAW USED IN SIMULATIONThe material of specimen used in <strong>the</strong> simulation islow carbon AISI 1010 steel in drawn state. Therelationship between strain and stress has beenobtained by uniaxial compression test (Fig.1). Foraccurate simulation, several points on <strong>the</strong>strain/stress curve were chosen to input into <strong>the</strong> FEco<strong>de</strong>, and we assume that <strong>the</strong> stress is constant, forstrain higher than 0.7.There are two important laws, Coulomb and(Tresca) shear stress friction law, which are appliedwi<strong>de</strong>ly to calculate <strong>the</strong> tangential stress betweenspecimen and tool in metal forming processes.Coulomb friction law was used in this work. It isbecause Coulomb friction law can be used in <strong>the</strong>The whole manufacturing system inclu<strong>de</strong>s drawing,cropping and extrusion processes. Cropping processcan induce non-uniform shorn surface of billet andsmall <strong>de</strong>formation of billet, but it is not an importantfactor on friction. Therefore only drawing an<strong>de</strong>xtrusion processes were consi<strong>de</strong>red. That is AISI1010 steel bar with 7.5 mm diameter was drawn to7.15 mm diameter and <strong>the</strong>n extru<strong>de</strong>d to 4.43 mm(extrusion ratio λ =2.6) in a die with a complexshape. The axisymmetrical drawing and extrusionprocess were simulated by using FORGE2005®.According to <strong>the</strong> simulation results, <strong>the</strong> maximumcontact pressure on <strong>the</strong> extrusion die can reach 2500MPa, whereas it is near 850 MPa along <strong>the</strong> container.The equivalent strain in <strong>the</strong> extru<strong>de</strong>d workpiece is 2.4 FRICTION TESTS FOR COLD FORGING4.1 Forward extrusionThe operation is performed by a conical die with29.6 <strong>de</strong>g semi-angle and <strong>the</strong> extrusion ratio λequals to 1.96. The loading curve of forwar<strong>de</strong>xtrusion is sensitive to <strong>the</strong> friction coefficient along<strong>the</strong> die and along <strong>the</strong> container. So <strong>the</strong> force can<strong>de</strong>crease with <strong>de</strong>creasing <strong>the</strong> length of workpiece in<strong>the</strong> container, whereas <strong>the</strong> die region has been filledwith <strong>the</strong> metal. However, usually <strong>the</strong> frictioncoefficients on container and die are consi<strong>de</strong>red asequal <strong>de</strong>spite <strong>the</strong> fact that some factors alongcontainer and die are different such as material,roughness, pressure and lubricant film thickness. For<strong>de</strong>eply investigating <strong>the</strong> friction on <strong>the</strong> extrusion,two different friction coefficients are assigned to
contact pairs of die/workpiece and container/workpiece (See Fig 1 (a)),Fig. 3 shows <strong>the</strong> effect of friction coefficients of dieand container on <strong>the</strong> extrusion loading curves. It isseen that <strong>the</strong> extrusion load changes by assigningdifferent friction coefficient on die and container insimulation. After <strong>the</strong> extrusion experiment, <strong>the</strong>friction coefficient of container can be <strong>de</strong>fined by<strong>the</strong> slope of <strong>the</strong> loading curve and that of die can be<strong>de</strong>fined by <strong>the</strong> maximum load.Load (KN)3530252015105µ = 0.02 µ = 0DieContainerµ = 0.07 µ = 0.0500 2 4 6 8 10 12 14 16 18 20DieContainerµ = 0.02 µ = 0.05DieStroke (mm)Fig. 3 Effect of friction coefficients of die and container on <strong>the</strong>extrusion loading curve4.2 Double-cup extrusionDouble cup extrusion test inclu<strong>de</strong>s four parts: upperpunch, lower punch, container and specimen, asshown in Fig. 1 (b). In <strong>the</strong> test, <strong>the</strong> upper punchmoves down with <strong>the</strong> press ram while <strong>the</strong> lowerpunch and container are stationary [2]. Afterextrusion, a part with two cups was formed. Theheight of upper cup H1 is larger than that of lowercup H2, because <strong>the</strong> container has relative velocitywith respect to <strong>the</strong> upper punch, <strong>the</strong>n <strong>the</strong> frictionforce from container promotes <strong>the</strong> metal flow into<strong>the</strong> upper cup. So <strong>the</strong> ratio of <strong>the</strong> upper cup height to<strong>the</strong> low cup height (H1/H2) was <strong>de</strong>fined as cupheight ratio, which can be used to <strong>de</strong>termine <strong>the</strong>friction coefficient.For <strong>the</strong> studied configuration, <strong>the</strong> ratio of <strong>the</strong>container diameter to <strong>the</strong> punch diameter is 1.66. Asin [2], we verified that <strong>the</strong> friction at <strong>the</strong> punch/billetinterface has no significant influence on H1/H2.Two kinds of material were chosen to simulateeffect of strain har<strong>de</strong>ning on cup height ratio, one isAISI 1010 (see Fig.2) and ano<strong>the</strong>r is AISI 1010without strain har<strong>de</strong>ning. Simulation resultsillustrate <strong>the</strong> material strain har<strong>de</strong>ning reducessignificantly <strong>the</strong> cup height ratio (see Fig.4). It isbecause <strong>the</strong> difference in strain between both metalflows increases with <strong>the</strong> cup height ratio and so <strong>the</strong>strain har<strong>de</strong>ning promotes its reduction. Therefore,Containerin or<strong>de</strong>r to <strong>de</strong>termine <strong>the</strong> friction coefficient bydouble cup extrusion, <strong>the</strong> material property,especially <strong>the</strong> strain/stress relationship, should bewell-known and carefully assigned to FE mo<strong>de</strong>l.H1/H2654321Without strain har<strong>de</strong>ningWith strain har<strong>de</strong>ning00 1 2 3 4 5 6Stroke (mm)Fig.4 Effect of strain har<strong>de</strong>ning on cup height ratio ( µ = 0.05 )4.3 Upsetting-sliding testThe basic methodology of upsetting-sliding test issimilar to <strong>the</strong> sliding in<strong>de</strong>ntation test. However it isspecial to simulate <strong>the</strong> real contact conditions of <strong>the</strong>drawing and extrusion processes [3]. As shown inFig.1 (c), this test inclu<strong>de</strong>s two main components:in<strong>de</strong>nter and specimen. A cylindrical in<strong>de</strong>nter playsa role of drawing or extrusion die, so <strong>the</strong> in<strong>de</strong>nter isma<strong>de</strong> with <strong>the</strong> same material and surface roughnessthan <strong>the</strong> die. The specimen with coating was fixed in<strong>the</strong> special <strong>de</strong>vice. Before test, <strong>the</strong> position ofin<strong>de</strong>nter is adjusted to induce <strong>the</strong> penetration<strong>de</strong>pth p of <strong>the</strong> in<strong>de</strong>nter in <strong>the</strong> specimen. Then <strong>the</strong>in<strong>de</strong>nter moves up with a constant tangential speedand scratches <strong>the</strong> surface of specimen. The forces inboth normal ( Fn) and tangential ( F τ) directions aremeasured with load sensors and recor<strong>de</strong>d in acomputer to evaluate <strong>the</strong> friction condition betweenin<strong>de</strong>nter and specimen [3].In simulation, <strong>the</strong> radius of in<strong>de</strong>nter was 5 mm.Numerical simulation <strong>de</strong>monstrates that for a givenpenetration <strong>de</strong>pth p , <strong>the</strong> force ratio Fτ / Fnincreaseswith <strong>the</strong> friction coefficient µ , but <strong>the</strong> contactpressure and <strong>the</strong> equivalent strain do not changesignificantly. Fig. 5 shows that <strong>the</strong> force ratio and<strong>the</strong> equivalent strain increase with increasing <strong>the</strong>penetration <strong>de</strong>pth. The penetration <strong>de</strong>pth of in<strong>de</strong>nterin experiment can be <strong>de</strong>ci<strong>de</strong>d <strong>de</strong>pending on <strong>the</strong>equivalent strain of extrusion parts. Becauseequivalent strain in industrial extrusion part is 2, <strong>the</strong>penetration <strong>de</strong>pth of in<strong>de</strong>nter should be chosen asp =0.5 mm (see (Fig. 5).
Tangential force / Normal force0.350.300.250.200.150.10Fτ/ Fn3.53.02.52.0Equivalent strain 1.51.00.50.050.00.0 0.1 0.2 0.3 0.4 0.5 0.6 0.7 0.8Penetration <strong>de</strong>pth (mm)Fig. 5 Effects of <strong>the</strong> penetration <strong>de</strong>pth of in<strong>de</strong>nter on <strong>the</strong> forceratio and <strong>the</strong> equivalent strain (µ=0.02, R=5mm)4.4 T-shape compressionT-shape compression, a new method to <strong>de</strong>terminefriction coefficient in cold forging, is <strong>de</strong>veloped. Thedie in this test, is machined as a flat-topped die witha V-shape groove (total angle 20 <strong>de</strong>g, 7 mm <strong>de</strong>pthand 1 mm entry radius) (see Fig. 1 (d)). With <strong>the</strong> flatupper punch moving down some metal of specimenwill be extru<strong>de</strong>d into <strong>the</strong> groove, o<strong>the</strong>rs will becompressed between punch and die. The sectionalshape of formed part in this test looks like ‘T’,suggesting us <strong>the</strong> name: T-shape compression test.The friction force generated between interface ofbillet and V-shape wall can directly change load and<strong>the</strong> length H of <strong>the</strong> extru<strong>de</strong> part.The stroke and load curves with different frictioncoefficient are shown in Fig. 6 (a). Results illustrate<strong>the</strong> load increases when increasing frictioncoefficient and <strong>the</strong> large stroke can improve <strong>the</strong>sensitivity of load to friction coefficient.Load (KN)80604020µ = 0.15µ =0.10µ =0.0500 1 2 3 4 5Stroke (mm)Height of extru<strong>de</strong>d part (mm)3.53.02.52.01.51.00.5Equivalent strainµ=0.05 µ=0.10µ =0.150.00 20 40 60 80Load (KN)(a) Load (b) Height of extrusion partFig. 6 Effects of friction coefficient on load and height ofextrusion partFig. 6 (b) shows effect of friction coefficient on <strong>the</strong>height of extru<strong>de</strong>d part. It is seen that <strong>the</strong> height ofextru<strong>de</strong>d part increases with <strong>de</strong>crease in <strong>the</strong> frictioncoefficient. Therefore, we can <strong>de</strong>termine <strong>the</strong> frictioncondition in <strong>the</strong> T-shape compression by usingcompression load <strong>the</strong> <strong>de</strong>formed part shape.5 DISCUSSION AND CONCLUSIONAccording to simulation of four kinds of frictiontests, testing conditions of <strong>the</strong>m are shown in table 1.Types oftestingForwar<strong>de</strong>xtrusionDouble-cupextrusionUpsettingslidingtestT-shapecompression*IndustryextrusionTable 1 Testing conditions for cold forgingMaximumPressure(MPa)1800 (die)≈500 (cont.)Maximumequivalentstrain1.6 (die)0 (cont.)New surfacegeneration40 % (die)0 (cont.)800 (cont.) 1.9 (cont.) 44 % (cont.)1900 2.6 6.1 %1900 3 50 %2500 (die)850 (cont.)2 (die)0.15 (cont.)61 %0 (cont.)Concerning <strong>the</strong> main features of <strong>the</strong>se tests, <strong>the</strong>friction conditions of die and container in forwar<strong>de</strong>xtrusion may be different, because of differentcontact conditions. We can expect higher friction on<strong>the</strong> die in industry extrusion because contactpressure, equivalent strain and surface generationobtain highest values in die region. For double-cupextrusion material strain har<strong>de</strong>ning has a large effecton <strong>the</strong> cup height ratio and <strong>de</strong>termination of frictioncoefficient. In <strong>the</strong> upsetting-sliding test, <strong>the</strong>penetration <strong>de</strong>pth of in<strong>de</strong>nter can be <strong>de</strong>fined by <strong>the</strong>equivalent strain of extru<strong>de</strong>d part. In <strong>the</strong> T-shapecompression, <strong>the</strong> friction coefficient can be<strong>de</strong>termined by both compression load and shape offormed part. But according to table 1 we can find itis not possible to insure similar contact conditionsfor each test and industry extrusion. So experimentswill <strong>de</strong>monstrate which contact parameters havesignificant influence on friction.ACKNOWLEDGEMENTSThe authors want to thank <strong>the</strong> VIF (VirtualIntelligent Forging - CA) project for financing <strong>the</strong>research of friction condition in forging.REFERENCES1. N. Bay, The state of <strong>the</strong> art in cold forging lubrication. J.Mater. Process. Technol, 46 (1994) 19-402. T. Schra<strong>de</strong>r, M. Shirgaokar, T. Altan. A criticalevaluation of <strong>the</strong> double cup extrusion test for selectionof cold forging lubricants, J. Mater. Process. Technol,189 (2007) 36-443. L. Lazzarotto, L. Dubar, A. Dubois, et. al A selectionmethodology for lubricating oils in cold metal formingprocesses, Wear, 215 (1998) 1-9