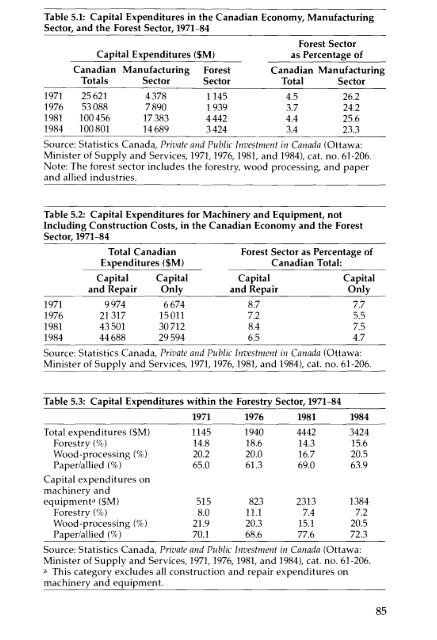
Capital Investments in <strong>the</strong> <strong>Canadian</strong> <strong>Forest</strong>-<strong>Product</strong> <strong>Industries</strong>Historically, capital investment in <strong>the</strong> <strong>Canadian</strong> forest sector has beensubstantial <strong>and</strong> has accounted for an important share of expendituresfor plant <strong>and</strong> equipment in <strong>the</strong> economy as a whole. In 1971, 1976, <strong>and</strong>1981, for example, capital expenditures in <strong>the</strong> forest sector amountedto $1145 million, $1939 million, <strong>and</strong> $4442 million or 4.5 per cent, 3.7 percent, <strong>and</strong> 4.4 per cent respectively of total capital expenditures in <strong>the</strong><strong>Canadian</strong> economy in those years. Even in 1984, a year when capitalexpenditures in <strong>the</strong> forest sector declined, <strong>the</strong>y still accounted for 3.4per cent of <strong>the</strong> total (Table 5.1). In most years <strong>the</strong> forest sectoraccounts for about one-quarter of capital expenditures in <strong>the</strong>manufacturing sector. If construction expenditures are excluded <strong>the</strong>relative importance of <strong>the</strong> forest sector increases by about 4 per centwith respect to capital <strong>and</strong> repair expenditures on machinery <strong>and</strong>equipment <strong>and</strong> about 3 per cent with respect to capital expendituresonly (Table 5.2).Within <strong>the</strong> forest sector <strong>the</strong> paper <strong>and</strong> allied industries accountfor <strong>the</strong> lion's share of capital expenditures (Table 5.3). In <strong>the</strong> peak yearof 1981,for example, paper <strong>and</strong> allied industries accounted for 69.0 percent of total expenditures <strong>and</strong> 77.6 per cent of capital expenditures onmachinery <strong>and</strong> equipment. The wood-processing industries typicallyaccount for about 20 per cent of <strong>Canadian</strong> expenditures whe<strong>the</strong>r totalcapital expenditures or only capital expenditures on machinery <strong>and</strong>equipment are compared. <strong>Forest</strong>ry, however, is relatively more importantwhen total expenditures are compared than when machinery<strong>and</strong> equipment only are compared.In fact, technology in <strong>the</strong> form of plant <strong>and</strong> equipment hasbecome increasingly important during <strong>the</strong> 1970s especially in <strong>the</strong> pulp<strong>and</strong> paper industry. In 1973, for example, about $8.86 billion worth ofcapital was employed in <strong>the</strong> pulp <strong>and</strong> paper industry; in 1983 thisfigure had increased to $36 billion.' Associated with this trend is asharp increase in <strong>the</strong> level of capital intensiveness as measured bycapital employed per employee. As Woodbridge notes, "in 1950, foreach employee, <strong>the</strong> industry invested $22000 of capital. Even asrecently as 1970, this was still around $81000 per employee, in currentdollars. By 1983, capital employed was an estimated $385000 peremployee."3 Similar trends can be seen in <strong>the</strong> forestry <strong>and</strong> in <strong>the</strong>wood-processing industries. This rapid rise in capital intensivenessreflects <strong>the</strong> incorporation of expensive pollution controls, large-scaleproduction units, rising capital costs, <strong>and</strong> <strong>the</strong> rapid development ofnew <strong>and</strong> expensive technology.During <strong>the</strong> 1970s, capital investments grew more in centralCanada than in British Columbia. In 1971, British Columbia, Ontario,84
Table 5.1: Capital Expenditures in <strong>the</strong> <strong>Canadian</strong> Economy, ManufacturingSector, <strong>and</strong> <strong>the</strong> <strong>Forest</strong> Sector, 1971-84Capital Expenditures ($M)<strong>Forest</strong> Sectoras Percentage of<strong>Canadian</strong> Manufacturing <strong>Forest</strong> <strong>Canadian</strong> ManufacturingTotals Sector Sector Total Sector1971 25621 4378 1145 4.5 26.21976 53088 7890 1939 3.7 24.21981 100456 17383 4442 4.4 25.61984 100801 14689 3424 3.4 23.3Source: Statistics Canada, Private <strong>and</strong> Public Investment in Canada (Ottawa:Minister of Supply <strong>and</strong> Services, 1971,1976, 1981, <strong>and</strong> 1984), cat. no. 61-206.Note: The forest sector includes <strong>the</strong> forestry, wood processing, <strong>and</strong> paper<strong>and</strong> allied industries.Table 5.2: Capital Expenditures for Machinery <strong>and</strong> Equipment, notIncluding Construction Costs, in <strong>the</strong> <strong>Canadian</strong> Economy <strong>and</strong> <strong>the</strong> <strong>Forest</strong>Sector, 1971-84Total <strong>Canadian</strong>Expenditures ($M)<strong>Forest</strong> Sector as Percentage of<strong>Canadian</strong> Total:Capital Capital Capital Capital<strong>and</strong> Repair Only <strong>and</strong> Repair Only1971 9974 6674 8.7 7.71976 21317 15011 7.2 5.51981 43501 30712 8.4 7.51984 44688 29594 6.5 4.7Source: Statistics Canada, Private <strong>and</strong> Public Investment in Canada (Ottawa:Minister of Supply <strong>and</strong> Services, 1971,1976,1981, <strong>and</strong> 1984), cat. no. 61-206.Table 5.3: Capital Expenditures within <strong>the</strong> <strong>Forest</strong>ry Sector, 1971-841971 1976 1981 1984Total expenditures ($M) 1145 1940 4442 3424<strong>Forest</strong>ry (%) 14.8 18.6 14.3 15.6Wood-processing (%) 20.2 20.0 16.7 20.5Paper/allied (%) 65.0 61.3 69.0 63.9Capital expenditures onmachinery <strong>and</strong>equipment« ($M) 515 823 2313 1384<strong>Forest</strong>ry (%) 8.0 11.1 7.4 7.2Wood-processing (%) 21.9 20.3 15.1 20.5Paper/allied (%) 70.1 68.6 77.6 72.3Source: Statistics Canada, Private <strong>and</strong> Public Investment in Canada (Ottawa:Minister of Supply <strong>and</strong> Services, 1971,1976, 1981, <strong>and</strong> 1984), cat. no. 61-206.a This category excludes all construction <strong>and</strong> repair expenditures onmachinery <strong>and</strong> equipment.85
- Page 3 and 4:
Science Council of Canada100 Metcal
- Page 5 and 6:
ContentsForewordAcknowledgments1113
- Page 7 and 8:
In-House R&D by Equipment Suppliers
- Page 9 and 10:
Table 2.5: R&D Employment in 10 Can
- Page 11 and 12:
ForewordTechnological innovation an
- Page 14 and 15:
adapted sufficiently rapidly to the
- Page 16 and 17:
Finally, the author interviewed sen
- Page 18 and 19:
Table 1.3: Degree of Foreign Contro
- Page 20 and 21:
Figure 1.1: Innovation Patterns and
- Page 22 and 23:
Since 1945 the pace of technologica
- Page 24 and 25:
Toward Reliance on Research rather
- Page 26 and 27:
science occurred between 1900 and 1
- Page 28 and 29:
Forestry Sector R&D SystemIn Canada
- Page 30 and 31:
up its forestry research group at N
- Page 32 and 33: and one other that was strongly ori
- Page 34 and 35: closely involved in the establishme
- Page 36 and 37: to vet and control research priorit
- Page 38 and 39: In-House R&D by Equipment Suppliers
- Page 40 and 41: product. One, by no means atypical,
- Page 42 and 43: only internal source of dissolving
- Page 44 and 45: of which only 18 per cent came from
- Page 46 and 47: New information can be generated by
- Page 48 and 49: Chapter 3The R&D System andHow It W
- Page 50 and 51: Table 3.2: Summary Characteristics
- Page 52 and 53: Sixteen firms provided details on s
- Page 54 and 55: The Opco Process: A Case Study of I
- Page 56 and 57: however, within the last two decade
- Page 58 and 59: in 1959, and a full-scale experimen
- Page 60 and 61: Papritection was developed as follo
- Page 62 and 63: Further tests were conducted in 198
- Page 64 and 65: fully automatic machines, and its s
- Page 66 and 67: Chapter 4Technological Capability a
- Page 68 and 69: Table 4.2 provides measurements of
- Page 70 and 71: forest-product equipment patents, w
- Page 72 and 73: Foreign-Ownership and In-House R&DT
- Page 74 and 75: Technological Liaisons: Forest-Prod
- Page 76 and 77: for this deficiency the federal gov
- Page 78 and 79: On the other hand, three of the lea
- Page 80 and 81: one of Sweden's forest-products gia
- Page 84 and 85: and Quebec accounted for 33.9 per c
- Page 86 and 87: Table 5.5: Canadian Forest-Product
- Page 88 and 89: Scandinavian manufacturers are in t
- Page 90 and 91: was implemented smoothly and manage
- Page 92 and 93: the foundations were poured, until
- Page 94 and 95: inherent capabilities were never fu
- Page 96 and 97: especially in the east, has receive
- Page 98 and 99: "export staples mentality." The bel
- Page 100 and 101: size of the conglomerates would cer
- Page 102 and 103: the concept of flexibility explicit
- Page 104 and 105: This author therefore recommends th
- Page 106 and 107: with respect to technology transfer
- Page 108 and 109: of the R&D system and influence the
- Page 110 and 111: operations, attitudes toward innova
- Page 112 and 113: limited R&D base, but they do empha
- Page 114 and 115: The small size and non-innovative n
- Page 116 and 117: Promoting In-House R&D in the Fores
- Page 118 and 119: Notes1. The Technological Challenge
- Page 120 and 121: 7. For example, nj. Daly, "Weak Lin
- Page 122 and 123: 7. P.G. Mellgren and E. Heidersdorf
- Page 124 and 125: this R&D facility has become even s
- Page 126 and 127: 3. K. Noble, "Forest Industry Urged
- Page 128 and 129: Publications of the ScienceCouncil
- Page 130 and 131: Reports on Matters Referred by the
- Page 132 and 133:
No. 40. Government Regulation of th
- Page 134 and 135:
1981An Engineer's View of Science E