3B SCIENTIFIC® PHYSICS - American 3B Scientific
3B SCIENTIFIC® PHYSICS - American 3B Scientific
3B SCIENTIFIC® PHYSICS - American 3B Scientific
You also want an ePaper? Increase the reach of your titles
YUMPU automatically turns print PDFs into web optimized ePapers that Google loves.
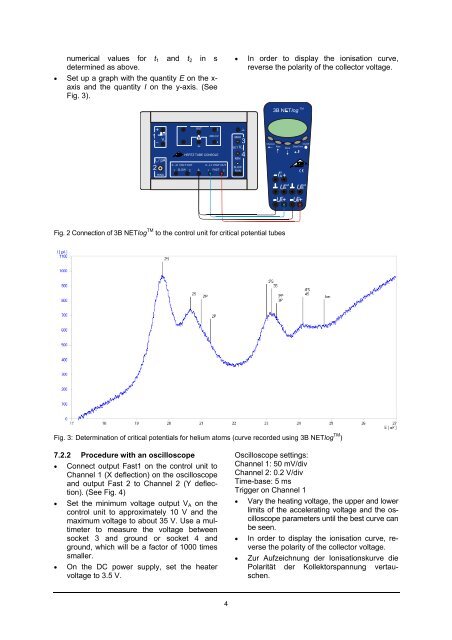
numerical values for t 1 and t 2 in sdetermined as above.• Set up a graph with the quantity E on the x-axis and the quantity I on the y-axis. (SeeFig. 3).• In order to display the ionisation curve,reverse the polarity of the collector voltage.+160V AOUT3200 mV!4HERTZ TUBE CONSOLEMAXSET V AMIN34ChannelRateStoreOn/OffDate/Time0...±1 VOLT OUT 0...±1 VOLT OUTSLOW21 SLOW 2 1 FAST 2 RUNRINGI in A+UAoutUA+inUBoutUB+inFig. 2 Connection of <strong>3B</strong> NETlog TM to the control unit for critical potential tubesFig. 3: Determination of critical potentials for helium atoms (curve recorded using <strong>3B</strong> NETlog TM )7.2.2 Procedure with an oscilloscope• Connect output Fast1 on the control unit toChannel 1 (X deflection) on the oscilloscopeand output Fast 2 to Channel 2 (Y deflection).(See Fig. 4)• Set the minimum voltage output V A on thecontrol unit to approximately 10 V and themaximum voltage to about 35 V. Use a multimeterto measure the voltage betweensocket 3 and ground or socket 4 andground, which will be a factor of 1000 timessmaller.• On the DC power supply, set the heatervoltage to 3.5 V.Oscilloscope settings:Channel 1: 50 mV/divChannel 2: 0.2 V/divTime-base: 5 msTrigger on Channel 1• Vary the heating voltage, the upper and lowerlimits of the accelerating voltage and the oscilloscopeparameters until the best curve canbe seen.• In order to display the ionisation curve, reversethe polarity of the collector voltage.• Zur Aufzeichnung der Ionisationskurve diePolarität der Kollektorspannung vertauschen.4


