Shell energy scenarios to 2050 - Manicore
Shell energy scenarios to 2050 - Manicore
Shell energy scenarios to 2050 - Manicore

You also want an ePaper? Increase the reach of your titles
YUMPU automatically turns print PDFs into web optimized ePapers that Google loves.
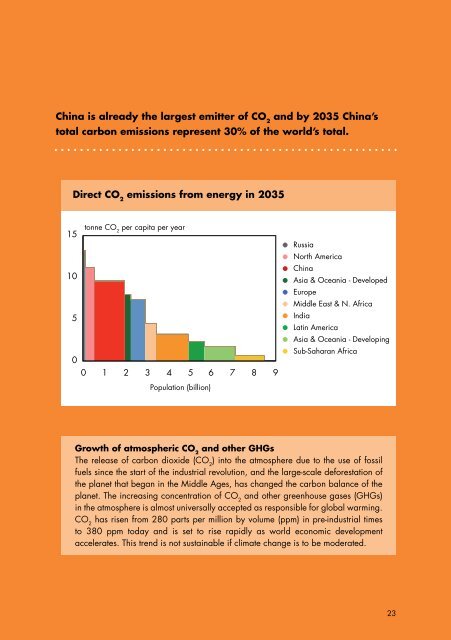
nieuwe grafieken.pdf 28-02-2008 11:32:54China is already the largest emitter of CO 2and by 2035 China’s<strong>to</strong>tal carbon emissions represent 30% of the world’s <strong>to</strong>tal.p23 (key Direct stays CO the 2same) emissions from <strong>energy</strong> in 203515<strong>to</strong>nne CO 2 per capita per year10500 1 2 3 4 5 6 7 8 9Population (billion)RussiaNorth AmericaAsia China& Oceania - DevelopedChina Asia & Oceania - DevelopedEuropeEuropeMiddle East N AfricaMiddle East & N. AfricaIndiaIndiaLatin AmericaLatin AmericaAsia & Oceania - DevelopingSub-SaharanAsia & OceaniaAfrica- DevelopingSub-Saharan Africap29 Note changes incl keyGrowth of atmospheric CO 2and other GHGsThe releaseGJ per capita (primary <strong>energy</strong>)400 of carbon dioxide (CO 2) in<strong>to</strong> the atmosphere due <strong>to</strong> the use of fossilfuels since the start of the industrial revolution, and the large-scale deforestation ofthe planet that began in the Middle Ages, has changed the carbon balance of the300 planet. The increasing concentration of CO 2and other greenhouse gases (GHGs)in the atmosphere is almost universally accepted as responsible USA for global warming.CO 2has risen from 280 parts per million by volume (ppm) Europe in pre-industrial EU 15 times200 <strong>to</strong> 380 ppm <strong>to</strong>day and is set <strong>to</strong> rise rapidly as world economicJapandevelopmentaccelerates. This trend is not sustainable if climate change is <strong>to</strong> be moderated.South Korea100ChinaIndia00 40 80 12023GDP per capita (PPP, '000 2000 USD)