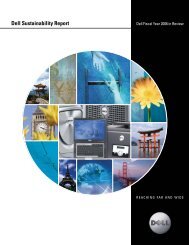
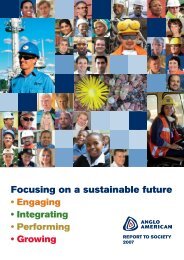
514CLIMATE CHANGECLIMATE CHANGEOur strategy development in 2007 and early 2008 has focusedon the CO2 emissions of our products, because they account<strong>for</strong> the greatest part of GHG emissions associated with ouractivities. Our current and planned ef<strong>for</strong>ts to implement theproduct strategy are outlined below. However, we recognizethat emissions from our facilities are also important. These arediscussed briefly below and in more detail in our Web report.The Web report also addresses the lifecycle emissions of thematerials and processes used to make our products.OperationsSince 2000, we have reduced our global operational energyuse by 30 percent and CO2 emissions from our facilities by39 percent. The U.S. Environmental Protection Agency hasrecognized our energy conservation ef<strong>for</strong>ts three years in arow (a first <strong>for</strong> an automaker), most recently with the 2008Energy Star Sustained Excellence Award.ProductsThe amount of CO2 generated by the light-duty vehicle sector isdependent on three major factors: 1) the fuel economy of thevehicles, which in turn depends on many characteristics of thevehicles themselves (such as their weight, powertrain andtwo seatersminicompact carssubcompact carsCOMPACT CARSaerodynamics); 2) the well-to-wheels 3 greenhouse gas profileof the fuels used in the vehicles; and 3) how the vehicles areused and maintained by their drivers. Our shorthand <strong>for</strong> this,and the organizing framework <strong>for</strong> the discussion that follows,is “Vehicle + Fuel + Driver = GHG emissions.” More recently,we have added government to the equation, recognizing theindispensable role of governments in coordinating actionsacross sectors, providing leadership in areas like infrastructuredevelopment to meet transportation demand and creating aharmonized legal and political framework that leverages market<strong>for</strong>ces to lead to the desired result.VehicleActions to improve the fuel economy of the vehicles we offer arethe most important element of our strategy <strong>for</strong> contributing to agoal of climate stabilization. We have made progress in improvingthe fuel economy of our vehicles, and these improvements willaccelerate as we implement our blueprint <strong>for</strong> sustainability.In the United States, the <strong>Corporate</strong> Average Fuel Economy(CAFE) of our cars and trucks has improved. It increased5.9 percent <strong>for</strong> the 2007 model year, compared to the 2006model year.Figure 310 20 30 40 MILES PER GALLON11iFUEL ECONOMY OF U.S. FORD VEHICLES BY EPA SEGMENTIn<strong>for</strong>mation Top 10factsLanguageglossary10 182523 24 24Question Answer Do Don’t Exclamation12 203218 19 19XDirectionalsignpostCommunityaffairsQuote ContacttelephoneContact fax ContactemailContactaddress12 213216 19 21Internalactivities2218 23 285 Icons5.1 How the icons are used6 Graphs and charts7 The artworks8 Supporting in<strong>for</strong>mation9 Contact details4 Typefaces3 Colour PaletteWhere can I find these icons?If you would like any of these icons or <strong>for</strong> a newicon to be created please contact the Brand team,$CMIG brand enquiry.2 The logo1 Toolkit overviewContents42midsize cars112117 20 2446LARGE Cars111813 18 2225small station wagons15 233120 22 23midsize station wagons14 20 2419 19 19minivans13 182423 24 24suvs10 183214 1932small pickup trucks15 18 2315 18 23standard pickup trucks10 14 1814 16MINindustryAVgMAXvans10 13 17MINFORD FLEETAVgMAX10 20 30 403Emissions resulting from making, distributing and using the fuel.For more in<strong>for</strong>mation visit:www.<strong>for</strong>d.com/go/sustainability
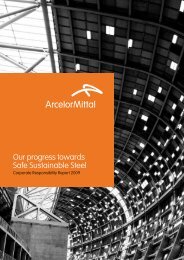
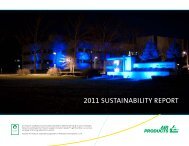
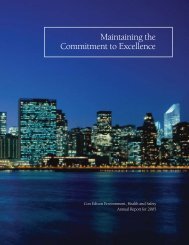
55% FUEL ECONOMY% FUEL ECONOMY25%20%15%10%5%0%50%40%30%20%10%0%WEIGHTREDUCTIONSHORT-TERMIMPROVEMENTSADDITIONALWEIGHTREDUCTIONepas, bms, fastengine warm-up,adfso, nv optdownsizedpowertrainwith gtditechnologyPreliminary data <strong>for</strong> the 2008 model year shows a 0.7 percentimprovement in CAFE compared to 2007, with a 1.3 percentimprovement <strong>for</strong> cars and a 4.0 percent improvement <strong>for</strong> trucks. 5As seen in Figure 3, our U.S. vehicles are generally competitivewith others in the industry in fuel economy, ranking better thanaverage in four of 12 categories, worse in five and the same inthree.Our 2008 North American lineup of fuel-efficient vehicles includesthe 2008 <strong>Ford</strong> Escape Hybrid, Mercury Mariner Hybrid and MazdaTribute Hybrid, which have the highest fuel economy in the SUVclass, and the <strong>Ford</strong> Ranger and Mazda B2300, which are leadersin the small pickup truck class. The <strong>Ford</strong> Taurus and MercurySable have the highest fuel economy <strong>for</strong> an all-wheel-drive largecar, according to the Environmental Protection Agency’s GreenVehicle Guide. The fuel economy of the <strong>Ford</strong> Taurus is 10 percentbetter than its predecessor model, the <strong>Ford</strong> Five Hundred, and the2008 North American <strong>Ford</strong> Focus gets up to 35 miles per gallonon the highway. For the 2009 model year, we will introduce hybridversions of the <strong>Ford</strong> Fusion and Mercury Milan sedans, bringingthe number of hybrid vehicles we offer in North America to five.In Europe, we have reduced the average CO2 emissions of thevehicles we sell by 14 to 33 percent depending on the brand,compared with a 1995 base. We have achieved these reductionsby introducing a variety of innovations, from the advancediX5- to 6-speed+ ascWhere can I find these icons?If you would like any of these icons or <strong>for</strong> a newicon to be created please contact the Brand team,$CMIG brand enquiry.TYPICAL near-TERM FUEL ECONOMY IMPROVEMENTS – midsize utility 4In<strong>for</strong>mation Top 10factsLanguageglossaryQuestion Answer Do Don’t ExclamationiXaERO and parasiticimprovementsAERO TIRE DOWNSIZEDPOWERTRAINTRANSMISSIONEFFICIENCIESASSISTEDDIRECT STARTWITH GTDITECHNOLOGYDirectionalsignpostCommunityaffairsQuote ContacttelephoneContact fax ContactemailContactaddressInternalactivities5 Icons5.1 How the icons are used6 Graphs and charts7 The artworks8 Supporting in<strong>for</strong>mation9 Contact details4 Typefaces3 Colour PaletteWhere can I find these icons?If you would like any of these icons or <strong>for</strong> a newicon to be created please contact the Brand team,$CMIG brand enquiry.TYPICAL MID-TERM FUEL ECONOMY IMPROVEMENTS – SMALL CAR 4In<strong>for</strong>mation Top 10factsLanguageglossaryQuestion Answer Do Don’t ExclamationDirectionalsignpostCommunityaffairsQuote ContacttelephoneContact fax ContactemailContactaddressInternalactivities2 The logo1 Toolkit overviewContentsELECTRICAL/STEERING/DRIVELINEEFFICIENCIESTOTALEFFECTTOTALEFFECTCLIMATE CHANGE 15Figure 4Figure 5common-rail diesel engines available on many of our vehicles tothe use of lightweight materials.Several advanced technologies come together in a new seriesof vehicles launched in Europe beginning in early 2008. The new<strong>Ford</strong> Focus ECOnetic model, <strong>for</strong> example, uses <strong>Ford</strong>’s 1.6-literDuratorq TDCi diesel engine with 109 horsepower and standardDiesel Particulate Filter to achieve class-leading CO2 emissionlevels of just 115 g/km. The <strong>Ford</strong> ECOnetic vehicle portfolio willbe extended in 2008 to include other <strong>Ford</strong> volume sellers: first asub-140 g/km CO2 Mondeo ECOnetic, and then a sub-100 g/kmCO2 model in <strong>Ford</strong>’s all-new Fiesta range.Improvements in the fuel economy of our vehicles will accelerate aswe implement our technology plan, which includes short-, mediumandlong-term actions described on pages 20 to 21. The shorttermactions have been incorporated into our cycle plan, whichspecifies the vehicles we will build in the next five years. We areactively researching and developing the technologies to be used inthe mid to long term, including diesel hybrids and other clean dieseltechnologies; plug-in hybrids; biofueled vehicles; hydrogen internalcombustionengines; hydrogen fuel cell powertrains; and variouscombinations of these technologies, plus weight reductions.Figures 4 and 5 show how we will leverage complementarytechnologies to cut CO2 emissions significantly.INTRODUCTION GOVERNANCE CLIMATE CHANGE MOBILITY HUMAN RIGHTS VEHICLE SAFETY SUSTAINING FORD CONCLUSION4For an explanation of the terms used in these figures, see the glossary on page 20.5The percentage improvement in CAFE <strong>for</strong> cars and trucks combined is lower than the respectivepercentages <strong>for</strong> both cars and trucks primarily because the ratio of trucks to cars manufacturedis projected to increase from 2007 to 2008. Also, the CAFE figure is calculated based on volumeof vehicles manufactured as well as the fuel economy of each individual vehicle.For more in<strong>for</strong>mation visit:www.<strong>for</strong>d.com/go/sustainability