Assessing Climate Change Vulnerability of Breeding Birds in Arctic ...
Assessing Climate Change Vulnerability of Breeding Birds in Arctic ...
Assessing Climate Change Vulnerability of Breeding Birds in Arctic ...

You also want an ePaper? Increase the reach of your titles
YUMPU automatically turns print PDFs into web optimized ePapers that Google loves.
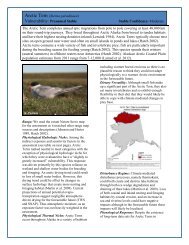
CCVI Modification #1: Temperature Exposure CategoriesThe CCVI tool uses projected changes <strong>in</strong> the magnitude <strong>of</strong> atmospheric temperature and moisture (HamonAET:PET reflect<strong>in</strong>g the <strong>in</strong>teraction <strong>of</strong> precipitation and temperature as the potential for dry<strong>in</strong>g; see Appendix A fordetail) to assess climate exposure for each species. The magnitude <strong>of</strong> change categories <strong>in</strong> the CCVI are based on +/-standard deviations from the average change <strong>in</strong> temperature/moisture projected for the conterm<strong>in</strong>ous United States(i.e., did not <strong>in</strong>clude Alaska). Due to the high magnitude <strong>of</strong> temperature change projected for Alaska, the exposure<strong>in</strong>puts for all species fell <strong>in</strong> the highest magnitude category. Because the CCVI provides <strong>in</strong>formation about relativevulnerability with<strong>in</strong> a specific assessment area (here the BCR3/<strong>Arctic</strong> LCC region), we re-scaled the temperaturecategories to reflect the standard deviations from the average projected change <strong>in</strong> temperature for the state <strong>of</strong> Alaskato <strong>of</strong>fer the potential for some differentiation between species we reviewed.Table 2.3. Summary <strong>of</strong> the multiple climate projections used <strong>in</strong> different runs <strong>of</strong> the CCVI tool to compare<strong>in</strong>fluence on species’ vulnerability <strong>in</strong> the <strong>Arctic</strong> LCC (CW <strong>in</strong>dicates <strong>Climate</strong> Wizard data).EmissionScenarioModel (GCM)1. A1B Temp: SNAP 5-model composite*/Moisture: CW 5-model average (SNAP models)2. A1B Temp: SNAP CCCMA model/Moisture: CW CCCMA model3. A1B Temp: SNAP ECHAM5 model/Moisture: CW 5-model average (SNAP models)4. A1B Temp: SNAP 5-model composite* /Moisture: TWS/SNAP-PET 5-model average5. A2 Temp: SNAP 5-model composite* /Moisture: CW 5-model average (SNAP models)6. A2 Temp: CW 5-model average (SNAP models) /Moisture: CW 5-model average (SNAP models)*Output <strong>of</strong> 5 climate models downscaled to 2 km by SNAP based on performance assessment for north: ECHAM5, GFDL21,MIROC, HAD, CCCMA<strong>Arctic</strong> coastal pla<strong>in</strong> <strong>of</strong> Alaska (Photo: S. Zack @ WCS)14