The FEE Server Control Engine of the ALICE-TRD - Westfälische ...
The FEE Server Control Engine of the ALICE-TRD - Westfälische ...
The FEE Server Control Engine of the ALICE-TRD - Westfälische ...

You also want an ePaper? Increase the reach of your titles
YUMPU automatically turns print PDFs into web optimized ePapers that Google loves.
magnitude<br />
magnitude<br />
magnitude<br />
0<br />
-10<br />
-20<br />
-30<br />
-40<br />
-50<br />
-60<br />
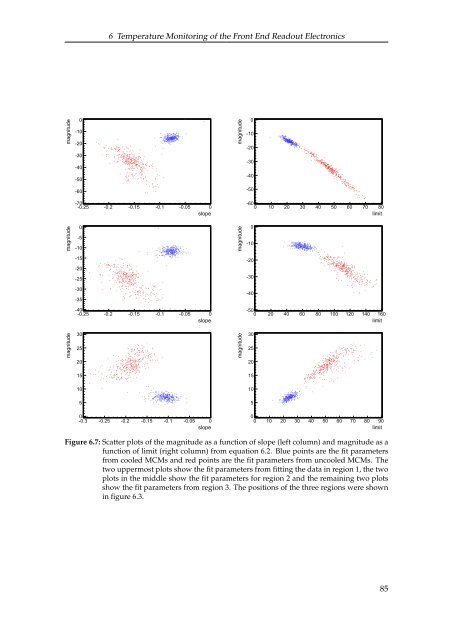
6 Temperature Monitoring <strong>of</strong> <strong>the</strong> Front End Readout Electronics<br />
-70<br />
-0.25 -0.2 -0.15 -0.1 -0.05 0<br />
slope<br />
0<br />
-5<br />
-10<br />
-15<br />
-20<br />
-25<br />
-30<br />
-35<br />
-40<br />
-0.25 -0.2 -0.15 -0.1 -0.05 0<br />
slope<br />
30<br />
25<br />
20<br />
15<br />
10<br />
5<br />
0<br />
-0.3 -0.25 -0.2 -0.15 -0.1 -0.05 0<br />
slope<br />
magnitude<br />
magnitude<br />
magnitude<br />
0<br />
-10<br />
-20<br />
-30<br />
-40<br />
-50<br />
-60<br />
0 10 20 30 40 50 60 70 80<br />
limit<br />
0<br />
-10<br />
-20<br />
-30<br />
-40<br />
-50<br />
0 20 40 60 80 100 120 140 160<br />
limit<br />
30<br />
25<br />
20<br />
15<br />
10<br />
5<br />
0<br />
0 10 20 30 40 50 60 70 80 90<br />
limit<br />
Figure 6.7: Scatter plots <strong>of</strong> <strong>the</strong> magnitude as a function <strong>of</strong> slope (left column) and magnitude as a<br />
function <strong>of</strong> limit (right column) from equation 6.2. Blue points are <strong>the</strong> fit parameters<br />
from cooled MCMs and red points are <strong>the</strong> fit parameters from uncooled MCMs. <strong>The</strong><br />
two uppermost plots show <strong>the</strong> fit parameters from fitting <strong>the</strong> data in region 1, <strong>the</strong> two<br />
plots in <strong>the</strong> middle show <strong>the</strong> fit parameters for region 2 and <strong>the</strong> remaining two plots<br />
show <strong>the</strong> fit parameters from region 3. <strong>The</strong> positions <strong>of</strong> <strong>the</strong> three regions were shown<br />
in figure 6.3.<br />
85