The FEE Server Control Engine of the ALICE-TRD - Westfälische ...
The FEE Server Control Engine of the ALICE-TRD - Westfälische ...
The FEE Server Control Engine of the ALICE-TRD - Westfälische ...

You also want an ePaper? Increase the reach of your titles
YUMPU automatically turns print PDFs into web optimized ePapers that Google loves.
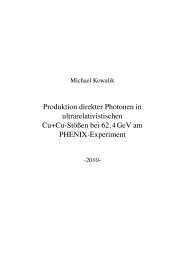
ADC value / scaled IR temperature (a.u.)<br />
140<br />
120<br />
100<br />
80<br />
60<br />
40<br />
20<br />
0<br />
6 Temperature Monitoring <strong>of</strong> <strong>the</strong> Front End Readout Electronics<br />
0 10 20 30 40 50 60<br />
time (min)<br />
Figure 6.13: <strong>The</strong> red curve shows <strong>the</strong> averaged MCM temperature sensor readings <strong>of</strong> a complete<br />
chamber. <strong>The</strong> corresponding error bars are plotted in orange. Before averaging <strong>the</strong><br />
first value <strong>of</strong> all MCMs were set to zero and and only <strong>the</strong> differences between <strong>the</strong><br />
first value and <strong>the</strong> current value <strong>of</strong> each MCM were averaged. <strong>The</strong> gray curves are<br />
<strong>the</strong> MCM temperature sensor readings <strong>of</strong> <strong>the</strong> MCMs with <strong>the</strong> highest and lowest<br />
changes. <strong>The</strong> black, blue and red lines / points are <strong>the</strong> scaled surface temperatures<br />
showed in plot 6.11.<br />
MCM curve fit parameter value (°C) uncertainty<br />
(°C)<br />
high a 6.9 ±0.51<br />
high b -196 ±19<br />
averaged a 7.5 ±0.45<br />
averaged b -207 ±17<br />
low a 5.9 ±1.2<br />
low b -173 ±45<br />
90<br />
Table 6.2: IR temperature scaling factors