Building Competitiveness and Business Performance with ICT
Building Competitiveness and Business Performance with ICT
Building Competitiveness and Business Performance with ICT
- No tags were found...

You also want an ePaper? Increase the reach of your titles
YUMPU automatically turns print PDFs into web optimized ePapers that Google loves.
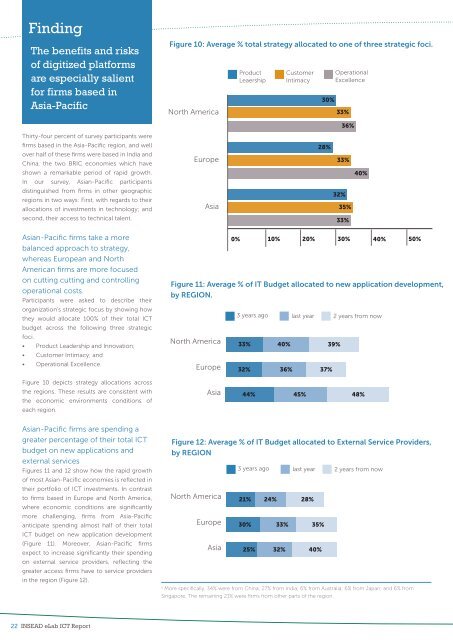
FindingThe benefits <strong>and</strong> risksof digitized platformsare especially salientfor firms based inAsia-PacificFigure 10: Average % total strategy allocated to one of three strategic foci.North AmericaProductLeaershipCustomerIntimacy30%OperationalExcellence33%36%Thirty-four percent of survey participants werefirms based in the Asia-Pacific region, <strong>and</strong> wellover half of these firms were based in India <strong>and</strong>China, the two BRIC economies which haveEurope28%33%shown a remarkable period of rapid growth.40%In our survey, Asian-Pacific participantsdistinguished from firms in other geographicregions in two ways: First, <strong>with</strong> regards to theirallocations of investments in technology; <strong>and</strong>Asia32%35%second, their access to technical talent.33%Asian-Pacific firms take a morebalanced approach to strategy,whereas European <strong>and</strong> NorthAmerican firms are more focusedon cutting cutting <strong>and</strong> controllingoperational costs.Participants were asked to describe theirorganization’s strategic focus by showing howthey would allocate 100% of their total <strong>ICT</strong>budget across the following three strategicfoci.• Product Leadership <strong>and</strong> Innovation;• Customer Intimacy; <strong>and</strong>• Operational Excellence.Figure 11: Average % of IT Budget allocated to new application development,by REGION.North America 33%Europe0% 10% 20% 30% 40% 50%3 years ago last year 2 years from now32%40%36%37%39%Figure 10 depicts strategy allocations acrossthe regions. These results are consistent <strong>with</strong>the economic environments conditions ofeach region.Asia44% 45% 48%Asian-Pacific firms are spending agreater percentage of their total <strong>ICT</strong>budget on new applications <strong>and</strong>external servicesFigures 11 <strong>and</strong> 12 show how the rapid growthof most Asian-Pacific economies is reflected intheir portfolio of <strong>ICT</strong> investments. In contrastto firms based in Europe <strong>and</strong> North America,where economic conditions are significantlymore challenging, firms from Asia-Pacificanticipate spending almost half of their total<strong>ICT</strong> budget on new application development(Figure 11). Moreover, Asian-Pacific firmsexpect to increase significantly their spendingon external service providers, reflecting thegreater access firms have to service providersin the region (Figure 12).Figure 12: Average % of IT Budget allocated to External Service Providers,by REGIONNorth America 21%EuropeAsia3 years ago last year 2 years from now30%24%33%28%35%25% 32% 40%6More specifically, 34% were from China; 27% from India; 6% from Australia; 6% from Japan; <strong>and</strong> 6% fromSingapore. The remaining 21% were firms from other parts of the region.22 INSEAD eLab <strong>ICT</strong> Report