
You also want an ePaper? Increase the reach of your titles
YUMPU automatically turns print PDFs into web optimized ePapers that Google loves.
<strong>ARL</strong> <strong>Annual</strong> <strong>Salary</strong> <strong>Survey</strong> is published byAssociation of Research Libraries21 Dupont Circle, NW, Suite 800Washington, D.C. 20036Telephone: (202) 296-2296FAX: (202) 872-0884email: pubs@arl.orgPrice:<strong>ARL</strong> members $39/year, plus $6 shipping and handlingNonmembers $79/year, plus $6 shipping and handlingCustom reports based on the <strong>Salary</strong> <strong>Survey</strong> data are also available. Contact the <strong>ARL</strong>Statistics and Measurement Program Officer for further information.The quantitative rank order tables presented in this publication are not indicative ofperformance and outcomes and should not be used as measures of library quality.In comparing any individual library to <strong>ARL</strong> medians or to other <strong>ARL</strong> members, onemust be careful to make such comparisons within the context of differing institutionaland local goals and characteristics.Visit the <strong>ARL</strong> Statistics and Measurement Program online at .ISSN 0361-5669© Copyright NoticeThe compilation is copyrighted by the Association of Research Libraries. Blanket permission is granted to reproduceand distribute copies of this work for nonprofit, educationaC or library purposes, provided that the author, source,and copyright notice are included on each copy, This permission is in addition to rights of reproduction grantedunder Sections 107, 108, and other provisions of the U.s. Copyright Act.The paper used in this publication meets the minimum requirements of American National Standard forInformation Sciences-Permanence of Paper for Printed Library Materials, ANSI 239.48-1992.Printed in the United States of America
TABLE OF CONTENTSINTRODUCTION ...................................................................................................................................................................... 11PageSALARY LEVELS FOR STAFF IN <strong>ARL</strong> LIBRARIESTable 1: Distribution by <strong>Salary</strong> Level .................................................................................................................... 25Table 2: <strong>Salary</strong> Trends in <strong>ARL</strong> University Libraries ........................................................................................... 26Table 3: <strong>Salary</strong> Trends in U.S. <strong>ARL</strong> University Libraries .................................................................................. 27Table 4: <strong>Salary</strong> Trends in Canadian <strong>ARL</strong> University Libraries ........................................................................ 28<strong>ARL</strong> NONUNIVERSITY LIBRARIESTable 5: Median and Beginning Professional Salaries in <strong>ARL</strong> Nonuniversity Libraries ............................. 30Table 6: <strong>Salary</strong> Trends in <strong>ARL</strong> Nonuniversity Libraries ................................................................................... 31<strong>ARL</strong> UNIVERSITY LIBRARIESTable 7:Table 8:Table 9:Table 10:Table 11:Table 12:Table 13:Table 14:Table 15:Filled Positions; Average, Median, Beginning Professional Salaries; andAverage Years of Experience in <strong>ARL</strong> University Libraries, FY <strong>1999</strong>-<strong>2000</strong> ..................................... 34Begimung Professional Salaries in <strong>ARL</strong> University Libraries;Rank Order Table, FY 1998-99 ................................................................................................................. 36BegimUng Professional Salaries in <strong>ARL</strong> University Libraries;Rank Order Table, FY <strong>1999</strong>-<strong>2000</strong> ............................................................................................................ 37Median Professional Salaries in <strong>ARL</strong> University Libraries;Rank Order Table, FY 1998-99 ................................................................................................................. 38Median Professional Salaries in <strong>ARL</strong> University Libraries;Rank Order Table, FY <strong>1999</strong>-<strong>2000</strong> ............................................................................................................ 39Average Professional Salaries in <strong>ARL</strong> University Libraries;Rank Order Table, FY 1998-99 ................................................................................................................ 40Average Professional Salaries in <strong>ARL</strong> University Libraries;Rank Order Table, FY <strong>1999</strong>-<strong>2000</strong> ............................................................................................................ 41Average, Median, and Beginning Professional Salaries in <strong>ARL</strong> UniversityLibraries; Surmnary of Rankings, FYs 1996-97 to <strong>1999</strong>-<strong>2000</strong> ............................................................ 42Distribution of Professional Staff in <strong>ARL</strong> University Librariesby <strong>Salary</strong> and Position, FY <strong>1999</strong>-<strong>2000</strong> .................................................................................................... 465
Table 16:Table 17:Table 18:Table 19:Table 20:Table 21:Table 22:Table 23:Table 24:Table 25:Distribution of Professional Staff in <strong>ARL</strong> University Librariesby <strong>Salary</strong>, Sex, and Position, FY <strong>1999</strong>-<strong>2000</strong> ........................................................................................... 47Number and Average Salaries of <strong>ARL</strong> University Librariansby Position and Sex, FY <strong>1999</strong>-<strong>2000</strong> ......................................................................................................... 48Number and Average Years of Experience of <strong>ARL</strong> University Librariansby Position and Sex, FY <strong>1999</strong>-<strong>2000</strong> ......................................................................................................... 49Number and Average Salaries of <strong>ARL</strong> University Librariansby Years of Experience and Sex, FY <strong>1999</strong>-<strong>2000</strong> .................................................................................... 50Average Salaries of <strong>ARL</strong> University Librariansby Position and Years of Experience, FY <strong>1999</strong>-<strong>2000</strong> ............................................................................ 51Number and Average Salaries of <strong>ARL</strong> University Librariansby Position and Type of Institution, FY <strong>1999</strong>-<strong>2000</strong> ............................................................................. 52Years of Experience of <strong>ARL</strong> University Librariansby Position and Type of h1stitution, FY <strong>1999</strong>-<strong>2000</strong> ............................................................................. 53Number and Average Salaries of <strong>ARL</strong> University Librariansby Position and Size of Professional Staff, FY <strong>1999</strong>-<strong>2000</strong> ................................................................... 54Years of Experience of <strong>ARL</strong> University Librariansby Position and Size of Professional Staff, FY <strong>1999</strong>-<strong>2000</strong> ................................................................... 55Average Salaries of <strong>ARL</strong> University Librariansby Position and Geographic Region, FY <strong>1999</strong>-<strong>2000</strong> ............................................................................ 56<strong>ARL</strong> University Libraries by Geographic Region ................................................................................ 57U.S. <strong>ARL</strong> UNIVERSITY LIBRARIESTable 26:Table 27:Table 28:Table 29:Table 30:Average Salaries of U.S. <strong>ARL</strong> University Librariansby Position and Years of Experience, FY <strong>1999</strong>-<strong>2000</strong> ............................................................................ 61Number and Average Salaries of Minority U.S. <strong>ARL</strong> University Librariansby Position and Sex, FY <strong>1999</strong>-<strong>2000</strong> ......................................................................................................... 62Number and Average Years of Experience of Minority U.S. <strong>ARL</strong> UniversityLibrarians by Position and Sex, FY <strong>1999</strong>-<strong>2000</strong> ..................................................................................... 63Number and Average Salaries of U.S. <strong>ARL</strong> University Librariansby Years of Experience and Sex, FY <strong>1999</strong>-<strong>2000</strong> .................................................................................... 64Number and Average Salaries of Minority U.S. <strong>ARL</strong> University Librariansby Years of Experience and Sex, FY <strong>1999</strong>-<strong>2000</strong> .................................................................................... 64CANADIAN <strong>ARL</strong> UNIVERSITY LIBRARIESTable 31:Table 32:Table 33:Filled Positions; Average, Median, and Beginning Professional Salaries; and AverageYears of Professional Experience in Canadian <strong>ARL</strong> University Libraries, FY <strong>1999</strong>-<strong>2000</strong> ............ 69Number and Average Salaries of Canadian <strong>ARL</strong> UniversityLibrarians by Position and Sex, FY <strong>1999</strong>-<strong>2000</strong> ..................................................................................... 70Number and Average Years of Experience of Canadian <strong>ARL</strong>University Librarians by Position and Sex, FY <strong>1999</strong>-<strong>2000</strong> ................................................................. 716
Table 34:Number and Average Salaries of Canadian <strong>ARL</strong> University Librariansby Years of Experience and Sex, FY <strong>1999</strong>-<strong>2000</strong> .................................................................................... 72<strong>ARL</strong> UNIVERSITY MEDICAL LIBRARIESTable 35:Table 36:Table 37:Table 38:Table 39:Table 40:Table 41:Filled Positions; Average, Median, Beginning Professional Salaries; and AverageYears of Professional Experience in <strong>ARL</strong> University Medical Libraries, FY <strong>1999</strong>-<strong>2000</strong> ............... 74Beginning Professional Salaries in <strong>ARL</strong> University Medical Libraries;Rank Order Table, FY <strong>1999</strong>-<strong>2000</strong> ............................................................................................................ 76Median Professional Salaries in <strong>ARL</strong> University Medical Libraries;Rank Order Table, FY <strong>1999</strong>-<strong>2000</strong> ............................................................................................................ 77Average Professional Salaries in <strong>ARL</strong> University Medical Libraries;Rank Order Table, FY <strong>1999</strong>-<strong>2000</strong> ............................................................................................................ 78Number and Average Salaries of <strong>ARL</strong> University Medical Librariansby Position and Sex, FY <strong>1999</strong>-<strong>2000</strong> ......................................................................................................... 79Number and Average Years of Experience of <strong>ARL</strong> University Medical Librariansby Position and Sex, FY <strong>1999</strong>-<strong>2000</strong> ......................................................................................................... 80Number and Average Salaries of <strong>ARL</strong> University Medical Librariansby Years of Experience and Sex, FY <strong>1999</strong>-<strong>2000</strong> .................................................................................... 81<strong>ARL</strong> UNIVERSITY LAW LIBRARIESTable 42:Table 43:Table 44:Table 45:Table 46:Table 47:Table 48:Filled Positions; Average, Median, Beginning Professional Salaries; and AverageYears of Experience in <strong>ARL</strong> University Law Libraries, FY <strong>1999</strong>-<strong>2000</strong> ............................................ 84Beginning Professional Salaries in <strong>ARL</strong> University Law Libraries;Rank Order Table, FY <strong>1999</strong>-<strong>2000</strong> ............................................................................................................ 86Median Professional Salaries in <strong>ARL</strong> University Law Libraries;Rank Order Table, FY <strong>1999</strong>-<strong>2000</strong> ............................................................................................................ 87Average Professional Salaries in <strong>ARL</strong> University Law Libraries;Rank Order Table, FY <strong>1999</strong>-<strong>2000</strong> ............................................................................................................ 88Number and Average Salaries of <strong>ARL</strong> University Law Librariansby Position and Sex, FY <strong>1999</strong>-<strong>2000</strong> ......................................................................................................... 89Number and Average Years of Experience of <strong>ARL</strong> University Law Librariansby Position and Sex, FY <strong>1999</strong>-<strong>2000</strong> ......................................................................................................... 90Number and Average Salaries of <strong>ARL</strong> University Law Librariansby Years of Experience and Sex, FY <strong>1999</strong>-<strong>2000</strong> .................................................................................... 91<strong>ARL</strong> ANNUAL SALARY SURVEY <strong>1999</strong>-<strong>2000</strong>University Library Questiormaire and Instructions ...................................................................................................... 95Nonuniversity Library Questiormaire and Instructions ............................................................................................. 109FOOTNOTES ............................................................................................................................................................................. 1137
APPENDIX A: <strong>ARL</strong> MEMBER LIBRARIES ....................................................................................................................... 123APPENDIX B: TABLE NUMBERING CHANGES FOR <strong>1999</strong>-<strong>2000</strong> .............................................................................. 1258
INTRODUCTION
INTRODUCTIONThe <strong>ARL</strong> <strong>Annual</strong> <strong>Salary</strong> <strong>Survey</strong> <strong>1999</strong>-<strong>2000</strong> reports salary data for all professionalstaff working in <strong>ARL</strong> libraries. The Association of Research Libraries (<strong>ARL</strong>) representsthe interests of 121 libraries that serve major North American research institutions. 1The Association operates as a forum for the exchange of ideas and as an agent forcollective action to influence forces affecting the ability of these libraries to meet thefuture needs of scholarship. The <strong>ARL</strong> Statistics and Measurement program, whichproduces the salary survey, is organized around collecting, analyzing, and distributingquantifiable information describing the characteristics of research libraries. The <strong>ARL</strong><strong>Annual</strong> <strong>Salary</strong> <strong>Survey</strong> is the most comprehensive and thorough guide to current salariesin large U.S. and Canadian academic and research libraries, and is a valuablemanagement and research tool.Data for 8,595 professional staff members were reported this year for the 111<strong>ARL</strong> university libraries, including their law and medical libraries (814 staff membersreported by 69 medical libraries and 660 staff members reported by 72 law libraries).For the 10 nonuniversity <strong>ARL</strong> members, data were reported for 3,737 professional staffmembers.This year's publication has been re-organized to include four new tables andprovide a separate U.S. section. All the tables published in prior years are alsoincluded, but some renumbering had to be done to accommodate the addition of fournew tables. A detailed appendix mapping this year's table-numbering scheme inrelation to last year's is included at the end of the book.The tables are organized in seven major sections. The first section includesTables 1 through 4 which report salary figures for all professionals working in <strong>ARL</strong>member libraries, including law and medical library data. The second section includessalary information for the 10 nonuniversity research libraries of <strong>ARL</strong>. The third section,entitled" <strong>ARL</strong> University Libraries" reports data in Tables 7 through 25 for the"general" library system of the university <strong>ARL</strong> members, combining U.s. and Canadiandata but excluding law and medical data. The fourth section, composed of Tables 26through 30, reports data on U.S. <strong>ARL</strong> university library members excluding law andmedical data; the fifth section, Tables 31-34, reports data on Canadian <strong>ARL</strong> universitylibraries in Canadian dollars excluding law and medical data. The sixth section, Tables35-41, reports data on medical libraries, and the seventh section, Tables 42-48, reportson law libraries combining U.S. and Canadian data.1 George Washington University became an ARt member in 1998 and this year, its salaty survey data are included in thepublication for the first time. Linda Hall is not a member of <strong>ARL</strong>, as of <strong>2000</strong>, and is not included in this year's publication.11
The university population is generally treated in three distinct groups: staff inthe" general" library system, staff in the university medical libraries, and staff in theuniversity law libraries. All branch libraries for which data were received, other thanlaw and medical, are included in the" general" category, whether or not those librariesare administratively independent. Footnotes for many institutions provide informationon branch inclusion or exclusion.Most tables show Canadian salaries converted into U.s. dollar equivalents at therate of 1.5103 Canadian dollars per U.S. dollar. 2 Tables 4, and 31 through 34, however,pertain exclusively to staff in Canadian university libraries, so salary data in thosetables are expressed in Canadian dollars.RACE AND ETHNIClTYThere were 893 minority professional staff reported in 98 U.s. <strong>ARL</strong> universitylibraries, including law and medical - 39 more than last year,3 the largest increase inthe number of minority professionals in recent years. Note that the data for minorityprofessionals comes only from the U.S. <strong>ARL</strong> university libraries following the EqualEmployment Opportunity Commission (EEOC) definitions; Canadian law prohibits theidentification of Canadians by ethnic category.The Office of Management and Budget has revised the Standards for theClassification of Federal Data on Race and Ethnicity4 and according to the new standardthere will be five minimum categories for data on race (American Indian or AlaskaNative, Asian, Black or African American, Native Hawaiian or Other Pacific Islander,and White) and two categories for data on ethnicity ("Hispanic or Latino" and "NotHispanic or Latino"). Respondents will be able to report more than one race bychoosing multiple categories in response to the race question; repondents also will beable to choose the ethnicity category "Hispanic or Latino" and choose one or more racecategories. The new standards will be used by the Bureau of the Census in the <strong>2000</strong>decennial census. Other Federal programs will adopt the standards as soon as possible,but not later than 1 January 2003, for use in household surveys, administrative formsand records, and other data collections. In light of these developments, the <strong>ARL</strong> <strong>Annual</strong><strong>Salary</strong> <strong>Survey</strong> collected optional data based on these new definitions for the first timethis year.2 This is the average monthly noon exchange rate published in the Bank of Canada Review for the period July 1998-June <strong>1999</strong>.3 Tcn ofthcsc 39 arc from the new <strong>ARL</strong> member library.4 12
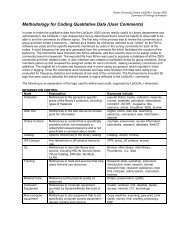
Seventy-one libraries provided complete or partial data on the new optionalcategories regarding race and ethnicity, reporting data for a total of 4,202 professionals.Only 47 out of the 4,202 professionals (1 %) selected multiple race/ ethnicity categories,half of which (21 professionals) were in the combined category of White Hispanic.Currently, minority staff make up 11.4% of the professional staff in U.S. <strong>ARL</strong>university libraries (including law and medical). The number of minorities inmanagerial or administrative positions in the largest U.s. academic libraries is evenlower: 5.1% are directors (5 out of 98),6.5% are associate or assistant directors (23 out of354), and 10.5% are branch librarians (50 out of 475). The overall racial/ ethnicdistribution of professional staff in U.s. <strong>ARL</strong> university libraries is: Caucasian/Other88.6%, Asian/Pacific Islander 5%, Black 4.1 %, Hispanic 2.1 %, and AmericanIndian/Native Alaskan .2% (see Graph 1). Recent race and ethnicity data from theAmerican Library Association (ALA) on academic libraries show that the sample ofacademic libraries surveyed by ALA has a higher representation of Blacks,Asian/Pacific Islanders, and American Indian/ Alaskan Native than <strong>ARL</strong> libraries. 5<strong>ARL</strong> U.S. university libraries have a lower proportion of Asians/Pacific Islanders(.5 less) but more Blacks (.4) and Hispanics (.3) compared to last year. Wilder had notedthat <strong>ARL</strong> professionals of Asian ethnic background are likely to be reduced in numbersover the coming years because of retirements, as they tend to be older than theircolleagues of other ethnicities. 6 Graph 1Ethnicity/Race of Professional Staff in U.S. <strong>ARL</strong> University Libraries, <strong>1999</strong>~<strong>2000</strong>Asian or Pacific Islander5%Black4.1%Hispanic2.1%American Indian INativeAlaskan.2%Caucasian or Other88.6%5 Mary )0 Lynch, "Librarians' Salaries Smaller Increases This Year," American Libraries (November 1998): 68,
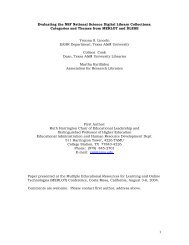
Minority professional staff in U.S. <strong>ARL</strong> university libraries continues to bedisproportionately distributed across the country. In Figure 1, we can compare thenumber of minority staff with other staff, region by region. These patterns ofdistribution have been relatively stable for the entire history of <strong>ARL</strong>'s data-collectionexperience. Minorities are underrepresented in the East South Central, New England,West North Central, West South Central, Mountain, and East North Central regions (seeTable 25 for a definition of the regions). Proportionately to other regions, there aremore minorities in the Pacific, South Atlantic, and Middle Atlantic areas.Figure 1MINORITY PROFESSIONALS BY REGION (U.S.)IN <strong>ARL</strong> UNIVERSITY LIBRARIES, FY <strong>1999</strong>-<strong>2000</strong>RacefEthnicityCategoryNew Middle E North WNorth South East S WestSE~and Atlantic Central Central Atlantic Central Central Mountain Pacific TOTAL11/0Black 20 55 52 24 102 16 18 7 27 321Hispanic 16 22 18 5 26 1 21 19 36 164Asian 42 77 71 13 53 3 25 17 94 395AI(NA7 2 4 2 2 3 13Minority Total 78 156 145 44 181 20 64 45 160 893Regional Percent of 8.73% 17.47% 16.24% 4.93% 20.27% 2.24% 7.17% 5.04% 17.92% 100.00%Minority Total35.95%18.37%44.23%1.46%100.00%11.4%Nonminority Total 902 1,092 1.242 486 1,150 308 538 406 841 6,965Regional Percent of 12.95% 15.68% 17.83% 6.98% 16.51 % 4.42% 7.72% 5.83% 12.07% 100.00%Nonminority TotalRegional Percent 12.47% 15.88% 17.65% 6.74% 16.94% 4.17% 7.66% 5.74% 12.74% 100.00%Total staff88.6%100.00%ProportionalMinorityRepresentation -32.55% 11.42% -8.94% -29.39% 22.76% -49.35% -7.22% -13.55% 48.39%<strong>ARL</strong> recognizes the difficulties that the profession has in attracting a diverseworkforce and continues to work actively in the development of workplace climatesthat embrace diversity. The <strong>ARL</strong> Diversity Program focuses on issues surroundingwork relationships in libraries while considering the impact of diversity on libraryservices, interactions with library users, and the development of collections.s7 American Indian/Native Alaska.8 For morc information on the <strong>ARL</strong> Diversity Program see
Women comprise 71.56% of staff in the four racial/ ethnic groups that compriseminority staff, as compared to 63.76% of Caucasian/Other staff in all U.s. <strong>ARL</strong>university libraries. The overall gender balancein the 111 Canadian and U.s. universitylibraries (including law and medical) is 35.35% male and 64.65% female. See Figure 1,above, and Figure 2, below, for more detail on race/ ethnic and gender distribution.Figure 2RACF/ETHNICITY AND SEX DISTRIBUTION OF PROFESSIONAL STAFFIN <strong>ARL</strong> UNIVERSITY LIBRARIES FY <strong>1999</strong>-<strong>2000</strong>United StatesMainMedicalLawMinority9Non~minorityAllMainMedicalLawAllMainMedicalLawAllMenWomenNumbel'of Percent of Number of Percent ofStaff Total Staff Total2,388 36.84% 4,094 63.16%188 25.20% 558 74.80%202 32.06% 428 67.94%254 28.44% 639 71.56%2,524 36.24% 4,441 63.76%2,778 35.35% 5,080 64.65%CanadaMenWomenNumber of Percent of Number of Percent ofStaff Total Staff Total213 33.33% 426 66.67%11 16.18% 57 83.82%13 43.33% 17 56.67%237 32.16% 500 67.84%United States and Canada (Combined)MenWomenNumber of Percent of Number of Percent ofStaff Total Staff Total2,601 36.53% 4,520 63.47%199 24.45% 615 75.55%215 32.58% 445 67.42%3,015 35.08% 5,580 64.92%Total6,4827466308936,9657,858Total6396830737Total7,1218146608,5959 Includes staff in medical and law libraries.15
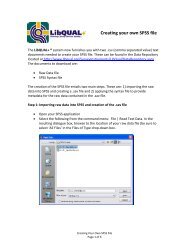
GENDER DATAMany readers of previous surveys have inquired about evidence of gender-basedsalary differentials in <strong>ARL</strong> libraries. Data on salary comparisons for directors also arefrequently requested. It is perhaps noteworthy that the average salary for femaledirectors in university libraries is slightly higher than the average salary for maledirectors (see Table 17) for the fourth consecutive year. Many new hires have occurredin the last few years, contributing to the largest number of women in the topadministrative library position (54 women directors out of 111 total directorshipsreported this year) and higher salaries for women directors of <strong>ARL</strong> libraries.Looking at other job categories, though, as Table 17 demonstrates, averagesalaries for men in most cases still surpass those of women in the same job category.For nine categories (of the 27 used in the tables) do average salaries of women exceedthose of men. Moreover, the overall salary for women is still only 94% that of men forthe 111 <strong>ARL</strong> university libraries (93 % for 98 <strong>ARL</strong> university libraries reporting datathroughout the salary survey history). Table 18 provides average years of professionalexperience for many of the same staffing categories for which salary data are shown inTable 17. An inspection of data in Table 18 reveals that experience differentials betweenmen and women cannot account fully for all of the salary differentials evident in Table17. Table 19 further reveals that the average salary for men is consistently higher thanthe average salary for women in everyone of the experience cohorts. This pattern isalso repeated for minority librarians: the average salary for minority men is higher thanthat for minority women in nine of the ten experience cohorts (see Table 30).Looking at the salaries over a longer period of time and holding constant thenumber of libraries over a 19-year period (Figure 3), we can see that women aregradually closing the earnings gap across different job categories, but the process isvery slow. Women earned more than men in two job categories (Head of Documentsand Circulation) in 1980-81; in 1989-90 women earned more than men in four jobcategories (Director, Functional Specialist, Head of Serials, and Head of Documents);most recently, in <strong>1999</strong>-<strong>2000</strong>, women earned more than men in five job categories(Director, Head of Reference, Head of Circulation, Head of Computer Systems, andCataloger). Overall, women earned the equivalent of 87% of men's salaries in 1980-81,90% in 1989-90, and 93% in <strong>1999</strong>-<strong>2000</strong>.16
Figure 3SALARY DIFFERENTIALS FOR MEN AND WOMEN FROM 1980-81 TO <strong>1999</strong>-<strong>2000</strong>(reporting data for 98 <strong>ARL</strong> university libraries)1980-81 1989-90 <strong>1999</strong>-<strong>2000</strong>Job Category Women Men Female- Women Men Female- Women Mento-Maleto-MaleEamingsEarningsRatioRatioMean Mean Mean Mean Mean MeanDirector $44,872 $48,128 93% $89,598 $88,473 101% $132,068 $125,211Associate Director 34,251 37,001 93% 56,982 59,193 96% 78,230 81,230Assistant Director 28,975 31,776 91 % 50,074 52,869 95% 71,361 75,308Head, Medical 33,941 36,752 92% 64,064 64,792 99% 90,116 101,369Head, Law 36,839 40,248 92% 71,114 81,193 88% 108,777 119,938Head, Branch 22,671 24,946 91% 38,863 43,124 90% 55,689 61,346Functional Specialist 20,218 22,212 91 % 34,588 33,870 102% 45,701 45,907Subject Specialist 21,034 21,820 96% 34,406 37,680 91% 49,038 51,529Head, Acquisitions N/A N/A N/A 37,738 39,311 96% 51,355 53,345Head, Reference 22,956 24,257 95% 39,083 40,663 96% 55,802 55,004Head, Cataloging 23,659 24,315 97% 38,373 42,998 89% 54,079 54,768Head, Serials 21,557 21,768 99% 38,487 37,949 101% 50,625 55,498Head, Documents 21,830 21,293 103% 38,348 36,796 104% 50,005 51,491Head, Circulation 20,942 20,731 101% 33,270 35,385 94% 51,075 45,873Head, Rare books 21,979 27,138 81% 37,881 46,583 81 % 56,653 65,988Head, ComputerSystems N/A N/A N/A 42,488 45,923 93% 61,234 60,185Head, Other 21,725 23,981 91 % 37,626 41,035 92% 52,494 56,575Public services 18,004 18,950 95% 30,803 32,153 96% 41,217 41,988Technical services 18,163 18,668 97% 32,294 33,149 97% 43,536 44,469Administration 20,249 21,148 96% 35,172 35,943 98% 47,353 51,705Reference librarian N/A N/A N/A 31,327 32,030 98% 42,726 43,389Cataloger N/A N/A N/A 31,045 31,882 97% 44,336 43,790TOTAL $20,329 $23,492 87%, $35,694 $39,864 90 ' 1
Graph 2FEMALE-TO-MALE EARNINGS RATIOS110% r---------------------------------------------------,105%Directors;§•...~" ='=...•w100%95%90%85%All PositionsThere is also a sense that the gender gap persists in academe in areas beyond thelibrary and that a renewed commitment to resolve the problem is needed.1° A varietyof reasons have been offered as to why these trends persist, most notably the perceptionthat work is peripheral in a woman's life and, consequently, female-dominatedprofessions are undervalued. Librarianship is predominantly and persistently awoman's profession. The scarcity of men in the profession has been well documentedin many studies - the largest percent of men employed in <strong>ARL</strong> libraries was 38.2 % in1980-81; since then men have consistently represented about 35% of the professionalstaff in <strong>ARL</strong> libraries.INSTITUTIONAL CHARACTERISTICS AND SALARIESA. PUBLIC AND PRIVATE INSTITUTIONSSalaries in private U.S. <strong>ARL</strong> university libraries continue to exceed those paid inpublicly supported U.S. university libraries. In FY <strong>1999</strong>-<strong>2000</strong>, the differential hasslightly declined, compared to last year, to $2,181, or 4.2%, more for the averageposition in a private institution. In a few cases - Heads of Acquisitions, Serials,Government Documents/Maps, and Circulation, and Reference Librarians with over 1410 Yolanda Moses, "Salaries in Academe: The Gender Gap Persists," ClJronicle of Higher Education (12 December, 1997): A60.18
years of experience-do average salaries in the public sector exceed those paid forsimilar positions in private university libraries (see Table 21).B. LIBRARY SIZESize of the library, as measured by the number of professional staff, is anothersignificant determinant of salary. As a rule, the largest libraries pay the highest averagesalaries, not only overall, but for specific positions as well. The cutoff staffing levelsused to determine the largest cohort of libraries has declined since 1995-96, indicating ageneral trend towards downsizing in the largest cohort of libraries.11 For the first timethis year, the second largest cohort of libraries, with staff levels between 75 and 110, hasthe highest average salary, $52,961, compared to $52,799 for the largest cohort withstaff over 110. Libraries with staff of 50-74 professionals paid an average salary of$50,167 and those with staff between 24 and 49 paid $48,901. The difference in salariesbetween the highest paying cohort and the lowest paying cohort is $4,060, a smallerdifference compared to last year's of $4,427 (see Table 23).C. GEOGRAPHIC AREAThe highest salaries are found in the Pacific area (see Table 25), followed by NewEngland and, the Middle Atlantic. All three areas have overall average salaries higherthan $50,000, with the Pacific area averaging as high as $58,605. Canadian salaries arethe lowest; Canada's currency has had a declining purchasing power against the u.s.dollar since the early '90s (Table 4). Note that the Canadian dollar has hit new lows(1.5103 Canadian dollars to one u.S. dollar).·12 Within the U.S., salaries in the WestSouth Central region are the lowest, followed by the East South Central, and WestNorth Central, and South Atlantic areas.D. RANK STRUCTURERank structure continues to provide a useful framework for examiningprofessional salaries in <strong>ARL</strong> university libraries. The following table displays averagesalary and years of experience in the most commonly used rank structures. Readersshould be aware that not all individuals have a rank that fits into the rank structure thelibrary utilizes. Most commonly, directors may have no rank or a rank outside the11 In J 995-96, the largest coh0J1 oflibrarics was determined based on staff over 124; in 1996-98, over 120; in 1998-99, over 115; and, this year,over 110. See Table 23.12 This is the average monthly noon exchange rate published in the Bank of Canada Review for the period July 1998-June <strong>1999</strong> and is used inconverting <strong>1999</strong>-<strong>2000</strong> figures that arc collected as of July <strong>1999</strong>.19
structure, and it is common for nonlibrarians included in the survey (business officers,personnel staff, computer specialists, etc.) to be unranked as well.The pattern of relationships between rank and salary seen in past years continueswith the present report where higher rank is associated with higher average years ofexperience and a higher salary. Over 65% (5,631 professionals) of the 8,595 librarians in<strong>ARL</strong> university member libraries occupy a rank within these three most commonlyfound ranking systems. And the largest number of librarians (3,312 or 38.5%) occupiesa rank in a four-step rank structure.Figure 4AVERAGE SALARIES AND AVERAGE YEARS OF EXPERIENCE OF LIBRARY PROFESSIONALSIN LIBRARIES WITH THREE, FOUR, AND FIVE STEP RANK STRUCTURESThree-Step Four-Step Five-Step<strong>Salary</strong> Experience <strong>Salary</strong> Experience <strong>Salary</strong> ExperienceLibrarian 1 37,970 9.6 36,125 5.9 36,071 5.2Librarian 2 46,783 17.5 42,208 12.4 42,635 13.1Librarian 3 62,194 22.7 50,432 19.5 48,390 17.5Librarian 4 62,222 24.4 60,447 21.1Librarian 5 65,643 25.8No. of Staff 1,360 3,312 959INFLATION EFFECTTables 2 and 6 reveal changes in beginning professional and median salaries, aswell as changes in the U.S. Bureau of Labor's Cost of Living Index (CPI-U) foruniversity and nonuniversity research libraries. Table 3 is similar to Table 2 but reportsdata only on u.s. libraries. Table 4 shows trend data for Canadian libraries andcompares them to the Canadian Consumer Price Index changes. Tables 2, 3, and 4include law and medical library staff in <strong>ARL</strong> university libraries. All tables indicate thatthe purchasing power of professionals working in <strong>ARL</strong> libraries increased faster thaninflation.The median salary for all <strong>ARL</strong> libraries was $47,377 in <strong>1999</strong>-<strong>2000</strong>; for only U.s.<strong>ARL</strong> libraries it was $48,000; and for Canadian <strong>ARL</strong> libraries it was $41,316 converted at20
the rate of 1.5103 Canadian to U.S. dollars (that is a median of $62,400 Canadiandollars).Table 6 reveals that the median salary fornonuniversity staff has increased about7% in the last year. The median salary for combined U.S. and Canadian salariesincreased 3.4 % (Table 2); for U.s. salaries 4.1 % (Table 3), and for Canadian salariesdenominated in Canadian dollars 2.4% (Table 4). At the same time, the U.S. ConsumerPrice Index increased only 2.1 % in the last year and the Canadian Consumer Price Indexincreased only 1.8%.These increases indicate a 15.3% increase in the purchasing power of the medianU.s. salary in university libraries and a 10.2% increase in the purchasing power of themedian nonuniversity salary since 1984-85.Beginning salaries have increased even faster, gaining 17.5% and 16.5% foruniversity and nonuniversity salaries respectively. The median beginning salary in <strong>ARL</strong>university libraries is $31,100; in <strong>ARL</strong> nonuniversity research libraries it is $30,849.A likely explanation for these rapid salary increases is that libraries are in need ofhiring professionals with advanced technological skills and the demand for these skillsis pushing salaries up. At the same time, as people are hired with increasingly highersalaries, a need to adjust the overall salary structure to achieve some equity for theexperienced staff members is another factor contributing to salaries increasing fasterthan inflation. This combined with other evidence from the <strong>ARL</strong> Statistics, which showsthat libraries' proportion of materials expenditures is increasing faster, leads to a futurepicture of libraries with fewer staff members that are being paid higher salaries.Readers are reminded that these data reflect only salaries, and that there areother compensation issues, which may have influenced the pattern of salaries in variousinstitutions. In addition, a highly standardized structure for capturing data has beenused, which may portray results in a way that cannot be fully representative of a localsituation.Martha K yrillidouAssociation of Research Libraries28 January, <strong>2000</strong>21
SALARY LEVELS FOR STAFF IN <strong>ARL</strong> LIBRARIESTables 1-4
24,999TABLE 1: DISTRIBUTION BY SALARY LEVEL"Figures in columns headed by fiscal year shov." the number of filled professiol1
TABLE 2: SALARY TRENDS IN <strong>ARL</strong> UNIVERSITY LIBRARIES*<strong>Salary</strong> figures for the current year are displayed in the context of the previous years andcompared to the changes in the Consumer Price Index (CPI) to show trends in the purchasingpower of median and beginning professional salaries. <strong>Salary</strong> figures and CPI numbers have beenconverted to adjusted indexes using July 1984 as the base.Fiscal No. of Total Median BPSI Median BPSI Actual AdjustedYear Libs. Staff <strong>Salary</strong>' Median <strong>Salary</strong> Index Index CPI CPI<strong>1999</strong>-<strong>2000</strong> 111 8,595 $ 47,377 $ 31,100 181.5 188.5 166.7 160.41998-99 110 8,400 45,775 30,000 175.2 181.7 163.2 156.91997-98 110 8,414 44,534 28,500 170.5 172.6 160.5 154.31996-97 109 8,325 43,170 27,687 165.3 167.7 157.0 151.01995-96 108 8,231 41,901 27,000 160.5 163.6 152.5 146.71994-95 108 8,216 41,088 26,000 157.4 157.6 148.4 142.81993-94 108 8,132 40,225 25,834 154.1 156.6 144.4 139.01992-93 108 8,212 39,265 25,000 150.4 151.5 140.2 134.91991-92 107 8,256 38,537 24,000 147.7 145.5 136.2 13].]1990-91 107 8,382 36,701 23,800 140.6 144.2 130.7 125.81989-90 107 8,253 34,629 22,000 132.7 133.3 124.0 119.31988-89 107 8,087 32,461 20,400 124.4 123.6 118.3 113.91987-88 106 7,962 30,534 19,460 117.0 117.9 113.6 109.31986-87 105 7,718 28,941 18,250 110.9 110.6 109.6 105.51985-86 105 7,543 27,485 17,500 105.3 106.1 107.6 103.61984-85 104 7,161 26,100 16,500 100.0 100.0 103.9 100.0* Canadian salaries expressed in U.S. dollars.t Includes medical and law libraries.t Beginning professional salary.26
TABLE 3: SALARY TRENDS IN U.S. <strong>ARL</strong> UNIVERSITY LIBRARIES*<strong>Salary</strong> figures for the current year are displayed in the context of previous years and compared tothe changes in the U.S. Consumer Price Index (CPI) to show trends in the purchasing power ofmedian and beginning professional salaries. <strong>Salary</strong> figures and CPI numbers have beenconverted to adjusted indexes, using July 1984 as the base.Fiscal No. of Total Median Median Median Actual Adjusted CPIYear Libs. Staff <strong>Salary</strong> <strong>Salary</strong> <strong>Salary</strong> CPI CPI ChangeChange Index<strong>1999</strong>-<strong>2000</strong> 98 7,858 $48,000 4.1% 185.0 166.7 160.4 2.1%1998-99 97 7,671 46,130 3.6% 177.8 163.2 157.1 1.7'101997-98 97 7,682 44,544 3.4% 171.7 160.5 154.5 2.2%1996-97 96 7,562 43,084 3.4% 166.1 157.0 151.1 3.0%1995-96 95 7,435 41,651 2.7% 160.5 152.5 146.8 2.8%1994-95 95 7,401 40,573 3.4% 156.4 148.4 142.8 2.8%1993-94 95 7,390 39,257 3.0% 151.3 144.4 139.0 3.0%1992-93 95 7,375 38,124 3.0% 146.9 140.2 134.9 2.9'%1991-92 94 7,408 37,009 3.5% 142.6 136.2 131.1 4.2%1990-91 94 7,543 35,761 5.2% 137.8 130.7 125.8 5.4%1989-90 94 7,344 34,000 5.8% 131.0 124.0 119.3 4.8%1988-89 94 7,252 32,149 5.4% 123.9 118.3 113.9 4.1%1987-88 93 7,145 30,492 5.1% 117.5 113.6 109.3 3.6'Yo1986-87 92 6,886 29,021 6.5% 111.9 109.6 105.5 1.9%1985-86 91 6,707 27,249 5.0% 105.0 107.6 103.6 3.6%1984-85 91 6,456 25,946 6.9% 100.0 103.9 100.0OJ- Includes medical and law libraries in median salary.27
TABLE 4: SALARY TRENDS IN CANADIAN <strong>ARL</strong> UNIVERSITY LIBRARIES*<strong>Salary</strong> figures for the current year are displayed in the context of previous years. Canadian salariesare presented in both U.S. $ and Canadian $ denominations and the annual exchange rate used in thesalary surveys is also listed. Canadian salaries are also compared to the changes in the CanadianConsumer Price Index (Cpr) to show trends in the purchasing power of median Canadian salaries.cpr number changes are based on July cpr figures.Fiscal No. of Total Median Median Exchange Median Median CanadianYear Libs. Staff <strong>Salary</strong> <strong>Salary</strong> Rate <strong>Salary</strong> <strong>Salary</strong> cprin U.S. $' Change' in Can. $ Change Change<strong>1999</strong>-<strong>2000</strong> 13 737 $41,316 -3.8% 1.5103 Can $ 62,400 2.4% 1.8%1998-99 13 729 42,963 -2.7 1.4177 60,909 0.9 1.01997-98 13 732 44,167 1.4 1.3663 60,346 1.7 1.81996-97 13 764 43,569 0.9 1.3613 59,310 -0.4 1.21995-96 13 796 43,173 -1.7 1.3794 59,554 1.3 2.51994-95 13 815 43,919 -6.0 1.3381 58,768 0.7 0.21993-94 13 816 46,744 -4.3 1.2488 58,374 2.9 1.61992-93 13 837 48,820 2.7 1.1623 56,744 3.4 1.31991-92 13 847 47,519 5.5 1.1547 54,870 3.6 5.81990-91 13 839 45,023 15.1 1.1759 52,942 12.5 4.21989-90 13 853 39,117 12.3 1.2026 47,042 5.3 5.41988-89 13 837 34,826 11.7 1.2826 44,668 5.3 3.81987-88 13 817 31,178 10.9 1.3602 42,408 9.1 4.71986-87 13 831 28,123 -1.9 1.3817 38,858 1.2 4.21985-86 13 829 28,666 1.1 1.3388 38,378 7.9 3.81984-85 12 705 28,346 -0.8 1.2548 35,569 0.8 4.2Average 2.5 3.7 3.0* Canadian salaries expressed in U.S. dollars.t Includes medical and law libraries in median salary.28
<strong>ARL</strong> NONUNIVERSITY LIBRARIESTables 5-6
TABLE 5: MEDIAN AND BEGINNING PROFESSIONAL SALARIESIN <strong>ARL</strong> NONUNIVERSITY LIBRARIES*Median SalariesBeginning SalariesNo. of Staff FY1998-99 FY <strong>1999</strong>-<strong>2000</strong> FY 1998-99 FY <strong>1999</strong>-<strong>2000</strong>Boston Public Library 198 $56,461 $50,166 $23,243 $25,421Canada Institute for Scientific 155 35,268 34,761 17,634 18,337and Technical Information *Center for Research Libraries 22 44,780 44,000 26,500 30,305Library of Congress 1 2,615 61,190 63,436 32,457 33,650National Agricultural Library* 101 53,343 55,303 32,457 33,650National Library of Canada >I- 127 31,725 33,656 22,541 25,051National Library of Medicine 169 58,051 58,556 32,457 33,650New York Public Librar/ 232 38,335 42,250 29,877 31,296New York State Librar/ 67 47,086 47,086 30,401 30,401Smithsonian Library 51 52,559 56,929 36,786 34,772>I- Canadian salaries expressed in U.S. dollars.t See footnotes.30
TABLE 6: SALARY TRENDS IN <strong>ARL</strong> NONUNIVERSITY LIBRARIES*<strong>Salary</strong> figures for the current year are displayed in the context of the previous years and compared to thechanges in the Consumer Price Index (CPl) to show trends in the purchasing power of median andbeginning professional salaries. <strong>Salary</strong> figures and CPI numbers have been converted to adjustedindexes, using July 1984 as the base.Fiscal No. of Total Median BPS' Median BPS' Actual AdjustedYear Libs. Staff <strong>Salary</strong>* Median <strong>Salary</strong> Index Index CPI CPI<strong>1999</strong>-<strong>2000</strong> 10 3,737 $59,916 $30,849 176.8 186.9 166.7 160.31998·99 11 3,819 56,000 29,877 165.3 181.0 163.2 156.91997-98 11 3,779 55,055 28,724 162.5 174.0 . 160.5 154.31996·97 11 3,799 51,150 28,380 151.0 ]72.0 157.0 151.01995-96 11 3,915 49,149 28,162 145.1 170.7 152.5 146.71994·95 11 3,837 47,997 27,813 141.7 168.6 148.4 142.81993-94 11 4,003 44,949 26,806 132.7 162.5 144.4 139.01992-93 11 4,172 43,876 23,500 129.6 142.4 140.2 134.91991-92 11 2,906 42,455 23,500 125.4 142.4 136.2 131.11990-91 12 1,363 36,013 20,800 106.3 126.1 130.7 125.81989-90 11 3,767 40,106 20,195 118.4 122.4 124.0 119.31988-89 11 3,781 37,544 19,100 110.9 115.8 118.3 1l3.91987-88 11 3,765 36,250 18,405 107.0 111.5 113.6 109.31986-87 10 2,790 33,020 17,912 97.5 108.6 109.6 105.51985-86 12 3,874 33,720 17,308 99.6 104.9 107.6 103.61984-85 11 3,840 33,863 16,500 100.0 100.0 103.9 100.0>I- Canadian salaries expressed in U.S. dollars.t Begi11l1ing professional salary.31
<strong>ARL</strong> UNIVERSITY LIBRARIESTables 7-25
TABLE 7: FILLED POSITIONS; AVERAGE, MEDIAN, BEGINNING PROFESSIONALSALARIES; AND AVERAGE YEARS OF EXPERIENCE<strong>ARL</strong> UNIVERSITY LIBRARIES, FY <strong>1999</strong>-<strong>2000</strong>*Filled Average Median Beginning AveragePos. Salaries Salaries Salaries Yrs.Exp.Institution FY <strong>2000</strong> FY <strong>1999</strong> FY <strong>2000</strong> FY <strong>1999</strong> FY <strong>2000</strong> FY <strong>1999</strong> FY <strong>2000</strong> FY <strong>2000</strong>Miami 33 $46,270 $45,962 $44,793 $45,()67 $27,000 $2Y,SOD 20.7Michigan! ](}4 49,238 51,543 44,204 46,342 3"l,OOO 32,000 16.5Michigan Stiltc 1 58 44,065 44,933 42,000 42,000 33,000 33,000 17.1Minnesol
TABLES: BEGINNING PROFESSIONAL SALARIES IN <strong>ARL</strong> UNIVERSITY LIBRARIESRANK ORDER TABLE, FY 1998-99"Rank Institution <strong>Salary</strong> Rank Institution <strong>Salary</strong>1 Howard $40,000 50 Temple $30,0002 Georgetown 38,357 50 Texas 30,0003 Stanford 37,500 50 TexasA&M 30,0004 New York 37,000 50 Virginia 30,0005 Kent State 36,667 60 Cornell 29,5006 Colorado State 36,000 60 Emory 29,5006 Columbia 36,000 62 Boston 29,4258 Connecticut 35,500 63 Washington 29,4009 Arizona 34,921 64 Ohio 29,20710 Yale 34,700 65 Ohio State 29,00411 Harvard 34,300 66 Georgia Tech 29,00011 New Mexico 34,300 66 Nebraska 29,00013 Rutgers 34,119 66 North Carolina 29,00014 Johns Hopkins 33,956 66 SUNY Albany 29,00015 Hawaii 33,312 66 SUNY Stony Brook 29,00016 Michigan State 33,000 66 Tennessee 29,00016 Southern Illinois 33,000 72 Western Ontario 28,68716 Wayne State 33,000 73 Brigham Young 28,50019 Princeton 32,600 73 Georgia 28,50020 Chicago 32,500 73 Louisiana State 28,50020 Pennsylvania State 32,500 73 Virginia Tech 28,50020 Southern California 32,500 77 Northwestern 28,20023 Notre Dame 32,000 78 Texas Tech 28,12823 Oklahoma 32,000 79 Arizona State 28,00023 Pennsylvania 32,000 79 Florida 28,00026 Calif. Berkeley 31,656 79 Kentucky 28,00026 Calif. Davis 31,656 79 Rochester 28,00026 Calif. Irvine 31,656 79 Utah 28,00026 Calif. Los Angeles 31,656 79 Vanderbilt 28,00026 Calif. Riverside 31,656 85 Oregon 27,50026 Calif. San Diego 31,656 85 Wash Univ ~ St Louis 27,50026 Calif. Santa Barbara 31,656 87 Houston 27,00033 Colorado 31,500 87 Miami 27,00033 Oklahoma State 31,500 87 SUNY Buffalo 27,00035 Indiana 31,039 90 Guelph t 26,97036 Dartmouth 31,000 91 Missouri 26,50036 Illinois, Urbana 31,000 92 York t 26,17336 Massachusetts 31,000 93 Alabama 26,00036 MIT 31,000 93 Kansas 26,00036 Michigan 31,000 93 Purdue 26,00041 Rice 30,712 93 Washington State 26,00042 Wisconsin 30,636 97 Cincinnati 25,00043 Duke 30,550 97 Florida State 25,00044 Illinois, Chicago 30,500 99 Maryland 24,81944 North Carolina State 30,500 10O Waterloo t 24,63246 Auburn 30,450 101 South Carolina 24,50047 Case Western Reserve 30,410 102 British Columbia t 24,49748 Brown 30,200 103 McMaster f 24,02349 Tulane 30,100 104 McGill t 23,98350 Delaware 30,000 105 Toronto t 23,84150 Iowa 30,000 106 Laval t 23,76450 Iowa State 30,000 107 Alberta t 23,52850 Minnesota 30,000 108 Queen's t 22,57250 Pittsburgh 30,000 109 Manitoba t 22,39350 Syracuse 30,000 110 Saskatchewan t 21,933~. Reprinted from <strong>ARL</strong> <strong>Annual</strong> <strong>Salary</strong> <strong>Survey</strong> 1998-99. Beginning salary figures represent officially designated base, not necessarily salariesof actual incumbents. Excludes medical and law libraries. See Tables 36 and 43 for statistics related to medical and law librarysalaries.t Canadian salaries expressed in U.S. dollars.36
TABLE 9: BEGINNING PROFESSIONAL SALARIES IN <strong>ARL</strong> UNIVERSITY LIBRARIESRANK ORDER TABLE, FY <strong>1999</strong>-<strong>2000</strong>*Rank Institution <strong>Salary</strong> Rank Institution <strong>Salary</strong>1 Kent State $40,333 56 Brown $31,1002 New Mexico 40,000 57 Georgia Tech 31,0003 Georgetown 38,357 57 Iowa State 31,0004 New York 38,000 57 Nebraska 31,0004 Stanford 38,000 57 TexasA&M 31,0006 Columbia 37,500 61 Wisconsin 30,6367 Howard 36,865 62 Boston t 30,6008 Colorado State 36,000 62 Washington 30,6008 Connecticut 36,000 64 Cornell 30,50010 Yale 35,700 65 Arizona State 30,00011 Arizona 35,460 65 Emory 30,00012 Harvard 35,200 65 Florida 30,00013 Southern Illinois 35,000 65 George Washington 30,00014 Johns Hopkins 34,805 65 Houston 30,00015 Rutgers 34,306 65 Iowa 30,00016 Notre Dame 34,000 65 Kansas 30,00016 Oklahoma 34,000 65 Kentucky 30,00016 Pennsylvania 34,000 65 North Carolina 30,00016 Wayne State 34,000 65 Ohio5tate 30,00020 Pennsylvania State 33,500 65 Pittsburgh 30,00021 Chicago 33,475 65 SUNY Buffalo 30,00022 Hawaii 33,312 65 Syracuse 30,00023 lilinois, Urbana 33,000 65 Temple 30,00023 Massachusetts 33,000 65 Tennessee 30,00023 Michigan State 33,000 65 Utah 30,00023 SUNY Albany 33,000 65 Virginia 30,00027 Duke 32,800 65 Virginia Tech 30,00028 Princeton 32,600 65 Washington State 30,00029 Southern California 32,500 84 Georgia 29,50030 Calif. Berkeley 32,292 84 Miami 29,50030 Calif. Davis 32,292 84 Ohio 29,50030 Calif. Irvine 32,292 87 Texas Tech 29,32830 Calif. Los Angeles 32,292 88 Northwestern 29,20030 Calif. Riverside 32,292 89 Louisiana State 29,00030 Calif. San Diego 32,292 90 Oregon 28,00030 Calif. Santa Barbara 32,292 90 Purdue 28,00037 Brigham Young 32,000 90 Vanderbilt 28,00037 Delaware 32,000 93 Washington-St. Louis 27,80037 MIT 32,000 94 Missouri 27,50037 Michigan 32,000 95 Western Ontario t 27,26637 Minnesota 32,000 96 Florida State 27,00037 Rochester 32,000 97 York t 26,37637 SUNY Stony Brook 32,000 98 Alabama 26,00037 Texas 32,000 98 South Carolina 26,00045 Indiana 31,862 100 Cincinnati 25,00046 Maryland 31,762 101 Guelph t 24,31547 Auburn 31,500 102 Alberta t 23,52147 Colorado 31,500 103 Waterloo t 23,46947 Illinois, Chicago t 31,500 104 British Columbia t 22,99647 North Carolina State 31,500 105 Toronto t 22,71147 Oklahoma State 31,500 106 McMaster t 22,55047 Tulane 31,500 107 McGill t 22,51253 Case Weslel'll Reserve 31,480 108 Laval t 22,30754 Rice 31,326 109 Manitoba t 21,44255 Dartmouth 31,200 110 Queen's t 21,188111 Saskatchewan t 20,589.. Beginning salary figures represent officially deSignated base, not necessarily salaries of actual incumbents.Excludes medical and law libraries. See Tables 36 and 43 for statistics related to medical and law library salaries.t See Footnotes.tCanadian salaries expressed in U.S. dollars.37
TABLE 10: MEDIAN PROFESSIONAL SALARIES IN <strong>ARL</strong> UNIVERSITY LIBRARIESRANK ORDER TABLE, FY 1998-99*Rank Institution <strong>Salary</strong> Rank Institution <strong>Salary</strong>1 Rutgers $65,909 56 York t $44,6322 California, Irvine 65,472 57 Georgia Tech 44,5002 California, Los Angeles 65,472 58 North Carolina State 44,4104 California, Davis 59,488 59 Tulane 44,3765 California, Berkeley 59,448 60 Michigan 44,2046 Stanford 58,964 61 Washington 44,1607 California, Santa Barbara 58,110 62 Pennsylvania 43,8868 Connecticut 56,501 63 Ohio State 43,8719 California, San Diego 55,788 64 Johns Hopkins 43,64010 California, Riverside 55,728 65 Illinois, Chicago 43,63211 Columbia 52,775 66 Georgia 43,60512 Massachusetts 52,589 67 SUNY Albany 43,20613 Hawaii 52,290 68 Arizona 43,14614 Cincinnati 51,767 69 Manitoba t 43,02915 Yale 50,917 70 Maryland 42,75616 Princeton 50,800 71 Texas 42,46217 Iowa 50,731 72 Nebraska 42,40318 Harvard 50,400 73 Cornell 42,11019 New Mexico 50,299 74 Michigan State 42,00020 SUNY Stony Brook 50,170 75 Rice 41,85021 Dartmouth 49,724 76 Wayne State 41,84722 Toronto 49,608 77 North Carolina 41,65023 Delaware 49,332 78 Washington State 41,60424 Virginia 49,300 79 Boston University 41,60025 Brown 49,138 80 McGill t 41,55226 Southern California 49,121 81 Laval t 41,45327 New York University 48,803 82 Virginia Tech 41,44628 Saskatchewan t 48,499 83 Temple 41,42229 Notre Dame 47,430 84 Kentucky 41,17930 Indiana 47,008 85 Missouri 41,06631 Pennsylvania State 46,776 86 Syracuse 41,01732 Emory 46,700 87 McMaster t 40,88333 Tennessee 46,536 88 Kansas 40,58334 SUNY Buffalo 46,524 89 Western Ontario f 40,50235 Georgetown 46,427 90 Alberta t 40,38436 Brigham Young 46,322 91 Kent State 39,94637 Southern IlliI10is 46,287 92 Utah 39,81138 Chicago 46,206 93 Houston 39,75939 Wisconsin 46,175 94 Texas A&M 39,65040 Guelph t 46,155 95 South Carolina 39,63141 Minnesota 45,985 96 Waterloo t 39,58042 Ohio University 45,965 97 Case Western Reserve 39,52043 Howard 45,918 98 Florida State 39,38644 Colorado State 45,820 99 Pittsburgh 39,31945 Northwestern 45,372 100 Vanderbilt 39,22546 Purdue 45,355 101 Florida 39,10247 Iowa State 45,252 102 Washington U.~St. Louis 38,91348 Auburn 45,150 103 Oregon 38,38249 Illinois, Urbana 45,136 104 Oklahoma 38,28550 Arizona State 45,074 105 Alabama 37,97351 MIT 44,800 106 Queen's t 37,72752 Miami 44,793 107 Oklahoma State 37,47653 Colorado 44,784 108 Rochester 37,23254 British Columbia t 44,774 109 Louisiana State 34,10055 Duke 44,700 110 Texas Tech 32,952~. Reprinted from <strong>ARL</strong> Armual <strong>Salary</strong> <strong>Survey</strong> 1998~99. Salaries of directors are not included in the calculation of medians.Excludes medical and law libraries. See Tables 37 and 44 for statistics related to medical and law library salaries.t Canadian salaries expressed in U.S. dollars.38
TABLE 11: MEDIAN PROFESSIONAL SALARIES IN <strong>ARL</strong> UNIVERSITY LIBRARIESRANK ORDER TABLE, FY <strong>1999</strong>-<strong>2000</strong>*Rank Institution <strong>Salary</strong> Rank Institution <strong>Salary</strong>1 Rutgers $67,447 56 Washington $46,1642 California, Davis 66,780 57 Purdue 46,0902 California, Irvine 66,780 58 Duke 46,0502 California, Los Angeles 66,780 59 Nebraska 45,9295 California, Berkeley 60,636 60 Texas 45,7506 California, San Diego 58,008 61 Ohio University 45,7467 Stanford 57,177 62 Washington State 45,6678 California, Riverside 56,844 63 Georgia 45,5838 Caiifol'llia, Santa Barbara 56,844 64 Ohio State 45,53810 Connecticut 56,145 65 Auburn 45,50011 New Mexico 55,677 66 Pennsylvania 45,32512 SUNY Stony Brook 55,584 67 Temple 45,22813 Columbia 54,762 68 Illinois, Chicago 45,15014 Massachusetts 53,744 69 Miami 45,06715 Princeton 53,600 70 Wayne State 44,82016 Dartmouth 53,500 71 SUNY Albany 44,28417 Iowa 52,207 72 Howard 44,22618 Harvard 51,993 73 Virginia Tech 44,20019 Cincinnati 51,923 74 Tulane 43,94620 Southern California 51,706 75 Southern Jllinois 43,63221 Yale 51,528 76 Rice 43,32522 Hawaii 51,264 77 Syracuse 43,27623 Delaware 51,059 78 South Carolina 42,81224 New York University 51,035 79 British Columbia t 42,75625 Brown 50,994 80 York t 42,66126 Chicago 49,808 81 Kentucky 42,55227 Colorado 49,425 82 Boston University 42,52128 Arizona State 49,219 83 Kansas 42,31129 Brigham Young 48,943 84 Alberta t 42,30030 Indiana 48,785 85 North Carolina 42,05031 Notre Dame 48,720 86 Michigan State 42,00032 Colorado State 48,665 86 Utah 42,00033 Georgetown 48,576 88 TexasA&M 41,29834 Permsylvania State 48,378 89 Guelph t 41,27435 Emory 48,325 90 Missouri 41,19236 Johns Hopkins 48,283 91 Houston 41,12937 Virginia 48,150 92 McGill t 41,08138 Toronto 47,919 93 Oregon 41,00839 George Washington 47,875 94 Florida 40,95340 Minnesota 47,677 95 Manitoba t 40,91741 Northwestern 47,569 96 Washington U.-St. Louis 40,52842 Kent State 47,500 97 Case Western Reserve 40,45243 Illinois, Urbana 47,470 98 Pittsburgh 40,28644 Georgia Tech 47,400 99 Florida State 40,20045 Cornell 47,256 100 McMaster t 39,91846 Iowa State 47,093 101 Vanderbilt 39,56047 Maryland 47,087 102 Laval t 39,06748 MIT 46,900 103 Oklahoma State 38,82049 North Carolina State 46,575 104 Oklahoma 38,34550 Arizona 46,556 105 Waterloo t 38,29451 Tennessee 46,531 106 Rochester 38,02852 SUNY Buffalo 46,378 107 Texas Tech 37,61653 Michigan 46,342 108 Western Ontario t 37,57254 Saskatchewan t 46,294 109 Queen's t 36,64355 Wisconsin 46,175 110 Louisiana State 35,300111 Alabama 34,510* Salaries of directors are not included in the calculation of medians. Excludes medical and law libraries. See Tables 37 and 44 forstatistics related to medical and law library salaries.t Canadian salaries expressed in U.S. dollars.39
TABLE 12: AVERAGE PROFESSIONAL SALARIES IN <strong>ARL</strong> UNIVERSITY LIBRARIESRANK ORDER TABLE, FY 1998-99*Rank Institution <strong>Salary</strong> Rank Institution <strong>Salary</strong>1 Stanford $65,061 56 Washington $46,7012 Rutgers 63,323 57 Ohio University 46,3323 California, Irvine 62,066 58 Miami 46,2704 California, Berkeley 61,678 59 Arizona State 46,2385 California, Los Angeles 60,857 60 Tulane 46,2346 California, Davis 60,592 61 Georgia Tech 46,2337 California, Santa Barbara 58,430 62 Saskatchewan t 46,1368 California, San Diego 57,940 63 Ohio State 46,1139 Columbia 56,251 64 Maryland 45,82410 California, Riverside 55,826 65 Illinois, Chicago 45,70711 Connecticut 55,441 66 Rice 45,69512 Princeton 55,159 67 Geor~ia 45,65013 Harvard 54,721 68 York 45,62114 New York University 54,281 69 Kent State 45,52315 Southern California 53,549 70 Texas 45,36216 Hawaii 52,714 71 Johns Hopkins 45,29817 Yale 52,697 72 Guelph t 44,59018 Dartmouth 51,880 73 Oklahoma 44,45419 Iowa 51,838 74 Arizona 44,36320 SUNY Stony Brook 51,540 75 Boston University 44,21821 Massachusetts 51,216 76 Missouri 44,13422 Virginia 51,206 77 SUNY Albany 44,12323 New Mexico 51,063 78 Michigan State 44,06524 Cincinnati 50,864 79 Washington U.-St. Louis 44,01925 Chicago 50,190 80 North Carolina 43,93226 Brown 50,133 81 Nebraska 43,85727 Indiana 49,970 82 Virginia Tech 43,64828 Colorado State 49,513 83 Vanderbilt 43,45129 Delaware 49,352 84 Temple 43,33230 Tennessee 49,249 85 Washington State 43,30331 Michigan 49,238 86 Case Western Reserve 43,21732 Notre Dame 48,894 87 Kentucky 43,02033 Minnesota 48,768 88 Houston 43,00434 Emory 48,724 89 Kansas 42,91035 Pennsylvania State 48,578 90 Pittsburgh 42,79536 Duke 48,497 91 TexasA&M 42,75137 Northwestern 48,474 92 Syracuse 42,68538 Southern Illinois 48,156 93 Laval t 42,66039 Brigham Young 47,912 94 Alberta t 42,61740 Georgetown 47,888 95 Manitoba t 42,53241 Wisconsin 47,773 96 Utah 42,43642 MIT 47,768 97 Florida 42,04243 North Carolina State 47,669 98 McMaster t 41,98644 Wayne State 47,642 99 McGill t 41,82245 Howard 47,538 100 Oregon 41,82046 Purdue 47,523 101 Rochester 41,41347 Illinois, Urbana 47,488 102 South Carolina 41,20248 SUNY Buffalo 47,464 103 Oklahoma State 41,12449 Cornell 47,464 104 Waterloo t 40,36450 Auburn 47,289 105 Florida State 40,24751 Colorado 47,127 106 Western Ontario t 39,50552 Toronto t 47,076 107 Queen's t 39,12453 Pennsylvania 46,840 108 Alabama 38,31854 Iowa State 46,809 109 Louisiana State 38,31155 British Columbia t 46,701 110 Texas Tech 36,286* Reprinted from <strong>ARL</strong> Armual <strong>Salary</strong> <strong>Survey</strong> 1998-99. Salaries of directors are not included in the calculation of averages.Excludes medical and law libraries. See Tables 38 and 45 for statistics related to medical and law library salaries.t Canadian salaries expressed in U.s. dollars.40
TABLE 13: AVERAGE PROFESSIONAL SALARIES IN <strong>ARL</strong> UNIVERSITY LIBRARIESRANK ORDER TABLE, FY <strong>1999</strong>-<strong>2000</strong>*Rank Institution <strong>Salary</strong> Rank Institution <strong>Salary</strong>1 Stanford $63,727 56 Washington $48,7692 Rutgers 63,407 57 Southern Illinois 48,6343 California, Berkeley 63,250 58 Purdue 48,4254 California, Irvine 63,233 59 Georgia Tech 48,3215 California, Los Angeles 62,733 60 Ohio State 48,0686 California, Davis 62,542 61 Georgia 47,8387 California, San Diego 60,363 62 Wisconsin 47,7738 California, Riverside 58,824 63 SUNY Buffalo 47,7449 California, Santa Barbara 58,822 64 Nebraska 47,44010 Columbia 58,392 65 Ohio University 47,40411 New Mexico 57,474 66 Auburn 47,24612 Princeton 57,144 67 Illinois, Chicago 47,18713 Southern California 57,038 68 Rice 47,14014 SUNY Stony Brook 56,802 69 Washington State 47,04515 New York University 56,781 70 Virginia Tech 47,01416 Connecticut 56,121 71 Howard 46,78617 Harvard 55,899 72 British Columbia t 46,50218 Dartmouth 54,719 73 Oklahoma 45,96519 Iowa 54,219 74 Miami 45,96220 Chicago 53,991 75 SUNY Albany 45,90021 Massachusetts 53,417 76 South Carolina 45,78822 Yale 53,017 77 Toronto t 45,62923 Virginia 52,335 78 Tulane 45,34524 Brown 51,916 79 Michigan State 44,93325 Michigan 51,543 80 North Carolina 44,86926 Hawaii 51,453 81 Kentucky 44,85827 Indiana 51,449 82 Boston University 44,79828 Colorado 51,259 83 York t 44,58429 Emory 51,214 84 Missouri 44,54730 Kent State 51,008 85 Utah 44,52031 Colorado State 50,968 86 Pittsburgh 44,51332 Delaware 50,944 87 Syracuse 44,43633 Brigham Young 50,917 88 Washington U.-St. Louis 44,37134 Georgetown 50,844 89 Kansas 43,96335 Cincinnati 50,350 90 Florida 43,88136 Northwestern 50,290 91 TexasA&M 43,73237 Iowa State 50,243 92 Oregon 43,68138 Johns Hopkins 50,169 93 Case Western Reserve 43,63439 MIT 50,052 94 Vanderbilt 43,60140 Cornell 50,044 95 Saskatchewan t 43,34441 Illinois, Urbana 49,942 96 Houston 43,31842 Wayne State 49,897 97 Alberta t 42,65043 Notre Dame 49,895 98 Florida State 42,64544 Pennsylvania State 49,771 99 Oklahoma State 42,45545 North Carolina State 49,765 100 Rochester 42,09546 Minnesota 49,728 101 Guelph t 41,55547 Texas 49,588 102 McGill t 41,28748 George Washington 49,253 103 McMaster t 40,07049 Pennsylvania 49,243 104 Texas Tech 40,02450 Temple 49,187 105 Laval t 39,37651 Duke 49,117 106 Manitoba t 39,36552 Arizona 49,080 107 Alabama t 38,80753 Tennessee 48,977 108 Waterloo t 38,70854 Maryland 48,895 109 Louisiana State 38,01655 Arizona State 48,829 110 Queen's t 37,886111 Western Ontario t 37,436* Salaries of directors are not included in the calculation of averages.Excludes medical and law libraries. See Tables 38 and 45 for statistics related to medical and law library salaries.t Canadian salaries expressed in U.S. dollars.41
TABLE 14: AVERAGE, MEDIAN, AND BEGINNING PROFESSIONAL SALARIESIN <strong>ARL</strong> UNIVERSITY LIBRARIESSUMMARY OF RANKINGS, FYs 1996-97 TO <strong>1999</strong>-<strong>2000</strong>*Institution Average Salaries Median Salaries Beginning SalariesFY 1997 1998 <strong>1999</strong> <strong>2000</strong> 1997 1998 <strong>1999</strong> <strong>2000</strong> 1997 1998 <strong>1999</strong> <strong>2000</strong>Alabama 109 109 108 107 109 109 105 111 107 108 93 98Alberta 59 72 94 97 67 77 90 84 99 102 107 102Arizona 71 78 74 52 59 65 68 50 29 33 9 11Arizona State 77 68 59 55 69 58 50 28 78 61 79 65Auburn 80 99 50 66 88 101 48 65 19 31 46 47Boston University 82 100 75 82 92 104 79 82 77 60 62 62Brigham Young 66 70 39 33 72 68 36 29 57 70 73 37British Columbia 28 41 55 72 27 36 54 79 88 93 102 104Brown 33 31 26 24 41 37 25 25 44 45 48 56California, Berkeley 6 4 4 3 8 3 5 5 20 20 26 30Californis, Davis 4 5 6 6 3 3 4 2 20 20 26 30California, Irvine 3 1 3 4 1 1 2 2 20 20 26 30California, Los Angeles 5 6 5 5 3 3 2 2 20 20 26 30California, Riverside 11 10 10 8 9 10 10 8 20 20 26 30California, San Diego 9 9 8 7 10 11 9 6 20 20 26 30California, Santa Barbara 7 7 7 9 5 7 7 8 20 20 26 30Case Western Reserve 104 89 86 93 106 95 97 97 97 89 47 53Chicago 22 23 25 20 33 34 38 26 27 19 20 21Cincinnati 36 26 24 35 22 19 14 19 91 96 97 100Colorado 91 82 51 28 73 63 53 27 78 70 33 47Colorado State 30 27 28 31 48 39 44 32 1 3 6 8Columbia 10Connecticut 8Cornell 45Dartmouth 17Delaware 41Duke 26Emory 39Florida 103Florida State 98George Washington,Georgetown 58Georgia 83Georgia Tech 68Guelph 57Harvard 13Hawaii 18Houston 10211 9 10 118 11 16 736 49 40 7120 18 18 2033 29 32 2329 36 51 3742 34 29 38106 97 90 103105 105 98 98, ,48,32 40 34 5888 67 61 8166 61 59 8452 72 101 3212 13 17 1618 16 26 1994 88 96 10013 11 13 5 6 6 68 8 10 11 4 8 861 73 45 60 53 60 6423 21 16 39 33 36 5524 23 23 62 77 50 3744 55 58 32 29 43 2745 32 35 45 49 60 65105 101 94 78 61 79 6598 98 99 102 104 97 96, ,39, , ,6533 35 33 15 12 2 388 66 63 78 79 73 8482 57 44 63 61 66 5728 40 89 104 88 90 10120 18 18 7 9 11 1212 13 22 6 10 15 2291 93 91 78 79 87 65>I- Excludes medical and law libraries.t Not a member during this year.42
TABLE 14: AVERAGE, MEDIAN, AND BEGINNING PROFESSIONAL SALARIESIN <strong>ARL</strong> UNIVERSITY LIBRARIESSUMMARY OF RANKINGS, FYs 1996-97 TO <strong>1999</strong>-<strong>2000</strong>*Institution Average Salaries Median Salaries Beginning SalariesFY 1997 1998 <strong>1999</strong> <strong>2000</strong> 1997 1998 <strong>1999</strong> <strong>2000</strong> 1997 1998 <strong>1999</strong> <strong>2000</strong>Howard 52 69 45 71 65 64 43 72 3 7 1 7Illinois, Chicago 63 57 65 67 70 67 65 68 40 42 44 47Illinois, Urbana 61 47 47 41 75 48 49 43 36 33 36 23Indiana 25Iowa 19Iowa State 31Jolms Hopkins 51Kansas 101Kent State 47Kentucky 85Laval 60Louisiana State 106McGill 74McMaster 65Manitoba 62Maryland 64Massachusetts 20MIT 46Miami 67Michigan 27Michigan State 81Minnesota 55Missouri 87Nebraska 72New Mexico 24New York University 16North Carolina 79North Carolina State 43Northwestern 32Notre Dame 23Ohio University 53Ohio State 48Oklahoma 88Oklahoma State 108Oregon 90Pennsylvania 38Pennsylvania State 35Pittsburgh 10028 27 27 2922 19 19 1738 54 37 4062 71 38 3493 89 89 10149 69 30 8684 87 81 8376 93 105 3991 109 109 10879 99 102 4974 98 103 5361 95 106 3056 64 54 6815 21 21 1567 42 39 6654 58 74 6135 31 25 6464 78 79 7634 33 46 5480 76 84 9175 81 64 6243 23 11 2414 14 15 2177 80 80 7958 43 45 5245 37 36 4621 32 43 2637 57 65 4755 63 60 5087 73 73 97107 103 99 107104 100 92 9044 53 49 5140 35 44 3595 90 86 9930 30 30 35 47 35 4516 17 17 74 79 50 6556 47 46 45 53 50 5757 64 36 10 11 14 1490 88 83 98 96 93 6589 91 42 17 1 5 186 84 81 63 70 79 6549 81 102 96 99 106 108107 109 110 45 53 73 8960 80 92 103 105 104 10755 87 100 101 100 103 10632 69 95 106 107 109 10970 70 47 105 106 99 469 12 14 33 27 36 2374 51 48 63 70 36 3754 52 69 78 79 87 8472 60 53 33 42 36 3769 74 86 40 33 16 2340 41 40 45 33 50 3784 85 90 91 90 91 9471 72 59 54 53 66 5741 19 11 29 14 11 218 27 24 4 4 4 480 77 85 57 49 66 6550 58 49 40 48 44 4747 45 41 75 70 77 8827 29 31 15 15 23 1638 42 61 45 61 64 8453 63 64 56 59 65 6596 104 104 63 33 23 16108 107 103 90 95 33 47102 103 93 91 87 85 9052 62 66 36 33 23 1635 31 34 13 15 20 2099 99 98 63 33 50 65~. Excludes medical and law libraries.t Not a member during this year.43
TABLE 14: AVERAGE, MEDIAN, AND BEGINNING PROFESSIONAL SALARIESIN <strong>ARL</strong> UNIVERSITY LIBRARIESSUMMARY OF RANKINGS, FVs 1996-97 TO <strong>1999</strong>-<strong>2000</strong>*Institution Average Salaries Median Salaries Beginning SalariesFY 1997 1998 <strong>1999</strong> <strong>2000</strong> 1997 1998 <strong>1999</strong> <strong>2000</strong> 1997 1998 <strong>1999</strong> <strong>2000</strong>Princeton 15 16 12 12 18 21 16 15 18 30 19 28Purdue 69 51 46 58 57 46 46 57 91 96 93 90Queen's 105Rice 92Rochester 97RutgersSaskatchewan 56South Carolina 96Southern California 21Southern Illinois 49Stanford 2SUNY Albany 78SUNY Buffalo 42SUNY Stony Brook 14Syracuse 95Temple 73Tennessee 40Texas 75TexasA&M 86Texas Tech,Toronto 29Tulane 107Utah 99Vanderbilt 70Virginia 37Virginia Tech 93Washington 54Washington State 94Washington U.~St. Louis 76Waterloo 89Wayne State 50Western Ontario 84Wisconsin 44Yale 12York 34I108 107 11071 66 68103 101 1003 2 263 62 95102 102 7619 15 1360 38 572 1 197 77 7553 48 6317 20 1483 92 8765 84 5050 30 5373 70 4792 91 91110 110 10430 52 7759 60 78101 96 8585 83 9425 22 2390 82 7046 56 5681 85 6986 79 8896 104 10848 44 4298 106 11124 41 6213 17 2239 68 83102 103 106 109 108 109 108 11089 66 75 76 28 32 41 54103 106 108 106 78 61 79 372 2 1 1 9 13 13 1531 25 28 54 109 110 110 11195 97 95 78 91 101 101 9828 26 26 20 14 18 20 2936 62 37 75 29 27 16 136 6 6 7 1 2 3 460 81 67 71 52 61 66 2343 42 34 52 63 79 87 6513 17 20 12 40 53 66 3793 87 86 77 76 79 50 6555 75 83 67 63 61 50 6542 43 33 51 63 61 66 6578 78 71 60 78 49 50 3796 93 94 88 63 70 50 57,110 110 107,94 78 8714 15 22 38 100 103 105 105105 51 59 74 78 42 49 4794 94 92 86 63 79 79 6587 92 100 101 57 70 79 9044 31 24 37 36 33 50 6577 83 82 73 45 53 73 6563 59 61 56 45 49 63 6280 76 78 62 87 90 93 6585 100 102 96 63 79 85 9374 79 96 105 89 92 100 10382 85 76 70 12 15 16 1656 73 89 108 55 69 72 9545 22 39 55 53 46 42 6112 14 15 21 8 8 10 1025 29 56 80 61 78 92 97>I- Excludes medical and law libraries.t Not a member during this year.44
TABLE 15: DISTRIBUTION OF PROFESSIONAL STAFF IN <strong>ARL</strong> UNIVERSITY LIBRARIESBY SALARY AND POSITION, FY <strong>1999</strong>-<strong>2000</strong>*NUMBER OF STAFFPERCENTAGE AT EACH LEVELSALARY INTERVALS5175,000 or more150,000-174,999140,000-149,999130,000-139,999120,000-129,999110,000-119,999100,000-109,99995,000-99,99990,000-94,99985,000-89,99980,000-84,99975,000-79,99970,000-74,99965,000-69,99960,000-64,99955,000-59,99950,000-54,99948,000-49,99946,000-47,99944,000-45,99942,000-43,99940,000-41,99938,000-39,99936,000-37,99934,000-35,99932,000-33,99930,000-31,99929,000-29,99928,000-28,99927,000-27,99926,000-26,99925,000-25,99924,000-24,99923,000-23,99922,000-22,99921,000-21,999Less than 21,000Dir. Assoc. Asst. Branch Subj. Func. Dept. Other Dir. Assoc. Asst. Branch Subj. Func.Dir. Dir. Head Spec. Spec. Head Prof. Dir. Dir. Head Spec. Spec.5 I 5 020 1 18 012 3 1 11 2 012 2 I 11 1 021 3 2 5 19 2 112 6 1 1 11 3 0 013 13 4 1 2 2 1 12 7 2 0 0I 14 6 8 1 3 1 8 3 2 0I 20 10 5 2 1 8 2 1 11 5 1 0 03 19 22 9 1 7 12 5 3 10 11 2 0 I2 30 21 7 :J 7 18 5 2 16 10 1 0 I3 18 30 14 12 20 33 12 3 10 14 3 1 24 13 38 30 14 25 74 19 4 7 18 6 1 32 16 28 49 38 62 125 73 2 9 14 10 4 711 16 58 63 59 156 71 6 8 11 6 78 10 86 75 82 202 160 4 5 17 7 97 8 81 107 121 241 252 4 4 16 10 131 31 62 55 94 148 I 6 6 63 28 63 68 85 185 1 5 6 826 64 68 84 205 5 6 82 29 74 67 77 238 1 6 7 74 14 70 58 58 227 2 3 7 611 66 57 44 249 2 6 65 85 52 36 236 1 8 610 84 51 26 232 2 8 63 54 20 8 216 1 5 21 41 16 11 117 0 4 21 10 1 5 31 0 1 011 2 29 110 2 19 1 03 17 0I 5 1 1 10 0 0 03 2 I 9 0 01 1 0011Dept.Head0OtherProf.0 001 0I 0I 02 05 19 311 314 617 97 56 76 75 94 83 93 92 8I 8I 40 10 1I10 00 000TOTAL* Excludes medical and law libraries.111 184 207 510 1,024 904 1,411 2,770 100 100 100 100 100 100100 10046
TABLE 16: DISTRIBUTION OF PROFESSIONAL STAFF IN <strong>ARL</strong> UNIVERSITY LIBRARIESBY SALARY, SEX, AND POSITION, FY <strong>1999</strong>-<strong>2000</strong>*WomenMenSALARY INTERVALS5175,000 or more150,000·174,999140,000·149,999130,000·139,999120,000·129,999110,000·119,999100,000·109,99995,000·99,99990,000·94,99985,000·89,99980,000·84,99975,000·79,99970,000·74,99965,000·69,99960,000·64,99955,000·59,99950,000·54,99948,000-49,99946,000·47,99944,000·45,99942,000·43,99940,000-41,99938,000·39,99936,000·37,99934,000·35,99932,000·33,99930,000·31,99929,000·29,99928,000·28,99927,000·27,99926,000·26,99925,000·25,99924,000·24,99923,000·23,99922,000·22,99921,000·21,999Less than 20,000Dir. Assoc. Asst. Branch Subj. Func. Dept. Other Dir. Assoc. Asst. Branch Subj.Dir. Dir. Head Spec. Spec. Head Prof. Dir. Dir. Head Spec.3 2 111 9 16 2 1 6 16 2 6 112 1 9 2 27 4 1 5 2 13 5 2 1 10 8 2 16 4 3 2 1 8 2 5 112 3 2 2 2 1 8 7 31 11 11 4 1 4 5 3 2 8 11 52 16 13 2 2 3 13 5 14 8 5 11 14 16 5 8 10 21 6 2 4 14 9 42 5 21 19 8 12 38 11 2 8 17 11 612 14 29 22 23 70 57 2 4 14 20 167 10 36 30 31 109 52 4 6 22 336 8 58 36 44 133 111 2 2 28 395 3 60 61 70 149 179 2 5 21 461 25 33 26 73 102 6 291 17 28 38 59 133 2 11 3519 34 39 62 144 7 302 19 43 50 51 157 10 312 7 40 30 41 160 2 7 308 32 29 32 164 3 343 44 33 25 165 2 416 45 30 19 151 4 393 35 14 6 161 191 21 10 7 93 207 1 3 24 1 36 1 23 56 2 15 414 34 1 1 8 1 12 1 4 31 111Func. Dept. OtherSpec. Head Prof.52 1 111 6 23 7 24 510 12 613 36 839 55 1628 47 1938 69 4951 92 7329 21 4630 26 5229 22 6117 26 8128 17 6728 12 8519 11 7121 7 81 '6 2 556 4 242 71 64'325TOTAL'" Excludes medical and law libraries.54 109 112 326 549 502 924 1,944 57 75 95 184 475402 487 82647
TABLE 17: NUMBER AND AVERAGE SALARIES OF <strong>ARL</strong> UNIVERSITY LIBRARIANSBY POSITION AND SEX, FY<strong>1999</strong>-<strong>2000</strong>*Women Men TotalPosition <strong>Salary</strong> No. <strong>Salary</strong> No. <strong>Salary</strong> No.Director $131,224 54 $123,025 57 $127,014 111Associate Director 82,058 109 86,181 75 83,739 184Assistant Director 74,243 112 76,051 95 75,073 207Head, Branch 55,661 326 60,812 184 57,519 510Functional Specialist 45,643 549 45,790 475 45,711 1024Subject Specialist 48,698 502 51,454 402 49,924 904Dept. Head: Acquisitions 54,485 68 55,337 22 54,693 90Reference 56,568 82 55,134 30 56,184 112Cataloging 54,664 131 55,623 42 54,897 173Serials 51,802 22 55,498 12 53,107 34Documents/Maps 51,735 48 51,399 37 51,589 85Circulation 52,827 65 49,988 19 52,185 84Rare Books/Manuscripts 57,064 51 65,669 39 60,793 90Computer Systems 67,320 25 61,720 52 63,538 77Other 52,205 432 56,775 234 53,811 666Reference: Over 14 years experience 48,776 469 48,609 204 48,725 67310 to 14 years experience 41,817 168 43,909 65 42,401 2335 to 9 years experience 38,864 203 38,248 86 38,681 289Under 5 years experience 33,327 213 34,123 88 33,560 301Cataloging: Over 14 years experience 48,375 331 46,004 135 47,688 46610 to 14 years experience 42,725 88 43,189 58 42,9]0 1465 to 9 years experience 38,101 76 40,343 36 38,821 112Under 5 years experience 33,707 65 33,926 18 33,755 83Other: Over 14 years experience 51,242 137 54,683 60 52,290 19710 to 14 years experience 41,259 58 46,834 19 42,634 775 to 9 years experience 39,326 52 39,466 23 39,369 75Under 5 years experience 34,306 84 34,223 34 34,282 118All Positions $49,954 4,520 $53,129 2,601 $51,113 7,121~. Canadian salaries expressed in U.S. dollars. See Table 32 for salaries of Canadian librarians expressed in Canadian dollars.Excludes medical and law libraries. See Tables 39 and 46 for salaries in medical and law libraries.48
TABLE 18: NUMBER AND AVERAGE YEARS OF EXPERIENCEOF <strong>ARL</strong> UNIVERSITY LIBRARIANSBY POSITION AND SEX, FY <strong>1999</strong>-<strong>2000</strong>*Women Men TotalPosition Years No. Years No. YearsNo.Director 29.0 54 28.8 57 28.9Associate Director 23.7 109 24.4 75 24.0Assistant Director 24.1 112 23.5 95 23.8Head, Branch 20.9 326 20.8 184 20.9Functional Specialist 12.7 549 12.1 475 12.4Subject Specialist 17.5 502 18.4 402 17.91111842075101,024904Dept. Head: Acquisitions 20.4 68 21.3 22 20.6Reference 20.0 82 18.7 30 19.6Cataloging 20.6 131 21.0 42 20.7Serials 18.4 22 20.5 12 19.1Documents/Maps 22.0 48 21.4 37 21.7Circulation 18.3 65 16.3 19 17.8Rare Books/Manuscripts 21.7 51 23.3 39 22.4Computer Systems 18.2 25 16.3 52 17.0Other 18.3 432 19.2 234 18.6901121733485849077666Public Services 13.6 156 13.0 66 13.4Technical Services 14.5 100 14.5 36 14.5Administrative Services 13.2 75 16.9 34 14.3Reference 14.3 1,053 14.8 443 14.4Cataloger 18.3 560 17.0 247 17.92221361091,496807All Positions 17.1 4,520 17.3 2,601 17.17,121>I- Includes Canadian libraries. See Table 33 for comparable figures in Canadian Iibr
TABLE 19: NUMBER AND AVERAGE SALARIES OF <strong>ARL</strong> UNIVERSITYLIBRARIANSBY YEARS OF EXPERIENCE AND SEX, FY <strong>1999</strong>-<strong>2000</strong>*Women Men TotalExperience <strong>Salary</strong> No. <strong>Salary</strong> No. <strong>Salary</strong> No.% ofTotal0- 3 years $35,038 460 $36,805 281 $35,708 7414 - 7 years 38,677 521 41,106 279 39,524 8008 -11 years 43,381 570 44,581 329 43,820 89912 - 15 years 47,354 557 50,692 293 48,505 85016 - 19 years 53,224 508 54,258 272 53,584 78020 - 23 years 54,865 554 58,214 338 56,134 89224 - 27 years 58,688 540 61,924 349 59,958 88928 - 31 years 61,495 437 63,190 253 62,117 69032 - 35 years 60,225 248 69,287 135 63,419 383over 35 years 59,882 125 75,999 72 65,773 19710%11%)13%12%11%13%12%10%5%3%All Positions $49,954 4,520 $53,129 2,601 $51,113 7,121100%* Canadian salaries expressed in U.S. dollars. See Table 34 for salaries in Canadian dollars.Excludes medical and law libraries. See Tables 41 and 48 for salaries in medical and law libraries.50
TABLE 20: AVERAGE SALARIES OF <strong>ARL</strong> UNIVERSITY LIBRARIANSBY POSITION AND YEARS OF EXPERIENCE, FY <strong>1999</strong>-<strong>2000</strong>*Years of Exp:erience0-3 4-7 8-11 12-15 16-19 20-23 24-27Position years years years years years years years28-31 32-35 over 35years years yearsDirector N/A N/A N/A N/A 5137,591 5120,749 5127,240Associate Director $74,202 573,091 76,452 83,255 89,104Assistant Director 70,587 71,614 73,938 75,650 76,448Head, Branch 539,750 543,511 50,627 49,047 56,993 58,901 62,056Functional SpeCialist 37,560 41,028 43,458 47,345 51,637 53,524 53,514Subject Specialist 36,526 39,733 45,193 49,494 50,998 53,549 53,8665127,562 $126,660 $126,83483,508 88,07676,101 74,728 80,96063,869 63,073 74,09156,778 54,178 61,92658,229 57,940 63,441Dept. Head: Acquisitions 43,125 48,644 54,032 54,371 52,377 58,457Reference 42,790 49,338 52,556 56,833 54,308 63,657Cataloging 41,026 46,456 54,312 52,729 57,566 57,848Serials 46,459 54,098 58,319Documents/Maps 39,467 44,153 44,895 55,870 47,917 56,813Circulation 40,357 47,254 48,057 58,922 54,596 58,240Rare Books/Manuscripts 40,309 50,410 58,882 68,034 63,379Computer Systems 49,773 62,395 56,003 62,717 67,810 70,521Other 41,694 42,645 47,719 51,660 54,482 55,018 59,65659,066 63,787 65,57459,318 65,62657,755 61,126 63,87057,776 N/A54,930 55,46043,84666,167 63,00175,958 47,395 N/A59,747 60,826 69,453Public Services 32,983 36,282 38,745 42,025 47,143 52,576 48,071Technical Services 33,142 37,166 41,106 50,305 48,960 50,575 49,762Administrative Services 37,405 42,114 40,461 49,227 54,939 51,777 68,057Reference 32,995 37,186 40,295 43,764 46,388 47,731 49,241Cataloger 32,954 37,475 41,017 44,742 46,827 45,474 46,02553,589 47,711 50,67550,671 53,289 55,84961,479 66,496 66,01751,550 51,360 53,06249,335 53,024 48,624All Positions: Average <strong>Salary</strong> $35,708 $39,524 $43,820 $48,505 $53,584 $56,134 $59,958No, of Positions 741 800 899 850 780 892 889$62,117 $63,419 $65,773690 383 197* Years of experience reflect total professional experience. Canadian salaries expressed in U.s. dollars. Excludes medical and law libraries.N/ A - No pOSitions reported in this category.t <strong>Salary</strong> data are not published when fewer than four individuals are involved.51
TABLE 21: NUMBER AND AVERAGE SALARIES OF <strong>ARL</strong> UNIVERSITY LIBRARIANSBY POSITION AND TYPE OF INSTITUTION, FY <strong>1999</strong>-<strong>2000</strong>'Canadian (13) Private (31)' Public (67) Total (111)Position <strong>Salary</strong> No. <strong>Salary</strong> No. <strong>Salary</strong> No. <strong>Salary</strong> No.Director $77,037 13 $145,416 31 $128,196 67 $127,014 111Associate Director 57,390 21 97,903 41 83,514 122 83,739 184Assistant Director 52,894 16 82,102 79 73,283 112 75,073 207Head, Branch 45,419 35 59,550 160 57.832 315 57,519 510Functional Specialist 38,954 81 49,142 341 44,677 602 45,711 1,024Subject Specialist 41,837 56 51,682 359 49,559 489 49,924 904Dept. Head: Acquisitions 42,247 9 54,333 30 57,101 51 54,693 90Reference 47,793 9 57,166 36 56,783 67 56,184 112Cataloging 43,519 11 56,133 70 55,317 92 54,897 173Serials 1 50,014 13 55,719 20 53,107 34Documents/Maps 43,584 8 48,881 17 53,423 60 51,589 85Circulation 45,227 9 51,245 25 53,907 50 52,185 84Rare Books/Manuscripts 48,370 10 63,489 28 61,730 52 60,793 90Computer Systems 52,834 10 66,998 28 63,799 39 63,538 77Other 46,182 65 55,549 217 54,120 384 53,811 666Reference: Over 14 years experience 42,833 106 48,299 160 50,428 407 48,725 67310 to 14 years experience 37,120 35 44,001 56 43,071 142 42,401 2335 to 9 years experience 34,248 20 40,132 66 38,645 203 38,681 289Under 5 years experience 29,796 26 35,928 71 33,215 204 33,560 301Cataloging: Over 14 years experience 42,281 59 49,996 169 47,390 238 47,688 46610 to 14 years experience 35,495 7 43,553 73 42,985 66 42,910 1465 to 9 years experience 3 40,739 55 37,180 54 38,821 112Under 5 years experience 3 35,447 30 33,241 50 33,755 83Other: Over 14 years experience 44,331 11 52,949 50 52,691 136 52,290 19710 to 14 years experience 33,865 5 43,435 26 43,135 46 42,634 775 to 9 years experience 38,246 4 39,458 28 39,415 43 39,369 75Under 5 years experience 33,946 6 35,729 39 33,537 73 34,282 118All Positions $42,993 639 $53,322 2,298 $51,141 4,184 $51,113 7,121>I- Canadian salaries expressed in U.S. dollars. Tables 31-34 show Canadian salaries in Canadian dollars. Excludes medical and law libraries.( ) Indicates the number of <strong>ARL</strong> libraries in each category.+ Includes George Washington University.t <strong>Salary</strong> data are not published when fewer than four individuals are involved.52
TABLE 22: YEARS OF EXPERIENCE OF <strong>ARL</strong> UNIVERSITY LIBRARIANSBY POSITION AND TYPE OF INSTITUTION, FY <strong>1999</strong>-<strong>2000</strong>"Canadian (13) Private (31)' Public (67) Total (111)Position Years No. Years No. Years No. Years No.Director 28.8 13 28.7 31 29.0 67 28.9 111Associate Director 21.8 21 24.2 41 24.3 122 24.0 184Assistant Direclor 28.1 16 23.4 79 23.5 112 23.8 207Head, Branch 21.8 35 20.7 160 20.8 315 20.9 510Functional Specialist 14.8 81 12.7 341 12.0 602 12.4 1,024Subject Specialist 23.2 56 17.3 359 17.8 489 17.9 904Dept. Head: Acquisitions 19.8 9 19.6 30 21.3 51 20.6 90Reference 23.2 9 19.7 36 19.1 67 19.6 112Cataloging 19.9 11 20.0 70 21.3 92 20.7 173Serials 22.0 1 16.5 13 20.7 20 19.1 34Documents/Maps 21.8 8 17.4 17 23.0 60 21.7 85Circulation 20.3 9 17.3 25 17.7 50 17.8 84Rare Books/Manuscripts 24.3 10 21.6 28 22.4 52 22.4 90Computer Systems 19.7 10 15.0 28 17.7 39 17.0 77Other 19.6 65 18.5 217 18.5 384 18.6 666Reference: Over 14 years experience 24.9 106 24.2 160 23.6 407 24.0 67310 to 14 years experience 12.1 35 12.1 56 11.7 142 11.9 2335 to 9 years experience 7.1 20 6.9 66 7.0 203 7.0 289Under 5 years experience 2.8 26 2.3 71 2.1 204 2.2 301Cataloging: Over 14 years experience 25.5 59 25.1 169 25.2 238 25.2 46610 to 14 years experience 11.1 7 11.6 73 11.8 66 11.7 1465 to 9 years experience 6.7 3 7.0 55 7.0 54 7.0 112Under 5 years experience 1.0 3 2.0 30 2.5 50 2.2 83Other: Over 14 years experience 25.9 11 22.4 50 25.3 136 24.6 19710 to 14 years experience 11.2 5 11.6 26 11.9 46 11.8 775 to 9 years experience 7.3 4 6.8 28 7.0 43 6.9 75Under 5 years experience 2.8 6 2.3 39 2.0 73 2.2 1] 8All Positions 19,6 639 16.8 2,298 16,9 4,184 17.1 7,121* Excludes medical and law libraries.() Indicates the number of <strong>ARL</strong> libraries in each category.t Includes George Washington University53
TABLE 23: NUMBER AND AVERAGE SALARIES OF <strong>ARL</strong> UNIVERSITY LIBRARIANSBY POSITION AND SIZE OF PROFESSIONAL STAFF, FY <strong>1999</strong>-<strong>2000</strong>*Staff Over 110 (7)' Staff 75-110 (24) Staff 50-74 (35) Staff 24-49 (45)Position <strong>Salary</strong> No. <strong>Salary</strong> No. <strong>Salary</strong> No. <strong>Salary</strong> No.Director $144,983 7 $144,587 24 $128,318 35 $113,831 45Associate Director 89,890 22 91,841 60 80,247 53 74,832 49Assistant Director 74,187 21 81,674 53 73,643 73 71,291 60Head, Branch 62,642 90 61,956 153 54,723 138 51,674 129Functional Specialist 48,351 207 46,978 299 44,571 320 42,881 198Subject Specialist 51,962 208 51,599 322 48,325 251 45,353 123Dept. Head: Acquisitions 65,369 6 58,117 19 51,730 29 53,494 36Reference 61,067 12 59,411 22 55,390 39 53,654 39Cataloging 61,790 24 56,833 57 52,812 40 51,197 52Serials N/A 52,987 9 55,194 11 51,544 14°Documents/Maps 56,987 7 55,135 19 49,389 25 50,113 34Circulation 54,404 12 55,412 19 51,945 27 49,050 26Rare Books/Manuscripts 62,177 8 71,386 13 58,777 30 58,528 39Computer Systems 82,033 7 67,407 18 61,149 23 58,568 29Other 55,478 81 58,359 219 51,171 201 50,171 165Reference: Over 14years experience 50,167 76 50,515 199 49,132 181 46,240 21710 to 14 years experience 45,183 24 43,929 72 42,825 65 39,562 725 to 9 years experience 40,336 21 39,713 84 38,998 87 37,143 97Under 5 years experience 34,296 26 34,439 111 33,134 77 32,595 87Cataloging: Over 14 years experience 51,142 92 48,827 147 45,742 127 45,308 10010 to 14 years experience 44,882 34 44,886 54 39,735 33 40,148 255 to 9 years experience 42,621 26 38,458 34 38,161 26 36,156 26Under 5 years experience 36,581 14 34,922 28 32,981 19 31,138 22Other: Over 14 years experience 55,482 26 53,227 71 51,898 57 49,333 4310 to 14 years experience 42,368 15 43,604 15 42,482 31 42,270 165 to 9 years experience 42,480 12 40,739 21 36,735 27 39,703 15Under 5 years experience 35,172 22 35,268 40 33,749 35 32,360 21All Positions $52,799 1,100 $52,961 2,182 $50,167 2,060 $48,901 1,779~'Canadian salaries expressed in U.S. dollars. For average Canadian salaries (expressed in U.S. dollars) refer to Table 21; Tables 31-34 showCanadian salaries in Canadian dollars. Excludes medical and law libraries. No <strong>ARL</strong> library has fewer than 24 professional staffmembers.( ) Indicates the number of <strong>ARL</strong> libraries in each category.tIn 1995-96 and earlier, the first column of this table reported staff over 124; in 1996-98 over 120; in 1998-99 over 115; and, this year, over 110.N/ A - No positions reported in this category.54
TABLE 24: YEARS OF EXPERIENCE OF <strong>ARL</strong> UNIVERSITY LIBRARIANSBY POSITION AND SIZE OF PROFESSIONAL STAFF, FY <strong>1999</strong>-<strong>2000</strong>*Staff Over 110 (7)' Staff 75-110 (24) Staff 50-74 (35) Staff 24-49 (45)1Position Years No. Years No. Years No. Years No.Director 25.6 7 31.1 24 27.9 35 29.1 45Associate Director 23.2 22 23.8 60 24.2 53 24.2 49Assistant Director 24.9 21 22.1 53 23.9 73 24.9 60Head, Branch 22.0 90 21.4 153 20.8 138 19.5 129Functional Specialist 11.6 207 12.8 299 12.7 320 12.3 198Subject Specialist 18.0 208 18.3 322 18.1 251 16.6 123Dept. Head: Acquisitions 21.3 6 19.3 19 18.0 29 23.2 36Reference 19.6 12 22.1 22 19.6 39 18.3 39Cataloging 20.8 24 21.7 57 20.6 40 19.7 52Serials N/A 0 20.6 9 18.4 11 18.8 14Documents/Maps ·22.6 7 22.2 19 21.2 25 21.7 34Circulation 17.7 12 21.5 19 16.7 27 16.5 26Rare Books/Manuscripts 19.8 8 20.4 13 25.7 30 21.0 39Computer Systems 15.0 7 14.6 18 17.7 23 18.3 29Other 19.5 81 19.6 219 17.3 201 18.5 165Reference: Over 14 years experience 24.2 76 24.0 199 23.9 181 23.9 21710 to 14 years experience 12.3 24 11.9 72 11.8 65 11.8 725 to 9 years experience 7.2 21 7.0 84 6.9 87 7.0 97Under 5 years experience 2.1 26 2.2 111 2.4 77 2.2 87Cataloging: Over 14 years experience 24.2 92 25.6 147 25.3 127 25.4 10010 to 14 years experience 11.5 34 11.9 54 11.6 33 11.7 255 to 9 years experience 7.1 26 7.1 34 7.1 26 6.6 26Under 5 years experience 2.1 14 2.6 28 2.5 19 1.7 22Other: Over 14 years experience 22.8 26 24.3 71 24.1 57 26.6 4310 to 14 years experience 11.5 15 12.6 15 11.7 31 11.4 165 to 9 years experience 6.6 12 7.0 21 6.8 27 7.4 15Under 5 years experience 2.3 22 2.1 40 2.0 35 2.4 21All Positions 16.8 1,100 17.2 2,182 17.0 2,060 17.3 1,779,. Excludes medical and law libraries.() Indicates the number of <strong>ARL</strong> libraries in each category.t In 1995~96 and earlier, the first column of this table reported staff over 124; in ]996-98, over 120; in 1998-99, over 115; and this year, over 110.:\: No <strong>ARL</strong> library has fewer than 24 professional staff members.N/ A -No positions reported in this category.55
TABLE 25: AVERAGE SALARIES OF <strong>ARL</strong> UNIVERSITY LIBRARIANS BY POSITION AND GEOGRAPHIC REGION,FY <strong>1999</strong>-<strong>2000</strong>*NortheastNorth CentralSouthWestCanadaTotalPositionNewEngland(8)MiddleAtlantic(14)EastN.Central(17)WestN.Central(7)SouthAtlantic(18)EastS.Central(5)WestS.Central(9)Mountain(7)Pacific(13)(13)(111)DirectorAssociate DirectorAssistant DirectorHead, BranchFunctional SpecialistSubject Specialist5134,96096,70983,34165,58450,85753,841$152,05094,67081,92559,55945,42451,224$133,80683,57775,24557,84342,37548,8875132,60491,31377,12650,69946,04547,6845137,17585,53574,76755,64346,84045,5735121,56470,11565,44853,17640,02442,214$117,26773,07669,30252A9940,64240,222$116,88578,66972,22360,61246,90048,1125133,47493,74686,73762,44852,81359,063577,03757,39052,89445,41938,95441,8375127,01483,73975,07357,51945,71149,924Dept. Head: AcquisitionsReferenceCatalogingSerialsDocuments/MapsCirculationRare Books/ManuscriptsComputer SystemsOther63,57159,22461,26060,62055,35264,59579,13356,39955,08161,06959,36049,68550,96556,08569,50866,04655,86957,08158,11956,48548,47452,36154,86963,78958,69954,32658,00154,21656,14152,76250,80859,66652,54955,60454,22252,01948,55848,37453,00260,63156,98653,82948,97850,40242,56545,91049,59851,77753,56850,33845,62545,54349,65658,36246,63954,99556,44052,11652,06450,54660,82471,32152,63256,87958,88656,13158,86362,24052,65168,94369,35462,75542,24747,79343,51941,07443,58445,22748,37052,83446,18254,69356,18454,89753,10751,58952,18560,79363,53853,811Reference:Over 14 years experience10 to 14 years experience5 to 9 years experienceUnder 5 years experience53,54347,21643,10936,71050,96543,10340,22534,73147,42642,31538,95233,74645,01538,03134,93331,68944,54839,96938,53534,77247,85239,22235,96429,92342,94739,66635,26831,95249,87340,89038,96332,54257,91149,30841,26734,80042,83337,12034,24829,79648,72542,40138,68133,560Cataloging:Over 14 years experience10 to 14 years experience5 to 9 years experienceUnder 5 years experience53,37444,82644,07537,37948,12844,12439,01135,80044,40442,51438,03034,05047,46739,07732,39843,65940,29637,76632,90843,36139,95633,39929,53839,40537,26035,43632,32547,57442,21037,03356,32751,85140,83833,42742,28135,49547,68842,91038,82133,755Other:Over 14 years experience10 to 14 years experience5 to 9 years experienceUnder 5 years experience55,76043,85636,01953,72642,80237,76032,45153,62843,78641,87334,80353,99631,62844,65344,32439,11633,45249,49039,73152,98439,48835,32633,59449,28642,18458,65347,61943,66342,05844,33133,86538,24633,94652,29042,63439,36934,282All Positions:Average <strong>Salary</strong>No. of Staff$54,567821$53,4621,021$50,5711,170$49,605404$49,7071,055$46,080261$45,878493$51,254386$58,605871$42,993639$51,1137,121* Canadian salaries expressed in U.s. dollars. Excludes medical and law libraries.() Indicates number of <strong>ARL</strong> libraries included.t <strong>Salary</strong> data are not published when fewer than four individuals are involved.56
<strong>ARL</strong> UNIVERSITY LIBRARIES BY GEOGRAPHIC REGION*RegionNo. of Libs.<strong>ARL</strong> University Libraries IncludedStateslProvinces IncludedNortheast1. New England(8)Boston, Brown, Connecticut Dartmouth, Harvard, Massachusetts Institute of Technology,Massachusetts, YaleConn., Mass., Me., N.H., R.I., Vt.2. Middle Atlantic(14)Columbia; Cornell; New York; Pennsylvania; PelU1syivania State; Pittsburgh; Princeton; Rochester;Rutgers; State University of New York: Albany, Buffalo, Stony Brook; Syracuse; TempleN.j., N.Y., Pa.North Central3. East North Central(17)Case Western Reserve, Chicago, Cincinnati, Illinois-Chicago, Illinois-Urbana, Indiana, Kent State,Michigan, Michigan State, Notre Dame, Northwestern, Ohio University, Ohio State, Purdue,Southern Illinois, Wayne State, WisconsinIll., Ind., Mich., Ohio, Wis.4. West North CentralSouth(7)Iowa, Iowa State, Kansas, Minnesota, Missouri, Nebraska, Washington U.-St. LouisIowa, Kan., Minn., Mo., Neb.,N. Dak., S. Dak.5. South Atlantic(18)Delaware, Duke, Emory, Florida, Florida State, Georgia, Georgia Tech., Georgetown, GeorgeWashington, Howard, Johns Hopkins, Maryland, Miami, North Carolina, North Carolina State,South Carolina, Virginia, Virginia TechDel., D.C., Fla., Ga., Md., N.C., S.c., Va.,W.Va.6. East South Central(5)Alabama, Auburn, Kenh.1cky, Tennessee, VanderbiltAla., Ky., Miss., Tenn.7. West South Central(9)Houston, Louisiana State, Oklahoma, Oklahoma State, Rice, Texas, Texas A&M, Texas Tech,TulaneArk., La., Okla., Tex.West8. Mountain(7)Arizona, Arizona State, Brigham Young, Colorado, Colorado State, New Mexico, UtahAriz., Colo., Idaho, Mont., Nev.,N. Mex., Utah, Wyo.9. Pacific(13)University of California: Berkeley, Davis, Irvine, Los Angeles, Riverside, San Diego, Santa Barbara;Hawaii; Oregon; Southern California; Stanford; Washington; Washington StateAlaska, Calif., Hawaii, Ore., Wash.Canada(13)Alberta, British Columbia, Guelph, Laval, McGill, McMaster, Manitoba, Queen's, Saskatchewan,Toronto, Waterloo, Western Ontario, YorkAlta., B.c., Man., N. Br., Newf.,N.5., Ont., P.E.L, Que., Sask.*Regions are based on the classification used by the U. S. Bureau of the Census in tabulations of the Current Population <strong>Survey</strong>.57
u.s. <strong>ARL</strong> UNIVERSITY LIBRARIESTables 26-30
TABLE 26: AVERAGE SALARIES OF U.S. <strong>ARL</strong> UNIVERSITY LIBRARIANSBY POSITION AND YEARS OF EXPERIENCE, FY <strong>1999</strong>-<strong>2000</strong>*Years of ExperiencePosition 0-3 4-7 8 -11 12-15 16-19 20-23 24-27 28-3132-35 Over 35Director N/A N/A N/A N/A 5152,125 5126,224 5133,740 5135,783Associate Director $74,202 $ 79,137 78,792 88,405 90,425 88,243Assistant Director 70,587 73,550 75,135 75,650 78,109 80,914Head, Branch 540,878 543,511 51,090 49,887 57,650 60,646 62,756 65,698Functional Specialist 37,942 41,474 44,589 47,739 52,252 54,561 54,879 57,884Subject Specialist 36,526 40,038 45,224 49,981 51,454 54,268 55,585 59,934$128,869 5136,36489,12378,205 86,63464,397 74,09155,144 61,92660,071 64,119Dept. Head: Acquisitions 43,125 48,644 54,032 57,738 54,567 60,369 59,066Reference 42,790 49,338 52,556 56,833 57,796 64,908 60,759Cataloging 41,625 46,456 54,651 54,152 58,548 58,989 58,223Serials 46,459 55,726 58,319 57,776Documents/Maps 44,153 46,087 56,861 50,194 58,420 54,930Circulation ' . 40,357 47,254 49,548 58,922 54,967 62,301Rare Books/Manuscripts 40,309 53,466 60,340 69,437 64,501 69,165Computer Systems 49,773 62,395 57,477 64,710 70,397 72,165 75,958Other 42,327 43,155 48,217 52,538 54,870 56,304 61,088 61,33765,310 65,57465,62661,126 63,870N/A55,46043,84665,378N/A N/A61,717 69,453Public Services 33,122 36,502 39,525 42,191 47,143 53,461 48,861 54,425Technical Services 33,247 36,650 41,324 50,305 48,960 52,320 49,762 51,385Administrative Services 37,644 42,594 40,684 50,215 54,939 51,777 68,806 62,906Reference 33,311 37,625 40,822 44,802 47,224 48,970 50,629 52,819Cataloger 33,345 37,674 41,359 44,970 47,457 46,352 46,666 51,05348,138 50,67555,165 55,84966,496 66,01752,265 55,71853,333 48,547All Positions $36,039 $39,884 $44,399 $49,219 $54,398 $57,640 $61,716 $64,285$65,147 $66,555* Excludes Canadian libraries. Excludes medical and law libraries.t <strong>Salary</strong> data are not published when fewer than four individuals are involved.N/ A - No positions were reported in this category.61
TABLE 27: NUMBER AND AVERAGE SALARIES OFMINORITY U.S. <strong>ARL</strong> UNIVERSITY LIBRARIANS"BY POSITION AND SEX, FY <strong>1999</strong>-<strong>2000</strong>*WomenMenTotalPosition <strong>Salary</strong> No. <strong>Salary</strong> No.<strong>Salary</strong>No.Director 2 3Associate Director 8 2Assistant Director $80.146 8 $73.659 5Head, Branch 55.987 38 68,676 12Functional Specialist 43,469 56 46,310 40Subject Specialist 47,496 70 54,580 44$124.679 587,486 1077,651 1359,032 5044,653 9650,230 114Dept. Head: Acquisitions 4 1Reference 5 1Cataloging 9 1Serials 1 N/A 0Documents/Maps 55,719 5 N/A 0Circulation 45,919 5 52,992 2Rare Books/Manuscripts 2 2Computer Systems 2 4Other 51,144 41 58,808 1855,253 552,931 649,364 10155,719 547,940 771,788 457,611 653,482 59Reference: Over 14 years experience 53,413 49 47,713 1010 to 14 years experience 44,970 24 44,192 55 to 9 years experience 41,436 35 41,610 11Under 5 years experience 33,272 24 34,772 1152,447 5944,836 2941,478 4633,744 35Cataloging: Over 14 years experience 48,914 52 50,944 2010 to 14 years experience 42,736 18 46,578 55 to 9 years experience 16 1Under 5 years experience 33,381 18 34,813 349,478 7243,571 2340,230 1733,586 21Other: Over 14 years experience 47,582 10 50,512 510 to 14 years experience 4 25 to 9 years experience 11 2Under 5 years experience 1548,558 1542,337 641,524 1332,991 16All Positions $47,730 532 $52,577 211$49,107 743* Excludes Canadian libraries. Excludes medical and law libraries.t <strong>Salary</strong> data are not published when fewer than four individuals are involved in either category.N/ A ~ No positions were reported in this category.62
TABLE 28: NUMBER AND AVERAGE YEARS OF EXPERIENCEOF MINORITY U.S. <strong>ARL</strong> UNIVERSITY LIBRARIANSBY POSITION AND SEX, FY <strong>1999</strong>-<strong>2000</strong>*Women Men TotalPosition Years No. Years No. YearsNo.Director 29.0 2 33.7 3 31.8Associate Director 23.5 8 17.5 2 22.3Assistant Director 27.6 8 18.8 5 24.2Head, Branch 20.9 38 23.4 12 21.5Functional Specialist 11.7 56 10.9 40 11.3Subject Specialist 16.1 70 17.9 44 16.8510135096114Dept. I-lead: Acquisitions 24.3 4 29.0 1 25.2Reference 12.4 5 19.0 13.5Cataloging 14.7 9 30.0 1 16.2Serials 11.0 1 N/A 0 11.0Documents/Maps 18.8 5 N/A 0 18.8Circulation 20.0 5 11.5 2 17.6Rare Books/Manuscripts 29.5 2 15.0 2 22.3Computer Systems 15.5 2 15.3 4 15.3Other 17.5 41 16.7 18 17.25610574659Public Services 11.9 23 15.0 5 12.5Technical Services 8.9 12 24.5 2 II.!Administrative Services 12.0 5 12.0 3 12.0Reference 13.2 132 10.4 37 12.6Cataloger 17.3 104 20.2 29 17.928148169133All Positions 15.6 532 15.9 211 15.7743~"Exc1udes Canadian libraries. Excludes medical and law libraries.N / A - No positions were reported in this category.63
TABLE 29: NUMBER AND AVERAGE SALARIES OFU.S. <strong>ARL</strong> UNIVERSITY LIBRARIANSBY YEARS OF EXPERIENCE AND SEX, FY <strong>1999</strong>-<strong>2000</strong>"Women Men Total % ofExperience <strong>Salary</strong> No. <strong>Salary</strong> No. <strong>Salary</strong> No. Total0-3years $35,343 440 $37,203 263 $36,039 703 11/04-7years 39,004 489 41,507 265 39,884 754 12%8 - 11 years 44,006 525 45,064 310 44,399 835 13%12 - 15 years 48,274 497 50,932 274 49,219 771 12%16 -19 years 54,114 468 54,917 256 54,398 724 11%20 - 23 years 56,326 482 59,711 306 57,640 788 12%24 - 27 years 60,288 481 63,940 309 61,716 790 12%28 - 31 years 63,576 375 65,498 219 64,285 594 9%32 - 35 years 61,172 221 72,720 116 65,147 337 5%over 35 years 60,234 116 77,030 70 66,555 186 3%All Positions $50,693 4,094 $54,007 2,388 $51,914 6,482 100%~-Excludes Canadian libraries. Excludes medical and law libraries.TABLE 30: NUMBER AND AVERAGE SALARIES OF MINORITYU.S. <strong>ARL</strong> UNIVERSITY LIBRARIANSBY YEARS OF EXPERIENCE AND SEX, FY <strong>1999</strong>-<strong>2000</strong>*Women Men Total % ofExperience <strong>Salary</strong> No, <strong>Salary</strong> No. <strong>Salary</strong> No. Total() - 3 years $34,080 67 $39,087 36 $35,830 103 14%4 -7 years 39,707 78 43,467 25 40,620 103 14%8 - 11 years 43,598 81 47,502 30 44,653 111 15%12 - 15 years 47,255 80 56,520 22 49,253 102 14%16 -19 years 49,732 38 52,733 21 50,800 59 8%20 - 23 years 53,442 44 56,378 15 54,188 59 8%24 - 27 years 60,799 49 58,857 17 60,299 66 9%28 - 31 years 57,679 43 62,423 24 59,378 67 9%32 - 35 years 58,364 36 66,327 8 59,812 44 6%over 35 years 56,159 16 73,009 13 63,712 29 4%All Positions $47,730 532 $52,577 211 $49,107 743 100%*Excludes Canadian libraries. Excludes medical and law libraries.64
CANADIAN <strong>ARL</strong> UNIVERSITY LIBRARIESTables 31-34
TABLE 31: FILLED POSITIONS; AVERAGE, MEDIAN, AND BEGINNINGPROFESSIONAL SALARIES; AND AVERAGE YEARS OF PROFESSIONAL EXPERIENCEIN CANADIAN <strong>ARL</strong> UNIVERSITY LIBRARIES, FY <strong>1999</strong>-<strong>2000</strong>*FilledAveraggPositions Average Salaries Median Salaries Beginning Salaries Yrs. EXj1.Institution FY <strong>2000</strong> FY <strong>1999</strong> FY <strong>2000</strong> FY <strong>1999</strong> FY <strong>2000</strong> FY <strong>1999</strong>' FY <strong>2000</strong> FY <strong>2000</strong>Alberta t 50 $61,769 $64,415 $57,596 $63,886 $33,356 $35,524 18.3British Columbia t 65 66,988 70,232 63,486 64,575 34,730 34,731 21.6Guelph 25 64,546 62,760 66,821 62,337 38,235 36,723 19.5Laval t 57 61,186 59,469 58,768 59,003 33,690 33,690 22.9McGill t 52 60,542 62,355 59,021 62,045 34,000 34,000 20.3McMaster t 24 61,733 60,517 59,424 60,288 34,058 34,058 19.8Manitob
TABLE 32: NUMBER AND AVERAGE SALARIES OFCANADIAN <strong>ARL</strong> UNIVERSITY LIBRARIANSBY POSITION AND SEX, FY <strong>1999</strong>-<strong>2000</strong>*WomenMenPosition <strong>Salary</strong> No. <strong>Salary</strong> No.Total<strong>Salary</strong>No.Director $120,958 6 $112,399 7Associate Director 85,864 14 88,301 7Assistant Director 79,920 9 79,841 7Head, Branch 69,197 25 67,096 10Functional Specialist 60,204 36 57,735 45Subject Specialist 62,219 29 64,225 27$116,350 1386,676 2179,886 1668,597 3558,833 8163,186 56Dept Head: Acquisitions 63,566 7 64,643 2Reference 6 3Cataloging 66,326 10 59,728 1Serials 1 N/A 0Documents/Maps 5 3Circulation 68,307 9 N/A 0Rare Books/Manuscripts 75,861 6 68,842 4Computer Systems 2 8Other 70,776 50 66,322 1563,805 972,181 965,726 1165,825 868,307 973,053 1079,796 1069,749 65Reference: Over 14 years experience 64,797 82 64,328 2410 to 14 years experience 32 35 to 9 years experience 51,281 15 53,058 5Under 5 years experience 43,061 18 49,368 864,691 10656,063 3551,725 2045,002 26Cataloging: Over 14 years experience 65,791 36 60,828 2310 to 14 years experience 65 to 9 years experience 2 1Under 5 years experience 263,857 5953,609 733Other: Over 14 years experience 71,384 6 61,634 510 to 14 years experience 51,146 5 N/A 05 to 9 years experience 57,763 4 N/A 0Under 5 years experience 51,375 3 51,163 366,952 1151,146 557,763 451,269 6All Positions $64,706 426 $65,384 213$64,932 639>I- Excludes Canadian medical and law libraries. See Tables 39 find 46 for salaries in medical and law libraries.Salaries expressed in Canadian dollars.t<strong>Salary</strong> data are not published when fewer than four individuals are involved in either category.N/ A - No positions were reported in this category.70
TABLE 33: NUMBER AND AVERAGE YEARS OF EXPERIENCEOF CANADIAN <strong>ARL</strong> UNIVERSITY LIBRARIANSBY POSITION AND SEX, FY <strong>1999</strong>-<strong>2000</strong>*WomenMenTotalPosition Years No. Years No. YearsNo.Director 30.5 6 27.3 7Associate Director 20.9 14 23.6 7Assistant Director 26.9 9 29.6 7Head, Branch 22.2 25 20.9 10Functional Specialist 15.2 36 14.4 45Subject Specialist 20.7 29 26.0 2728.821.828.121.814.823.2132116358156Dept. Head: Acquisitions 20.7 7 16.5 2Reference 23.3 6 23.0 3Cataloging 19.3 10 26.0 1Serials 22.0 1 N/A 0Documents/Maps 23.2 5 19.3 3Circulation 20.3 9 N/A 0Rare Books/Manuscripts 24.8 6 23.5 4Computer Systems 14.0 2 21.1 8Other 20.7 50 16.1 1519.823.219.922.021.820.324.319.719.69911189101065Public Services 15.7 7 18.3 4Technical Services 16.5 4 18.0 2Administrations 12.0 7 9.0 2Reference 17.5 147 17.7 40Cataloger 21.9 46 23.0 2616.617.011.317,622.3116918772All Positions 19.4 426 19.9 213 19.6639>!- Excludes Canadian medical and law libraries. See Tables 40 and 47 for figures in medical and law libraries.N / A ~ No positions were reported in this category.71
TABLE 34: NUMBER AND AVERAGE SALARIES OFCANADIAN <strong>ARL</strong> UNIVERSITY LIBRARIANSBY YEARS OF EXPERIENCE AND SEX, FY <strong>1999</strong>-<strong>2000</strong>*ExperienceWomen Men Total<strong>Salary</strong> No. <strong>Salary</strong> No. <strong>Salary</strong> No.%ofTotal0-3 years4 -7 years8 - 11 years12 - 15 years16 -19 years20 - 23 years24 - 27 years28 - 31 years32 - 35 yearsover 35 years$42,772 20 $46,810 18 $44,68550,859 32 50,596 14 50,77954,516 45 55,426 19 54,78660,007 60 71,340 19 62,73364,660 40 66,029 16 65,05168,090 72 66,307 32 67,54168,944 59 70,000 40 69,37173,864 62 72,987 34 73,55379,246 27 72,988 19 76,6619 2 79,35038 5.9%46 7.2%64 10.0%79 12.4%56 8.8%104 16.3%99 15.5%96 15.0%46 7.2%11 1.7%All Positions$64,706 426 $65,384 213 $64,932639 100.0%*Excludes Canadian medical and law libraries. See Tables 41 and 48 for salaries in medical and law libraries.Salaries expressed in Canadian dollars.t <strong>Salary</strong> data are not published when fewer than four individuals are involved in either category.72
<strong>ARL</strong> UNIVERSITY MEDICAL LIBRARIESTables 35-41
TABLE 35: FILLED POSITIONS; AVERAGE, MEDIAN, BEGINNING PROFESSIONALSALARIES; AND AVERAGE YEARS OF PROFESSIONAL EXPERIENCE<strong>ARL</strong> UNIVERSITY MEDICAL LIBRARIES, FY <strong>1999</strong>-<strong>2000</strong>"Filled Average Median Beginning AverageInstitution Positions <strong>Salary</strong> <strong>Salary</strong> <strong>Salary</strong> Yrs. Exp.Alabama 2 26,000 12.5.Alberta 5 40,221 39,560 23,521 14.8Arizona 17 47,687 47,841 34,921 18.1Boston University 7 46,667 47,341 28,000 11.7British Columbia 14 39,864 40,758 22,996 19.4California, Davis" 9 59,772 60,636 32,292 17.9California, Irvine 3 32,292 22.0California, Los Angeles 16 59,960 66,780 32,292 19.7California, San Diego 7 56,115 56,844 32,292 16.3Case WeSlNI1 Reserves 8 46,228 46,067 30,000 22.8Cincinnati 23 46,309 41,820 25,000 17.2Columbia 5 46,264 46,650 37,500 6.8Connecticut 21 51,218 48,840 43,031 10.1Cornell 8 61,314 55,000 37,500 23.0Dartmouth' 10 42,425 41,744 31,200 12.6Duke 17 46,542 45,150 30,550 21.2Emory" 13 45,244 43,550 30,000 16.6Florida 14 39,542 39,294 30,000 15.4George \'Vashington 14 42,356 40,011 32,000 H2Georgeto\vn 8 44,143 42,000 38,000 9.1B.arvard 31 53,473 49,638 35,200 9.5HO\v
TABLE 35: FILLED POSITIONS; AVERAGE, MEDIAN, BEGINNING PROFESSIONALSALARIES; AND AVERAGE YEARS OF PROFESSIONAL EXPERIENCE<strong>ARL</strong> UNIVERSITY MEDICAL LIBRARIES, FY <strong>1999</strong>-<strong>2000</strong>"InstitutionFilledPositionsAverage<strong>Salary</strong>Median<strong>Salary</strong>Beginning<strong>Salary</strong>AverageYrs. Exp.Ncvv York University1956,34052,55038,00011.8North Carolina2445A5943,65431,40017.3North,vcstern1543A9039,97432,00011.3Ohio University329,50017.0Ohio State1343,07543,50530,00011.2Oklahoma839,67940,26921,00011.6Oklahoma State230,00024.5PGnnsylvanin1444,93046,06834,00015.9Pennsylvania Slate546,9]148,60033,50016.8Pittsburgh2043,55840,32133,00012.7Queen's t533,82135,65421,18817.0RochesterSnskatchc\van ,17239,70939,91831,50020,58912.915.0South CarolinaSouthern California51536,466U/A35,606U/A30,00035,50712.018.3Southern Illinois ~430,00017.8Stanford1258,82749,65438,00017.7SUNY Buffalo'!742,75844,18330,00014.2SUNY Stony Brook1358,44456,65040,00013.4Temple1042,95042,57732,50020.5TcxasA&M1143,57642,88532,00018.0Texas Tcch~, TorontoTulane1916743,82243,84642,85339,88946,81541,81431,99222,71131,50018.111.422.1Utah939,09139,88028,00014.9Vanderbilt1845,67545,05928,OOD11.7Virginia1348,05046,25030,00015.5Washington2051,70246,18830,60018.9Washington U.-St. Louis1545,01140,05133,47118.5Wayne StateWeslern Ontario ,6736,89633,35]36,14834,12034,00027,26611.514.1\t\lisronsin1645,37339,02530,63615.8Yale1148,74347,74535,70013.7~Dircctors arc induded in figures for average years of experience and filled positions, but not in eitlwr the average or median salary statistic.I Cmadian salaries expressed in U.S. dollars.1 <strong>Salary</strong> data arc not published when fewer than four individuals are involved.~ See Footnotes.75
TABLE 36: BEGINNING PROFESSIONAL SALARIESIN <strong>ARL</strong> UNIVERSITY MEDICAL LIBRARIESRANK ORDER TABLE, FY <strong>1999</strong>-<strong>2000</strong>'Rank Institution <strong>Salary</strong> Rank Institution <strong>Salary</strong>1 CClimecticut $43,031 36 W
TABLE 37: MEDIAN PROFESSIONAL SALARIESIN <strong>ARL</strong> UNIVERSITY MEDICAL LIBRARIESRANK ORDER TABLE, FY <strong>1999</strong>-<strong>2000</strong>*RankInstitution <strong>Salary</strong> Rank Institution<strong>Salary</strong>12345678910111213141516171819202122232425262728293031California, Los Angeles $66,780 32 Ohio StateCalifornia, Davis 60,636 33 MichiganCalifornia, San Diego 56,844 34 TexasA&MSUNY Stony Brook 56,650 35 TempleCornell 55,000 36 McMaster tNew York University 52,550 37 GeorgetownJohns Hopkins 50,210 38 CincinnatiStanford 49,654 39 Tulane tHarvard 49,638 40 DartmouthKansas 49,425 41 British Columbia tIowa 49,255 42 PittsburghNew Mexico 49,105 43 OklahomaConnecticut 48,840 44 Washington U.-St. LouisPennsylvania State 48,600 45 George WashingtonArizona 47,841 46 NebraskaYale 47,745 47 NorthwesternMiami 47,483 48 RochesterBoston University 47,341 49 Texas TechToronto 46,815 50 UtahColumbia 46,650 51 Alberta tVirginia 46,250 52 FloridaWashington 46,188 53 WisconsinPennsylvania 46,068 54 Illinois, ChicagoCase Western Reserve 46,067 55 MissouriDuke 45,150 56 HowardVanderbilt 45,059 57 McGill tKentucky 44,311 58 Wayne StateSUNY Buffalo 44,183 59 Queen's tMinnesota 43,742 60 South CarolinaNorth Carolina 43,654 61 Western Ontario tEmory 43,550 62 Manitoba t$43,50542,94542,88542,57742,07142,00041,82041,81441,74440,75840,32140,26940,05140,01140,00039,97439,91839,88939,88039,56039,29439,02538,76338,01137,50236,97136,14835,65435,60634,12027,102,. Salaries of directors are not included in th~ calculation of medians. Alabama; California, Irvine; Ohio University; Oklahoma State;Saskatchewan; and Southern Illinois are not ranked because they reported fewer than four individuals.t Canadian salaries expressed in U.S. dollars.77
TABLE 38: AVERAGE PROFESSIONAL SALARIESIN <strong>ARL</strong> UNIVERSITY MEDICAL LIBRARIESRANK ORDER TABLE, FY <strong>1999</strong>-<strong>2000</strong>*RankInstitution <strong>Salary</strong> Rank Institution<strong>Salary</strong>12345678910111213141516171819202122232425262728293031Cornell $61,314 32 PennsylvaniaCalifornia, Los Angeles 59,960 33 MichiganCalifornia, Davis 59,772 34 Illinois, ChkagoStanford 58,827 35 GeorgetownSUNY Stony Brook 58,444 36 Toronto tNew York University 56,340 37 Texas TechCalifornia, San Diego 56,115 38 NebraskaJohns Hopkins 54,023 39 TexasA&MHarvard 53,473 40 PittsburghWashington 51,702 41 NorthwesternMiami 51,617 42 Ohio StateConnecticut 51,218 43 TempleNew Mexico 50,982 44 TulaneIowa 49,667 45 SUNY Buff.loKansas 49,384 46 McMaster tYale 48,743 47 DartmouthVirginia 48,050 48 George WashingtonArizona 47,687 49 McGill tPennsylvania State 46,911 50 Alberta tBoston University 46,667 51 MissouriDuke 46,542 52 British Columbia tCincinnati 46,309 53 RochesterColumbia 46,264 54 OklahomaCase Western Reserve 46,228 55 FloridaKentucky 46,021 56 UtahMinnesota 45,742 57 HowardVanderbilt 45,675 58 Wayne StateNorth Carolina 45,459 59 South CarolinaWisconsin 45,373 60 Queen's tEmory 45,244 61 Western Ontario tWashington U.-St. Louis 45,011 62 Manitoba t$44,93044,57044,30244,14343,84643,82243,65943,57643,55843,49043,07542,95042,85342,75842,60142,42542,35640,84840,22139,91639,86439,70939,67939,54239,09138,73336,89636,46633,82133,35129,682* Salaries of directors are not included in the calculation of averages. Alabama; California; Irvine; Ohio University; Oklahoma State;Saskatchewan; and Southern Illinois are not ranked because they reported fewer than four individuals.t Canadian salaries expressed in U.S. dollars.78
TABLE 39: NUMBER AND AVERAGE SALARIES OF<strong>ARL</strong> UNIVERSITY MEDICAL LIBRARIANSBY POSITION AND SEX, FY <strong>1999</strong>-<strong>2000</strong>*WOlnenMenTotalPosition <strong>Salary</strong> No. <strong>Salary</strong> No.<strong>Salary</strong>No.Head, Medical $87,134 40 $102,136 20Associate Director 65,337 38 66,721 15Assistant Director 56,553 25 55,124 6Head, Branch 50,716 17 57,211 4Functional Specialist 44,652 46 44,892 41Subject Specialist 46,030 37 39,744 10$92,135 6065,729 5356,276 3151,953 2144,765 8744,692 47Dept. Head: Acquisitions 12 3Reference 51,760 25 50,250 10Cataloging 12 2Serials 50,979 5 N/A 0Documents/Maps 1 N/A 0Circulation 14 2Rare Books/Manuscripts 6 3Computer Systems 50,700 11 56,353 8Other 51,634 50 51,652 1445,310 1551,329 3553,708 1450,979 5147,586 1658,211 953,080 1951,638 64Reference: Over 14 years experience 45,603 71 47,771 1510 to 14 years experience 42,182 32 45,405 85 to 9 years experience 37,666 48 36,861 8Under 5 years experience 34,911 48 40,418 945,981 8642,827 4037,551 5635,780 57Cataloging: Over 14 years experience 7 210 to 14 years experience 1 N/A 05 to 9 years experience 7 2Under 5 years experience 37,163 5 N/A 041,561 9142,749 937,163 5Other: Over 14 years experience 44,204 26 44,726 1010 to 14 years experience 40,294 4 N/A 05 to 9 years experience 13 2Under 5 years experience 36,458 14 40,611 544,349 3640,294 439.852 1537.551 19All Positions $49,044 615 $53,616 199$50,162 814,. Canadian salaries expressed in U.S. dollars.t <strong>Salary</strong> data are not published when fewer than four individuals are involved in either category.N / A - No positions were reported in this category.79
TABLE 40: NUMBER AND AVERAGE YEARS OF EXPERIENCEOF <strong>ARL</strong> UNIVERSITY MEDICAL LIBRARIANSBY POSITION AND SEX, FY <strong>1999</strong>-<strong>2000</strong>WomenMenTotalPosition Years No. Years No. YearsNo.Head, Medical 25,0 40 25.6 20Associate Director 23.5 38 18.6 15Assistant Director 18,2 25 15,2 6Head, Branch 19,2 17 24,0 4Functional Specialist 10.8 46 8.6 41Subject Specialist 16.1 37 8.7 1025.222.117.620.19,814,6605331218747Dept. Head: Acquisitions 17.9 12 23.0 3Reference 19.0 25 13.8 10Cataloging 21.5 12 22.5 2Serials 22,4 5 N/A 0Documents/Maps 3.0 1 N/A 0Circulation. 14.6 14 8.5 2Rare Books/Manuscripts 24.2 6 20.0 3Computer Systems 12.6 11 11.8 8Other 18.0 50 15.6 1418,917.521.622.43.013.922.812.317.5153514511691964Public Services 13,1 33 12.5 8Technical Services 16.5 11 14,0 5Administrative Services 10,7 13 20,0 4Reference 12,1 199 12,6 40Cataloger 11.4 20 14,3 413.015,712,912,211.841161723924All Positions 15.6 615 14.4 199 15.3814NI A - No positions were reported in this category.80
TABLE 41: NUMBER AND AVERAGE SALARIES OF<strong>ARL</strong> UNIVERSITY MEDICAL LIBRARIANSBY YEARS OF EXPERIENCE AND SEX, FY <strong>1999</strong>-<strong>2000</strong>*Women Men Total% ofExperience<strong>Salary</strong> No. <strong>Salary</strong> No. <strong>Salary</strong>No.Total0-3years$37,739 81 $43,225 30 $39,222111 14%4-7years38,906 77 43,615 30 40,227107 13%8 - 11 years44,003 74 46,165 23 44,51697 12%12 - 15 years46,875 78 49,206 26 47,458104 13%16 - 19 years49,372 74 56,567 26 51,242100 12%20 - 23 years53,257 80 61,319 28 55,347108 13%24 - 27 years28 - 31 years32 - 35 yearsover 35 years60,235 72 63,284 15 60,76159,857 54 68,946 12 61,51071,110 18 85,282 6 74,6537 3 68,08687 11%66 8%24 3%10 1%All Positions$49,044 615 $53,616 199 $50,162814 100%,. Canadian salaries expressed in U,S. dollars.t <strong>Salary</strong> data are not published when fewer than four individuals are involved in either category.81
<strong>ARL</strong> UNIVERSUY LAW LIBRARIESTables 42-48
TABLE 42: FILLED POSITIONS; AVERAGE, MEDIAN, BEGINNING PROFESSIONALSALARIES; AND AVERAGE YEARS OF EXPERIENCEIN <strong>ARL</strong> UNIVERSITY LAW LIBRARIES, FY <strong>1999</strong>-<strong>2000</strong>'"Filled Average Median Beginning AverageInstitution Positions <strong>Salary</strong> <strong>Salary</strong> <strong>Salary</strong> Yrs. Exp.AJabamil 8 $41,390 $39,792 $26,000 13.3Alberta i 4 23,521 22.0Arizona 8 49,107 48,332 38,000 18.1Arizona 5tnte ~ 5 51,173 55,309 32,000 23.6Boston University 9 55,625 47,550 44,000 14.9British Columbia • 3 22,996 26.0California, Davis 6 63,185 66,780 32,292 21.0California, Los Angeles 11 57,746 61,812 32,292 12.7Case West-ern Reserve 10 47,261 46,074 34,500 14.2Cincinnati 7 53,547 55,517 25,000 16.1Colomdo 7 47,394 44,420 33,000 13.3Columbia 15 58,149 56,963 37,500 12.3Connecticut 9 49,055 49,011 35,000 13.6Cornell 6 49,808 45,930 35,000 12.8Duke 10 53,272 50,DOO 32,800 17.DEll'wry 9 52,943 50,346 30,000 13.4Floridil 11 45,412 44,075 3D,000 23.0Florid
TABLE 42: FILLED POSITIONS; AVERAGE, MEDIAN, BEGINNING PROFESSIONALSALARIES; AND AVERAGE YEARS OF EXPERIENCEIN <strong>ARL</strong> UNIVERSITY LAW LIBRARIES, FY <strong>1999</strong>-<strong>2000</strong>"Filled Average Median Beginning AverageInstitution Positions <strong>Salary</strong> <strong>Salary</strong> <strong>Salary</strong> Yrs. Exp.Missouri ~ 7 38,560 34,781 27,500 8.9Nebraska I> $42,974 $38,521 $33,500 10.2Nevv Mexico 5 5 51,599 53,220 38,000 14.8New York University 17 61,495 56,035 38,000 15.2North Carolina 7 48,224 41,626 30,000 18.6Northwestern 11 51,295 48,255 29,200 15.2Notre Dame 11 51,164 52,280 34,000 14.6Ohio State 9 43,455 40,764 33,000 7.9OklahOina 6 36,409 34,001J 25,0()0 11.5Oregon 5 40,427 37,073 31,000 15.4Pennsylvani
TABLE 43: BEGINNING PROFESSIONAL SALARIESIN <strong>ARL</strong> UNIVERSITY LAW LIBRARIESRANK ORDER TABLE, FY <strong>1999</strong>-<strong>2000</strong>*Rank Institution <strong>Salary</strong> Rank Institution<strong>Salary</strong>1 Boston $44,000 35 Minnesota2 Rutgers, Camden 41,174 38 Indiana2 Rutgers, Newark 41,174 39 Oregon4 Washington 40,000 40 Wisconsin5 Georgetown 38,357 41 Emory6 Arizona 38,000 41 Florida6 New Mexico 38,000 41 Iowa6 New York 38,000 41 Kentucky6 Stanford 38,000 41 Louisiana State10 Columbia 37,500 41 Miami11 Michigan 36,800 41 North Carolina12 Howard 36,500 41 SUNY Buffalo13 South Carolina 36,000 41 Temple14 Yale 35,700 41 Tennessee15 Harvard 35,200 41 Utah16 CQIUlecticut 35,000 41 Virginia16 Cornell 35,000 53 Kansas16 George Washington 35,000 54 Texas Tech16 Georgia 35,000 55 Northwestern16 Southern Illinois 35,000 56 Texas16 Tulane 35,000 56 Vanderbilt22 Case Western Reserve 34,500 58 Washington-St. Louis23 Notre Dame 34,000 59 Missouri23 Pennsylvania 34,000 60 Western Ontario t23 Wayne State 34,000 61 Florida State26 Nebraska 33,500 62 York t26 Pennsylvania State 33,500 63 Alabama28 Hawaii 33,312 64 Cincinnati29 Colorado 33,000 64 Oklahoma29 Illinois, Urbana 33,000 66 Alberta t29 Ohio State 33,000 67 British Columbia t32 Duke 32,800 68 Toronto t33 Calif. Davis 32,292 69 McGill t33 Calif. Los Angeles 32,292 70 Manitoba t35 Arizona State 32,000 71 Queen's t35 Houston 32,000 72 Saskatchewan t$32,00031,86231,00030,63630,00030,00030,00030,00030,00030,00030,00030,00030,00030,00030,00030,00029,41129,32829,20028,00028,00027,80027,50027,26627,00026,37626,00025,00025,00023,52122,99622,71122,51221,44221,18820,589.. Beginning salary figures represent officially designated base, not necessarily salaries of actual incumbents.t Canadian salaries expressed in U.S. dollars86
TABLE 44: MEDIAN PROFESSIONAL SALARIESIN <strong>ARL</strong> UNIVERSITY LAW LIBRARIESRANK ORDER TABLE, FY <strong>1999</strong>-<strong>2000</strong>*RankInstitution <strong>Salary</strong> Rank Institution<strong>Salary</strong>234567891011121314151617181920212223242526272829303132California, Davis $66,780 33 IndianaSouthern Illinois 64,038 34 Boston UniversityCalifornia, Los Angeles 61,812 35 Case Western ReserveRutgers, Newark 61,467 36 SUNY BuffaloStanford 59,649 37 CornellColumbia 56,963 38 Rutgers, CamdenGeorge Washington 56,655 39 HoustonNew York University 56,035 40 ColoradoTennessee 55,978 41 FloridaCincinnati 55,517 42 TulaneArizona State 55,309 43 WisconsinYale 55,200 44 HawaiiGeorgetown 55,000 45 HowardHarvard 54,252 46 Florida StateNew Mexico 53,220 47 TexasNotre Dame 52,280 48 South CarolinaIowa 52,000 49 Alberta tWashington 51,792 50 North Carol inaPennsylvania 51,745 51 Louisiana StateGeorgia 50,676 52 Ohio StateEmory 50,346 53 AlabamaMichigan 50,250 54 KentuckyMinnesota 50,200 55 MiamiDuke 50,000 56 TempleVirginia 49,600 57 Western Ontario tWashington U.-St. Louis 49,150 58 NebraskaConnecticut 49,011 59 McGill tUtah 48,700 60 KansasArizona 48,332 61 OregonNorthwestern 48,255 62 MissouriPennsylvania State 48,192 63 OklahomaVanderbilt 47,995$47,58847,55046,07446,04345,93045,74045,59444,42044,07543,62943,45442,98442,90642,73942,28042,13041,81941,62641,48140,76439,79239,78139,29639,02338,88338,52137,71337,35937,07334,78134,000* Salaries of directors are not included in the calculation of medians. British Columbia; Illinois, Urbana; Manitoba; Queen's;Saskatchewan; Texas Tech; Toronto; Wayne State; and York are not ranked because they reported fewer than four individuals.t Canadian salaries expressed in U.S. dollars.87
TABLE 45: AVERAGE PROFESSIONAL SALARIESIN <strong>ARL</strong> UNIVERSITY LAW LIBRARIESRANK ORDER TABLE, FY <strong>1999</strong>-<strong>2000</strong>*RankInstitution <strong>Salary</strong> Rank Institution<strong>Salary</strong>234567891011121314151617181920212223242526272829303132California, Davis 63,185 33 ConnecticutStanford 62,946 34 Pennsylvania StateNew York University 61,495 35 TexasRutgers, Newark 61,130 36 North CarolinaGeorgetown 60,765 37 ColoradoYale 59,108 38 Case Western ReserveSouthern Illinois 58,567 39 South CarolinaColumbia 58,149 40 UtahCalifornia, Los Angeles 57,746 41 WisconsinHarvard 57,209 42 HawaiiGeorge Washington 56,002 43 TulaneIowa 55,898 44 TempleBoston University 55,625 45 FloridaVirginia 54,527 46 Louisiana StateMichigan 53,945 47 Washington U.-St. LouisCincinnati 53,547 48 HoustonTennessee 53,364 49 HowardDuke 53,272 50 Ohio StateMinnesota 53,190 51 SUNY BuffaloEmory 52,943 52 NebraskaPennsylvania 52,177 53 Florida StateWashington 51,781 54 AlabamaNew Mexico 51,599 55 Alberta tVanderbilt 51,303 56 OregonNorthwestern 51,295 57 MiamiArizona State 51,173 58 Western Ontario tNotre Dame 51,164 59 MissouriGeorgia 50,733 60 KansasCornell 49,808 61 KentuckyIndiana 49,799 62 OklahomaRu tgers, Camden 49,669 63 McGill tArizona 49,10749,05548,69448,22848,22447,39447,26147,23746,92046,60846,45246,25145,86645,41245,33544,54944,08744,04643,45543,11042,97441,60341,39040,74940,42740,39238,88338,56037,54936,89636,40935,856* Salaries of directors are not included in the calculation of averages. British Columbia; Illinois, Urbana; Manitoba; Queen's;Saskatchewan; Texas Tech; Toronto; Wayne State; and York are not ranked because they reported fewer them fourindividuals.t Canadian salaries expressed in U.s. dollars.88
TABLE 46: NUMBER AND AVERAGE SALARIES OF<strong>ARL</strong> UNIVERSITY LAW LIBRARIANSBY POSITION AND SEX, FY <strong>1999</strong>-<strong>2000</strong>*WomenMenTotalPosition <strong>Salary</strong> No. <strong>Salary</strong> No.<strong>Salary</strong>No.Head, Law $108,770 33 $117,847 33Associate Director 76,446 25 68,002 15Assistant Director 63,489 24 62,605 11Head, Branch N/A 0 N/A 0Functional Specialist 43,353 23 44,943 15Subject Specialist 55,339 24 53,617 12$113,308 6673,279 4063,211 35N/A 043,980 3854,765 36Dept. Head: Acquisitions 46,269 20 48,549 6Reference 58,752 19 60,582 12Cataloging 29 3Serials 43,870 7 N/A 0Documents/Maps 12 2Circulation 48,167 19 42,200 9Rare Books/Manuscripts 2 3Computer Systems 53,259 3 54,852 12Other 53,605 31 58,457 1346,795 2659,460 3151,058 3243,870 746,067 1446,249 2852,170 554,534 1555,038 44Reference: Over 14 years experience 50.os0 31 53,778 1010 to 14 years experience 47,920 17 49,199 85 to 9 years experience 43,887 25 46,064 12Under 5 years experience 39,050 30 40,590 1650,982 4148,329 2544,593 3739,586 46Cataloging: Over 14 years experience 48,090 17 48,860 510 to 14 years experience 41,364 9 42,056 55 to 9 years experience 11 2Under 5 years experience 6 148,265 2241,611 1438.148 1337,271 7Other: Over 14 years experience 10 110 to 14 years experience 7 25 to 9 years experience 40,639 5 42,247 5Under 5 years experience 6 250,023 1152.522 941,443 1033,184 8All Positions $54,682 445 $61,609 215$56,939 660* Canadian salaries expressed in U.s. dollars.N/ A ~ No positions were reported in this category.t <strong>Salary</strong> data are not published when fewer than four individuals are involved in either category.89
TABLE 47: NUMBER AND AVERAGE YEARS OF EXPERIENCEOF <strong>ARL</strong> UNIVERSITY LAW LIBRARIANSBY POSITION AND SEX, FY <strong>1999</strong>-<strong>2000</strong>Women Men TotalPosition Years No. Years No. YearsNo.Head, Law 23.4 33 23.4 33 23.4Associate Director 21.8 25 17.3 15 20.1Assistant Director 20.5 24 15.6 11 18.9Head, Branch N/A 0 N/A 0 N/AFunctional Specialist 14.3 23 10.2 15 12.7Subject Specialist 17.3 24 17.8 12 17.466403503836Dept. Head: Acquisitions 18.0 20 10.0 6 16.1Reference 16.3 19 16.4 12 16.3Cataloging 17.8 29 15.3 3 17.5Serials 9.4 7 N/A 0 9.4Documents/Maps 18.8 12 2.5 2 16.4Circulation 15.1 19 10.8 9 13.7Rare Books/Manuscripts 18.5 2 10.7 3 13.8Computer Systems 14.7 3 11.8 12 12.3Other 18.6 31 17.0 13 18.12631327142851544Public Services 9.0 9 7.7 6 8.5Technical Services 12.9 12 8.0 3 11.9Administrative Services 14.9 7 5.0 1 13.6Reference 11.4 103 10.1 46 11.0Cataloger 14.4 43 14.4 13 14.41515814956All Positions 16.0 445 14.4 215 15.5660N/ A - No positions were reported in this category.90
TABLE 48: NUMBER AND AVERAGE SALARIES OF<strong>ARL</strong> UNIVERSITY LAW LIBRARIANSBY YEARS OF EXPERIENCE AND SEX, FY <strong>1999</strong>-<strong>2000</strong>"Women Men Total% ofExperience<strong>Salary</strong> No. <strong>Salary</strong> No. <strong>Salary</strong>No.TotalO~3years4 - 7 years8 - 11 years12 -15 years16 -19 years20 - 23 years24 - 27 years28 - 31 years32 - 35 yearsover 35 years$38,333 46 $42,803 30 $40,09742,123 58 45,016 31 43,13149,738 66 54,491 29 51,18954,646 54 58,305 41 56,22554,134 52 68,742 16 57,57164,983 58 71,973 25 67,08964,020 59 78,686 27 68,62464,745 31 79,743 7 67,50B15 3 81,27473,748 6 105,581 6 89,66576 12%89 13%95 14%95 14%68 10%83 13%'86 13%38 6%,18 3%12 2%All Positions$54,682 445 $61,609 215 $56,939660 100%* Canadian salaries expressed in U.S. dollars.f <strong>Salary</strong> data are not published when fewer than four individuals are involved in either category.91
UNIVERSITY LIBRARYQuestionnaire and Instructions
<strong>ARL</strong> ANNUAL SALARY SURVEY <strong>1999</strong>-<strong>2000</strong>UNIVERSITY LIBRARY QUESTIONNAIREGeneral Instructions for Completing the QuestionnaireI. This survey is concemed with professional positions only. Since the criteria for determining professional statusvary among libraries, there is no attempt to define the term "professional." Each library should report thesalaries of those staff members it considers professionals, irrespective of faculty status or membership in acollective bargaining unit, including, when appropriate, staff who are not librarians in the strict sense of theterm, such as computer expelts, systems analysts, budget officers, etc.2. Individual salaries for the general, law, and medical library may bc reported on the templates (located onlinc at
10. After all data have been entered, make a backup copy of the complete file (including individual names/id#s) foryour institution's master file, if you wish to refer to this file in the future. Note: The data submitted to <strong>ARL</strong>should NOT include individual names or id#s, so <strong>ARL</strong> will NOT be able to supply a copy of your institution'scomplete file next year.II. The questionnaire should be returned to the <strong>ARL</strong> Office by August 31, <strong>1999</strong>. If you are providing theindividual data as an electronic file, please send the files as an email attachment to stats-ra@arl.org, and mail orfax Part I of the survey and a printout of the data file (Part II). Alternatively, you can save the files on a diskand mail the disk with the hard copy of Patt I and Patt II of the survey. Be sure to keep a complete copy ofyour return, including the electronic version of the data for your files.Instructions for Completing Part I: Summary DataI. Part I of this survey deals with general information for the current fiscal year, <strong>1999</strong>-<strong>2000</strong>.2. Please include the Beginning Professional <strong>Salary</strong> for Law and Medical libraries if included in the survey; if notincluded, enter "N/A" in the appropriate blank.3. Question 1. The Beginning Professional <strong>Salary</strong> is the salary that would be paid to a newly hired professionalwithout experience, not necessarily the lowest professional salary paid. In reporting the beginning salary,please use a figure that is actually used or likely to be used for entry-level librarians hired by your library, evenif it is your practice rarely to hire entry-level professionals without experience.Please report the <strong>1999</strong>-<strong>2000</strong> Beginning Professional <strong>Salary</strong> to the best of your knowledge as it exists on July I,<strong>1999</strong>. Do not delay returning your survey with the expectation that more information will be available later.4. The <strong>1999</strong>-<strong>2000</strong> Average and Median <strong>Salary</strong> figures will be calculated by <strong>ARL</strong> from the individual datasupplied.5. Be sure to fill in the name of the reporting library and the name of the person who prepares the report.96
Instructions for Completing Part II: Individual DataI. Part II of this survey requests information on salary, sex, minority status, rank, and years of experience for allfilled positions for fiscal year <strong>1999</strong>-<strong>2000</strong>. The survey requests information for individuals; aggregate data foreach institution will be generated by computer. Vacant positions should be excluded from your report.2. Data for the general, law, and medical libraries may be repOIted on separate templates; see #4 below for specificinstructions.3. <strong>Survey</strong> Form. If you are not able to submit the data in electronic form, please use the enclosed forms.Photocopy additional sheets if you cannot list all professional positions in the space provided. You may alsouse a printout from a word-processing document with all columns correctly ordered and labeled.If you are reporting on paper forms only, list information for individuals in separate Law or Medical libraries onsheets devoted only to each of those two branches. Check the appropriate box at the top of the form to indicatewhen a sheet is only for Law or Medical library staff.The left-hand column labeled "Name/IO" has been provided so the form can also serve as a work shcet. Afterthe forms have been completed, the left-hand column should be removed to cnsure anonymity of the data.Except for segregating Law and Medical library staff, the order in which staff members are entered on the formis immaterial; enter them in the order most convenient for you.4. Template. The templates contain data input files for general, law, and medical library data in .xls files that canbe uploaded into spreadsheet programs. They are labeled as follows:GeneralLawMedical<strong>ARL</strong>9xxxx.xlsLA W9xxxx.xlsMED9xxxx.xlsxxxx ~ Library identification number; see label on the file. The file names this year have a "9", standing for<strong>1999</strong>-<strong>2000</strong>, preceding the four-digit library identification number, to distinguish them from, and prcventoverwriting of, files you may have created in prior years.The files contain empty worksheets with columns labeled as follows:Name/IO LiblD Line Job Sex OEOcat Rank PercentThis year the following additional optional columns are included in anticipation of the changes to the standardsfor the classification offederal data on race and ethnicity:Hispanic or LatinoAmer. Indian or Alaska NativeAsianBlack or African Amer.Native Hawaiian/Other Pacific IslanderWhiteThe first entry in the column labeled "LibIO" is already filled in so there will be no question about theinstitutional identity of the files as they are received. If the files have been damaged in any way or if thenumber in the LibIO column is not the same as the library number at. please call the <strong>ARL</strong> Office for instructions.97
Detailed instructions for inputting data in each format are enclosed. Please do not alter any formats, page orline numbers.After all data have been entered, make a backup copy of the complete file (including individual names/id#s) foryour institution's master file, if you wish to refer to this file in the future. Note: The data submitted to <strong>ARL</strong>does NOT include individual names or id#s, so <strong>ARL</strong> will NOT be able to supply a copy of your institution'scomplete file next year.5. <strong>Salary</strong>. Enter the individual salaries as they exist on July I, <strong>1999</strong>. If the library normally increases salaries at adate later than July I, and the salary as of that later date is known or can be estimated (within $100 or so) by thetime the questionnaire is due to be returned, use the higher salary figure and footnote the effective date and/orwhether the reported figures are known or estimated. Please do not hold up the reporting process for later salaryadjustments. Salaries should be reported for all filled positions. Vacant positions should be excluded from yourreport.<strong>Salary</strong> figures should be rounded off to the nearest whole dollar. Use digits only; do NOT use "$" or "," inreporting in figures (e.g., 25470, not $25,470).6. Position Code (Job). The position categories used in this survey are intended to correspond roughly with theactivities carried on in libraries, not with any particular pattern of staff organization or nomenclature.Please use these categories in the manner you feel best applies to your library. Indicate a position title by meansof one of the following codes.D1RLlBASCDlRASTDIRHDMEDHDLAWHDBRFSPECSSPECHDACQHDCATHDCIRCHDCOMPHDDOCHDMAPHDRBMHDREFHDSERHDOTHCATREFPUBSTECHADMINDirector of Libraries (or equivalent title; refers to chief executive)Associate DirectorAssistant DirectorHead, Mcdical Library (Human Medicine only)Head, Law LibraryHead, Other Branch Library (including Veterinary Medicine)Functional SpecialistSubject SpecialistHead, Acquisitions DepartmentI-lead, Catalog Department/UnitHead, CirculationHead, Library and Computer SystemsHead, Documents DepartmentHead, Map Room/DepartmentHead, Rare Book/Manuscripts DepaI1mentHead, Reference DepartmentHead, Serials Depal1mentHead, Other Department/Service/AgencyCatalogers, both general and specializedReference librarians, both general and specializedPublic Services, non-supervisory, except reference librariansTechnical Services, non-supervisory, except catalogersAdministrative and other units, non-supervisOIy positionIf any individual has responsibilities described by more than one of the above categories, choose the category that ismost typical of his/her general duties. Codes must be used exactly as they appear in the list above.98
Associate or Assistant Director, and Head, Other Branch. Use these codes for all persons at these levels regardlessof the area of specialty. If an assistant or associate director is also head of a depaltment, choose the categorythat most reflects the general duties of the person currently in the position.Specialists. These are of two kinds: Subject Specialists, who primarily build collections (but may also offerspecialized reference and bibliographic services); and Functional Specialists, who are media specialists or whoare experts in management fields such as personnel, fiscal matters, systems, preservation, etc. Specialists maynot be, strictly speaking, professional librarians (i.e., have the MLS). The "specialist" category would generallynot be used for someone with significant supervisory responsibilities, who should instead be listed as adepattment head or assistant director (see also note under Assistant Department Head, below).Department Heads. Depattment Heads not specifically included in the above list should be included under thecategory "Head, Other Department/Service/Agency." Head, Catalog Department should be used either for thedepartment that handles all cataloging, or for the head of a specialized cataloging unit (e.g. copy cataloging 01'foreign languages). List the head of library automation and computer systems, applications, programming, etc.as HDCOMP unless that person is also an Associate or Assistant Director, in which case use the appropriateadministrative code. If there is an intermediate level of management between an Associate or AssistantDirector and the professionals who actually carry out the analysis, programming, etc., use HDCOMP to definethat intermediate level. Professionals who carry out analysis, programming, etc. should be listed as functionalspecialists (FSPEC).Head, Acquisitions Department. Use HDACQ for all of the following positions: (a) head of a department that isresponsible for the selection of material (or management of selection activities carried out on a basisencompassing more than a single organizational unit), but not responsible for the placement of orders, paymentof invoices, ete.; (b) head of a depattment responsible for the placement of orders, maintaining on-order files,payment of invoiees, etc., but not responsible for selection decisions; (c) head of a department responsible forboth the selection decisions (01' coordination of selection activities) and for acquiring the material. Libraries thatsplit these two functions between two departments should report more than one professional with the positionHDACQ.[Special note concerning Assistant Department Heads. Assistant Department Heads who are responsible for majorunits and spend the bulk of their time in supervision and revision of the work of others should also be listed as"Head, Other Department/Service/Agency." See additional subcodes below for Head, Cataloging, and Head,Other Department. However, Assistant Head positions responsible for small units or for supervision only in theabsence of the head should be reported as non-supervisory 01' specialist positions as appropriate.]7. Sex. Indicate either Mol' F, for male and female, respectively. Please use only the letter indicated; do not spellout the word.8. Minority statns code (OEOCat). U.S. university libraries, only, should indicate minority status by means ofone of the following code numbers. (Leave blank if a Canadian library or if vacant.)I Black2 Hispanic3 Asian or Pacific Islander4 American Indian or Native Alaskan5 Caucasian/Other99
9. Total years of professional experience (Yrsexp). Define "professional experience" as indicated in the generalinstructions; for most professional staff members this will mean counting the years since the MLS degree wasawarded. When counting, do not subtract interim periods when an individual was not engaged in professionallibrary employment if these periods are short in relation to the overall professional career. Count an academicyear contract period as a full year. Be sure to include professional experience in previous positions and in otherinstitutions. Numbers should be rounded off to the nearest whole number.10. Rank. Rcsponses concerning rank should be limited to professional librarians and other professionals reportedin the survey who occupy the same ranks as librarians. Leave the rank column blank for professionals who donot occupy these ranks or if the column is not applicable. For example, if the Library Business Officer holds arank typically used for university administrators but not for librarians, do not supply a rank code for thatindividual or describe his/her rank in answering other questions, even if you have included salary and other datafor the Business Officer.If mUltiple ranking structures are used for librarians and these structures are substantially different and notequivalent, enter individual rank information only for that group which represents the largest fraction of "rankand-file"librarians.Do not usc roman numeral rank levels. Convert your local ranking system if necessary.Complete the column labeled "Rank Code" using the following codes:oA rank normally occupied solely by the library director and/or assistant and associate directors.9 Rank unknown; or, there is confusion or controversy regarding how to code this individual's rank.ILowest level in the rank structure.2 Next highest level in the rank structure.3-8 Successively higher levels in the rank structure. Highest number in this range should be equivalent tothe highest rank in the library's structure (unless the highest rank is occupied solely by the directorand/or assistant and associate directors).The maximum number of ranks reported here should not exceed the maximum number of rank-levelsreported in Part I for individual data under Rank Structure.When counting the total number of rank levels, include ranks that may be unoccupied at the present time due tocircumstances like unusually high turnover, hiring freezes, etc.II.Percent. Change the 100% appointment to less than that only for part-time people. Enter percent with decimalpoints. For example, a 65% appointment would be entered as .65. To calculate the percent appointment, if lessthan 1.00, which stands for 100%, divide the months the employee works by the number of months consideredto be the norm for full-time employment at your institution (or the number of hours per week an employeeworks by the number of hours per week considered to be the norm for full-time employment at your institution).For example, if a full-time appointment at your institution is 12 months, a 9-month part-time appointmentwould be .75, i.e. 75%. If a full-time appointment at your institution is 40 hours per week, an appointment at 30hours per week is also .75. To calculate the percent appointment for an employee who works 30 hours a weekand only for 9 months a year, when the norm for full-time employment is 40 hours a week and a 12-monthappointment, multiply the percent appointment per week by the percent appointment per year, i.e .. 75 x .75 ~.56.100
Please continue to enter data in additional categories as described on the following pages.Instructions for Optional Categories(Shown on printed forms as the last six columns)1. Please complete as much of this section as possible (US libraries only), but do not hold up thereporting process if some of the data requested are not available. Canadian libraries should leavethese columns blank. The major change in the revised standard for the classification of federal dataon race and ethnicity is that now respondents are able to report more than one race by choosingmultiple responses to the following questions.2. Ethnicity: u.s. university libraries, only, should indicate Hispanic or Latino ethnicity by coding 1 toindicate the presence of the characteristic (1 =yes) and 0 to indicate its absence. The definition ofHispanic or Latino ethnicity is: A person of Cuban, Mexican, Puerto Rican, Cuban, South or CentralAmerican, 01' other Spanish culture or origin, regardless of race.3. Race: U.S. university libraries, only, should indicate race by choosing one or more responses amongthe five racial categories provided here. The definitions of the five racial categories are:American Indian or Alaska Native (AllAN). A person having origins in any of the original peoplesof North and South America (including Central America), and who maintains tribal affiliation orcommunity attachment.Asian. A person having origins in any of the original peoples of the Far East, Southeast Asia, 01' theIndian subcontinent including, for example, Cambodia, China, India, Japan, Korea, Malaysia,Pakistan, the Philippine Islands, Thailand, and Vietnam.Black or Mrican American. A person having origins in any of the black racial groups of Africa.Native Hawaiian or Other Pacific Islander (NHjOPI). A person having origins in any of theoriginal peoples of Hawaii, Guam, Samoa, 01' other Pacific Islands.White. A person having origins in any of the original peoples of Europe, the Middle East, or NorthAfrica.The presence or absence of a racial characteristics should be indicated by coding 1 =yes and O=no.You can select multiple racial categories for a person:1= yes1= yes1= yes1= yes1= yes0= no American Indian 01' Native Alaska (AlINA)0= no Asiano = no Black or African American0= no Native Hawaiian or Other Pacific Islander (NH/OPI)0= no White101
<strong>ARL</strong> ANNUAL SALARY SURVEY <strong>1999</strong>-<strong>2000</strong>UNIVERSITY LIBRARY QUESTIONNAIREPart I: Summary DataReporting Institution _____________________Date Returned to <strong>ARL</strong> _______Report Prepared by (name)_________________.,-________________Title ________________________________________Email address _______________________Phone number __________Contact person (if different) __________________________________Title ______________________________________Email address _______________________Phone number __________I. Beginning Professional <strong>Salary</strong> Main Law MedicalBeginning professional salary for <strong>1999</strong>-<strong>2000</strong>.(Note: <strong>ARL</strong> will calculate the <strong>1999</strong>-<strong>2000</strong> mellian and average professional salaries for your librGlYFain the individual data you supply in Part II of this questionnaire.)2. Rank Structure.Indicate the number of levels in your institution's rank structure for professional librarians. You should report herethe maximum number of rank-levels, reported in Part II for individual data, under the Rank column.__ I level (Le., no differentiated levels)2 levels3 levels4 levels5 levels__ more than 5 levels (please specifY the number of levels: ----.J103
3. FOOTNOTES3a. Please list which libraries are included in the data submitted for the "general" libraries. These can be maincampus libraries or branch campus libraries.3b. Please list which libraries are NOT included in the data submitted for the "general" libraries. These can bemain campus libraries or branch campus libraries.For your convenience, a copy of your libralY's footnotes as they appeal' in the published <strong>ARL</strong> <strong>Annual</strong> <strong>Salary</strong> <strong>Survey</strong> /998-99is attached. Please indicate revisions, additions, and deletions as appropriate. If any footnotes published last year areunchanged, please mark them to indicate that they are still valid.Please return the completed questionnaire to the<strong>ARL</strong> Statistics and Measurement Program by August 31, <strong>1999</strong>.Please contact Martha Kyrillidou at (202) 296-2296 or martha@arl.org for assistance.104
INSTNO Check here if this sheet is for Medical Library Only Check here if this sheet is for Law Library only Sheet Number ~ ___ _<strong>ARL</strong> ANNUAL SALARY SURVEY <strong>1999</strong>-<strong>2000</strong>Reporting LibraryUNIVERSITY LIBRARY QUESTIONNAIREPart II: Individual DataConfidentialDetach before mailingformto the <strong>ARL</strong> officeName I ID Line <strong>Salary</strong>12345678910111213141516171819202122232425JobEthnicityOEOHispanicSex cat YrsExp Rank % or LatinoRace:Amer.Indian orAlaskaNativeRace:AsianRace:BlackorAfricanAmer.Race:NativeHawaianIOtherPIRace:WhitePlease duplicate this sheet if you need additional lines, and returnthe completed questionnaire to the <strong>ARL</strong> Statistics and Measurement Program by August 31, <strong>1999</strong>.Please contact Martha Kyrillidou at (202) 296-2296 or martha@arLorg for assistance.105
NON UNIVERSITY LIBRARYQuestionnaire and Instructions
<strong>ARL</strong> ANNUAL SALARY SURVEY <strong>1999</strong>-<strong>2000</strong>NONUNIVERSITY LIBRARY QUESTIONNAIREGENERAL INSTRUCTIONSI. This survey is concerned with the salaries of professional positions only. Since the criteria fordetermining professional status vary among libraries, there is no attempt to define the term"professional." Each library should report the salaries of those staff members it considersprofessionals, irrespective of membership in a collective bargaining unit, and including, whenappropriate, staff who are not librarians in the strict sense of the term, such as systems analysts,budget officers, etc.2. Salaries should be reported for all filled positions. Vacaut positions should be excluded from yourreport.3. Report <strong>1999</strong>-<strong>2000</strong> salaries as they exist on July I, <strong>1999</strong>. If the library normally increases salariesat a date after July I, and the salary as of that later date is known or can be estimated (within $100or so) by the time the questionnaire is due to be returned, please use the higher salary and footnotethe effective date audlor whether the reported figures are known or estimated. Please do not holdup the reporting process for later salary adjustments.4. The Median <strong>Salary</strong> is the salary that has au equal number of salaries above it and below it. In thoselibraries with an even number of positions, the median salary is the average of the two salaries thathave an equal number of salaries above and below them.5. The Beginning Professional <strong>Salary</strong> is the salary that would be paid to a professional withoutexperience, not necessarily the lowest professional salary paid. In reporting the beginning salary,please use a figure that is actually used or likely to be used for entry-level librarians hired by yourlibrary.6. Salaries should be reported for both full-time and part-time professional positions. However,salaries for part-time positions should be convelted to their full-time equivalents before reporting;do not report the actual pmt-time salary paid.7. Salaries should normally be reported on a 12-month basis. If an appointment is for 9 or 10 monthsat the option of the employee, the actual salary paid should be increased to its 12-monthequivalent. However, if appointments ofless than 12 months are required by the employer, reportthe actual salary paid.8. The salaries for all professional positions should be included, regardless of whether the salariescome from regular library budget funds or from special funds such as research grants.9. The salary figures should be straight gross salary figures. Do not include fringe benefits.10. Explanatory footnotes to the reported figures may be provided when necessary. Footnotes will beincluded in the published survey. (lfyou had footnotes in 1998-99, a copy is provided with thismailing for your reference.)II. Provide the name of the repOiting library and the nmne of the person who prepares the repOit.12. Please return the questionnaire to the <strong>ARL</strong> Statistics and Measurement Progrmn Office byAugust 31, <strong>1999</strong>.109
<strong>ARL</strong> ANNUAL SALARY SURVEY <strong>1999</strong>-<strong>2000</strong>NONUNIVERSITY LIBRARY QUESTIONNAIREPart I: Summary DataReporting Institution ____________________ _Date Returned to <strong>ARL</strong> ______ _Report Prepared by (name) _________________________________ _Title ____________________________________ _Email address ______________________ _ Phone number --------------Contact person (if different) _________________________________ _Title ______ .Email address ______________________ _Phone number1. Complete the table on the back of this sheet by indicating the number of filled or temporarily vacant professionalpositions in each salary range for fiscal years 1998-99 and <strong>1999</strong>-<strong>2000</strong>.2. Median professional salary for fiscal year <strong>1999</strong>-<strong>2000</strong>.3. Beginning professional salary for <strong>1999</strong>-<strong>2000</strong>.4. Footnotes (Please compare with footnotes from surveys of previous years.)a. Law Library salaries are included.Yes No ___ We do not have a Law Library.b. Medical Library salaries are included.Yes No ___ We do not have a Medical Library.e. Branch libraries not included (please attach an additional sheet if necessary):5. Other comments (please attach an additional sheet if necessary):110
Indicate the number offilled professional positionsin each salary range for fiscal years 1998-99 and <strong>1999</strong>-<strong>2000</strong>.<strong>Salary</strong> Range1998-99Number of Positions<strong>1999</strong>-<strong>2000</strong>$200,000 or more-175~600-=-199,999--~-'150,000 - 174,999, __ _______ _---.~-.-.-140,000 - 149,999130,000 - 139,999120,000 - 129,999.._-------------.--------110,000 - 119,999100,000 ..:·jiJ"'9.s,9c'c99=c----95,000 - 99,999'90,000 - 94,999 .---85,000 - 89,999-86~006- 84,999-75,006 --_ -. 79,999.._-........._.70,000 - 74,999-65,006-'~ 69~,9"'9""9--·----·'···60,000 - 64,99955,000 - 59,99950,000 - 54,99948,000 -49,999"46,000-47,999 ---44,000 - 45,999 .... --.. --------------42;060 - 43,999_._.-._- ~----40,000 - 41 ,99938,0-66= 39,999 .-36~6oo"~ 37,999---34,000 - 35,~?932,000 - 33,999.. 30,000 - 3 1,'999-·-·---------------29,000 - 29,999 --_.--_._----_._--28~000~99--····.--_.---_._---2'7;060 - 27,999_._-----------26,060- 26,99925,000-::.-25,999----····- 24,000 _ 24:999 "".u.______""_23,000 - 23,999 .--- ..--~---------22,000 -":22,'~99~9~------ ...----.-------------21,000 - 21,999·---·-----··--------Less than 21,000 --------------.-----------_._----Total Number of PositionsPlease return the completed questionnaire to the<strong>ARL</strong> Statistics and Measurement Program by August 31, <strong>1999</strong>.Please contact Martha Kyrillidou at (202) 296-2296 or martha@arl.org for assistance.III
FOOTNOTES TO <strong>ARL</strong> ANNUAL SALARY SURVEY <strong>1999</strong>-<strong>2000</strong>ALBERTAARIZONAARIZONA STATEIncludes humanities and social sciences, science and technology, business,education, and Faculte Saint-Jean libraries, interlibrary loans, financial systemsand analysis, electronic access service, bibliographic services, and informationtechnology services.Includes main, science/engineering, music, architecture, center for creativephotography, and special collections libraries.Includes Hayden, Noble Science and Engineering, architecture andenvironmental design, music, and video resources libraries on the maincampus; ASU East and ASU West.Beginning law salary is $32,000 without J.D.; $35,000 with J.D.BOSTONIncludes theology library and special collections.Beginning professional salary for the Theology Library is $23,300.BRIGHAM YOUNGExcludes law library.Salaries reported for faculty only and do not include professional salaries fornonlibrarian positions.BRITISH COLUMBIAIncludes Asian, education, extension, fine arts, First Nations House ofLearning, Walter C. Koerner, life sciences, David Lam Management, Hamber,MacMillan, mathematics, and music libraries, science and engineering division,special collections, and university archives.Includes Woodward Biomedical Branch Library and St. Paul's Hospital Library.The University of British Columbia Library system has no rank structure.BROWNCALIFORNIA, BERKELEYIncludes the John Carter Brown Library.Salaries do not reflect 2% COLA or variable percent merit increases effectiveOctober 1,<strong>1999</strong>.Includes main, Bancroft, Moffitt, anthropology, art history and classics,astronomy-mathematics-statistics, bioscience and natural resources, businessand economics, chemistry, East Asian (including center for chinese studies),earth sciences, education-psychology, engineering, environmental deSign,music, optometry, physics, public health (including health sciencesinformation services, occupational, and environmental health), and socialwelfare libraries; and northern regional library facility.Excludes architectural slide, continuing education of the bar, earthquakeengineering, ethnic studies, Giannini (agricultural economics), institute ofgovernmental studies, institute of industrial relations, institute of internationalstudies, institute of transportation studies, law, and water resources center.Also not included are various departmental libraries: e.g., French, history,philosophy, rhetoric, Slavic languages and literature.CALIFORNIA, DAVISIncludes Peter J. Shields, physical sciences and engineering, and agriculturaland resource economics on the Davis campus.Includes the Carlson Health Sciences Library on the Davis campus and theMedical Center Library in Sacramento.Head of serials also serves as head of cataloging.CALIFORNIA, RIVERSIDEIncludes Rivera, bio~agriculturalf and physical sciences libraries.113
FOOTNOTES TO <strong>ARL</strong> ANNUAL SALARY SURVEY <strong>1999</strong>-<strong>2000</strong>CALIFORNIA, SANTA BARBARAIncludes main and arts library.Includes salaries for professional staff members who are not librarians:specialist, computer network technologist.CASE WESTERN RESERVEIncludes Mandel School of Applied Social Sciences library.Main library data also includes professional salaries of individuals who providesupport for electronic library services and integrated library systems.Professional salaries of individuals who provide support for electronic librmyservices and integrated library systems are included in the Main Library'sstatistics. A portion of this group has disbanded, and those salaries are nolonger reported.Some Medical Library salaries are effective January 1, <strong>2000</strong>.CHICAGOCINCINNATICOLORADOCOLORADO STATECONNECTICUTCORNELLDARTMOUTHSalaries for law and science libraries are included in the reporting for the mainlibrary.Includes main campus libraries and branch campuses at Clermont andRaymond Walters College.Includes Norlin, music, business, math and physics, engineering, and earthsciences libraries.Includes veterinary, atmospheric sciences, and engineering research centerlibraries,Includes branch campus libraries.Includes Africana, engineering, entomology, fine arts, geneva experimentstation, hotel administration, management, Mann, math, music, ILR, Olin,Kroch, Uris, physical sciences, veterinary medicine libraries,Includes Baker Memorial, Feldberg Business and Engineering, Kresge PhysicalSciences, Cook Mathematics, Sherman Art, Sanborn English, Paddock Music,and RaUller Special Collections libraries.Medical library data includes Dana Biomedical Library and Matthews-FullerHealth Sciences Library,DELAWAREDUKEExcludes the salaries of staff of libraries not directly reporting to the Director ofLibraries.Includes the Perkins, Lilly, music, math/physics, chemistry, engineering,biological and environmental sciences, rare book, and special collectionslibraries.Also includes Fuqua School of Business Library and the divinity school library,which are both independent and separately administered.EMORYIncludes Woodruff, Candler, chemistry, Oxford College, and theology libraries,Medical library data includes all hospital library branches.Salaries effective September 1, <strong>1999</strong>,Rank structure is used in the main libraries onl yGEORGE WASHINGTONIncludes Gelman, Eckles, and Virginia campus libraries.Includes salary for one administrative position.114
FOOTNOTES TO <strong>ARL</strong> ANNUAL SALARY SURVEY <strong>1999</strong>-<strong>2000</strong>GEORGETOWNIncludes Reiss Science, Woodstock Theological, and Bioethics libraries; and theNational Center for Education in Maternal and Child Health Library.Each library has a different ranking structure.GEORGIAHARVARDIncludes the science and agricultural experimentation libraries.Includes all libraries on the Boston and Cambridge campuses, including theSchlesinger Library at Radcliffe College.Excludes Biblioteca Berenson in Florence, Italy, and the Center for HellenicStudies and the Dumbarton Oaks libraries in Washington, D.C.HOUSTONIncludes the M.D. Anderson, Architecture and Art, music, optometry, andpharmacy libraries.Salaries effective September 1,<strong>1999</strong>.HOWARDIncludes Moorland-Springarn Research Center.1998-99 beginning professional salary revised to $34,362.ILLINOIS, CHICAGOSalaries effective September 1, <strong>1999</strong>.Beginning salary for first-year Resident Librarians is $31,500.Beginning salary for tenure track positions is $36,000.INDIANAJOHNS HOPKINSExcludes Indianapolis school of law, dentistry, and medicine library; the JUPUIUniversity Library; the Herron School of Art, Columbus, and science &engineering libraries; and other campus libraries at IV East, IU Kokomo, IVNorthwest, IV Southeast, IU South Bend, and IUPV at Fort Wayne.Excludes applied physics laboratory and school of advanced internationalstudies in Bologna, Italy.Figures from the Welch Medical Library include data from the LilienfeldLibrary in the School of Hygiene and Public Health.Figures from the Weich Medical Library do not include the genome data baseor the Welch Laboratory for Applied Bioinformatics.KANSAS.Salaries reported for the main library include the Lawrence and Edwardscampuses. Salaries reported for the medical1ibrary include the Dykes Library.Excludes University of Kansas School of Medicine Library (Wichita) and theClendening History of Medicine Library (Kansas City).KENT STATEKENTUCKYLAVALLIBRARY OF CONGRESSIncludes main campus library, four branch libraries on the Kent State campus,and seven regional campus libraries.Includes the William T. Young Library, agriculture information center,architecture, art, chemistry /physics, education, engineering, equine center,geological sciences, Kentucky Transportation Center, Lexmark Technical,mathematical sciences, and music libraries; and the communications readingroom and business and economics information center.There is one general library; data for staff in law and medicallibral'ies cannot bedisaggregated.Salaries include professional and administrative positions,Beginning salary reflects a GS-9, Step 1.LOUISIANA STATEIncludes the veterinary medicine library.115
FOOTNOTES TO <strong>ARL</strong> ANNUAL SALARY SURVEY <strong>1999</strong>-<strong>2000</strong>McGILLMcMASTERMANITOBAMARYLANDMASSACHUSETTSMICHIGANIncludes the architecture and art, biology, education, mathematics andstatistics, health sciences, management, humanities and social sciences, Islamicstudies, law, Macdonald campus, music, history of medicine, physical scienceand engineering libraries; the physical education and Birks reading rooms; andthe geographical information centre.Salaries include increases effective June 16 and October 16, <strong>1999</strong>.Includes the Elizabeth Dafoe, management, sciences and technology,architecture and fine arts, music, agricultural, education, Fr. Harold Drake,and St. John's College libraries.Excludes law and medical libraries on other campuses.Includes the Dubois (main), biological sciences, music, and physical sciencesand engineering libraries.Includes graduate, undergraduate, medical, dentistry, public health & access,science, map, museums, papyrology, music, Asia, social work, biostation, Buhr,special collections, media union, film & video, fine arts, and information &library studies libraries.Excludes the Bentley Historical, Clements, business administration, and GeraldR. Ford Presidential libraries.Beginning law salary is $36,800 without J.D.; $40,800 with J.D.Law salaries effective September 1, <strong>1999</strong>.MICHIGAN STATEIncludes main, math, business, clinical, veterinary, physics, chemistry,engineering, agricultural, and economics libraries.Excludes law library.MISSOURIIncludes the Ellis, engineering, geological, veterinary medicine, journalism,newspaper, math, and university archives libraries.Law library does not have a fixed beginning salary. Figure represents beginningsalary provided for main library.NATIONAL AGRICULTURAL LIBRARYAll salaries are now tracked with benefits.NEBRASKANEW MEXICOIncludes all University of Nebraska-Lincoln campus libraries (Love,architecture, biological sciences, chemistry, engineering, geology, mathematics,music, physics, and C. Y. Thompson).Includes the Centennial Science and Engineering, fine arts, Parish Businessand Economics, and the Zimmerman libraries.Excludes Bainbridge Bunting Slide Library, College of Education TiremanEducation Resource Center, Hatwood Foundation, Native American StudiesCenter Library, Gallup Branch Campus Library, Los Alamos Branch CampusLibrary, Santa Fe Graduate Center Library, Taos Education Center, andValencia Branch Campus.The UNM health sciences center library, law school library, and the UNMgeneral library are autonomous libraries administered and funded separatelyfrom one another within the University of New Mexico.Medical Library did not report a separate beginning salary. Figure representsthe beginning salary reported for the main library.NEW YORK PUBLIC LIBRARYExcludes positions at branch libraries.116
FOOTNOTES TO <strong>ARL</strong> ANNUAL SALARY SURVEY <strong>1999</strong>-<strong>2000</strong>NEW YORK STATE LIBRARYDue to ongoing union negotiations, figures represent 1998-99 salaries.NEW YORK UNIVERSITYSalaries effective September I, <strong>1999</strong>.Includes the Bobst, Institute of Fine Arts, real estate institute, and the CourantInstitute libraries.NORTH CAROLINA STATEOHIOOHIO STATEIncludes main campus and branch libraries (design, natural resources, textiles,veterinary medicine), and separately administered libraries(LearningResources).Excludes Ohio University campus libraries in Chillicothe, Eastern, Lancaster,Southern, and Zanesville.Includes the main campus libraries, regional campus libraries, and the librariesof the Agricultural Technical Institute and the Ohio Agricultural Research andDevelopment Center.Excludes several specialized departmental research libraries on the maincampus that are not part of the University Libraries system.Administrative and professional positions do not hold faculty rank.OKLAHOMA STATEIncludes main campus libraries Edmon Low, architecture, college ofosteopathic medicine (Tulsa), curriculum materials, patent & trademark, andveterinary medicine. Also included are branch libraries in Oklahoma City andOkmulgee.The Library faculty on the main campus will receive a salary increaseaveraging 3% beginning on October 1, <strong>1999</strong>. Increases for each position will bebased upon merit and certain other factors.OREGONPENNSYLVANIA STATEPITTSBURGHIncludes the Knight, science & math, architecture & allied arts, and the map &aerial photography libraries.Includes main campus and branches at Abington College, Altoona College,Beaver, Behrend College, Berks~Lehigh Valley College, Capital College,Delaware County, DuBois, Fayette, Penn State Great Valley, Hazleton, LehighValley, McKeesport, Mont Alto, New KenSington, Schuylkill, Shenango,Wilkes~Barre, Worthington Scranton, and York.Includes the University Libraty System: Hillman, business,chemistry /computer science, engineering, fine arts, GSPIA/economics,information sciences, Langley, mathematics, music, and physics.Excludes Barco Law Library and the regional campuses at Bradford,Greensburg, Johnstown, and Titusville.PURDUEIncludes the library system on the West Lafayette campus consisting of 15departmental libraries under a single library management.Excludes regional campus libraries: Purdue Calumet, Purdue North Central,and Purdue Fort Wayne.QUEEN'SROCHESTERRUTGERSIncludes engineering/science, music, special collections (Douglas), humanitiesand social sciences (Stauffer), art, and industrial relations libraries.Includes the Rush Rhees and music libraries.Includes the New Brunswick Libraries and branches, the John Cotton DanaLibrary, Paul Robeson Library, and technical and automated services.Excludes the School of Management and Labor Relations Library and thecenter for alcohol studies.SOUTH CAROLINAIncludes Cooper, business, mathematics, and music libraries.117
FOOTNOTES TO <strong>ARL</strong> ANNUAL SALARY SURVEY <strong>1999</strong>-<strong>2000</strong>SOUTHERN CALIFORNIAExcludes Law Library.Does not include USC portion of salary for one librarian supported primarily bythe National Assembly Library of the Republic of South Korea.SOUTHERN ILLINOISSTANFORDSUNY ALBANYA four-step rank structure is used at the Medical and Law libraries whereas athree-step structure is used at the Main Library.Includes the Hoover Institution & Archives and the Jackson Business Library.Includes Undergraduate t Graduate, and Science libraries.Individuals who are not part of the rank structure are not librarians but havesecond-level administrative or supervisory responsibilities.SUNY BUFFALOIncludes University Archives, Central Technical Services, Lockwood Library,General Libraries Access Services, Music Library, Poetry /Rare Books, Scienceand Engineering Library, Undergraduate Library, Architecture and PlanningLibrary, Math LibralY.SUNY established the rank of Distinguished Librarian in 1995-96. SUNYwBuffalo does not have anyone in this new rank to date.SYRACUSETENNESSEETEXASTEXASA&MTEXAS TECHIncludes the E.S. Bird, Science & Technology, Mathematics, Geology, andPhysics libraries, and the Belfer Audio Archive and LaboratOlY.Includes main campus, branches, and law libraries.Includes General Libraries, Harry Ransom Humanities Research Center, andthe Center for American History.Instructor level eliminated effective September I, <strong>1999</strong>.Salaries for the University Library effective September 1, 1998.Includes the Main, Architecture, Southwest/Special Collections, and theInternational Cultural Center libraries.Health sciences library has four ranks for staff.TORONTOUTAHVANDERBILTVIRGINIAIncludes central libraries (Robarts, earth sciences, audio visual, East Asian,Thomas Fisher Rare Book, engineering, OISE/UI), and campus libraries(Erindale College, Scarborough College, centre for industrial relations,department of astronomy, department of criminology, department of physics,faculty of information services, school of management, and music); the St.Michael's College and the New College libraries, and the University Archives.All mainwcampus libraries now have staff in 4 ranks.Includes the central, divinity, education, management, music, science &engineering libraries; special collections & university archives; and centralizedtechnical services.Includes the graduate business, fine arts, education, music, science &engineering, undergraduate, biology/psychology, chemistry, math, physics,and astronomy libraries.Salaries effective November 25, <strong>1999</strong>.WASHINGTONIncludes the University libraries on the Seattle campus.Excludes campus libraries at Bothell and Tacoma.WASHINGTON STATEWASHINGTON U.-ST. LOUISIncludes the Pullman, Vancouver, TriwCities, and Spokane libraries; and theenergy library and the Intercollegiate Center for Nursing Education (ICNE).Includes the central, social work, and business libraries.118
FOOTNOTES TO <strong>ARL</strong> ANNUAL SALARY SURVEY <strong>1999</strong>-<strong>2000</strong>WATERLOOIncludes the Dana Porter, Davis Centre, and University map and designlibraries.WAYNE STATEIncludes the Purdy /Kresge, science and engineering, undergraduate, andOakland Center libraries.Excludes the Reuther Archives of Labor and Urban Affairs.WESTERN ONTARIOIncludes the D.B. Weldon Library; and the business, education, and musiclibralies.Excludes affiliated college libraries (King's College, Brescia College, HuronCollege).WISCONSINYORKDue to union negotiations, figures represent 1998~99 salaries.Includes archives and special collections, business and governmentpublications, and the Leslie Frost, law, map, Scott, sound and moving image,and Steacie Science libraries.Salaries are estimated since contract negotiations have not concluded.Administrative stipends are included.119
APPENDIXES
APPENDIX A<strong>ARL</strong> MEMBER LIBRARIESThe Association of Research Libraries (<strong>ARL</strong>) represents the interests of 121 libraries that serve major North American researchinstitutions. <strong>ARL</strong> operates as a forum for the exchange of ideas and as an agent for collective action to influence the forces affecting theability of these libraries to meet the future needs of scholarship. The <strong>ARL</strong> Statistics and Measurement Program is organized aroundidentifying, collecting, analyzing, and dish'ibuting quantifiable information describing the characteristics of research libraries. The programoffers publications and special member services, and collaborates with other national and international library statistics programs. Datacollected include salaries, library holdings, expendihtres, staff, interlibrary lending, and preservation activities.The members of the Association are:Institution Category: Full Name of Institution LocationAlabama S University of Alabama Tuscaloosa, AlabamaAlberta C University of Alberta Edmonton AlbertaArizona S University of Arizona Tucson, ArizonaArizona State S Arizona State University Tempe, ArizonaAuburn S Auburn University Auburn, AlabamaBoston P Boston University Boston, MassachusettsBrigham Young P Brigham Young University Provo, UtahBritish Columbia C University of British Columbia Vancouver, British ColumbiaBrown P Brown University Providence, Rhode IslandCalifornia, Berkeley S University of California, Berkeley Berkeley, CaliforniaCalifornia, Davis S University of California, Davis Davis, CaliforniaCalifornia, Irvine S University of California, Irvine Irvine, CaliforniaCalifornia, Los Angeles S University of California, Los Angeles Los Angeles, CaliforniaCalifornia, Riverside S University of California, Riverside Riverside, CaliforniaCalifomia, San Diego S University of Califomia, San Diego La Jolla, CaliforniaCalifornia, Santa Barbara S University of California, Santa Barbara Santa Barbara, CaliforniaCase Western Reserve P Case Western Reserve University Cleveland, OhioChicago P University of Chicago Chicago, IllinoisCincinnati S UniverSity of CincUulati Cincinnati, OhioColorado S University of Colorado Boulder, ColoradoColorado State S Colorado State University Fort Collins, ColoradoColumbia P Columbia University New York, New YorkCOlUlCCticut S University of Connecticut Storrs, ConnecticutCornell P Cornell University Ithaca, New YorkDarbnouth P Dartmouth College Hanover, New HampshireDelaware S University of Delaware Newark, DelawareDuke P Duke University Durham, North CarolinaEmory P Emory University Atlanta, GeorgiaFlorida S University of Florida Gainesville, FloridaFlorida State S Florida State University Tallahassee, FloridaGeorge Washington P George Washington University Washington, DCGeorgetown P Georgetown University Washington, DCGeorgia S University of Georgia Athens, GeorgiaGeorgia Tech S Georgia Institute of Tedmology Atlanta, GeorgiaGuelph C University of Guelph Guelph, OntarioHarvard P Harvard University Cambridge, MassachusettsHawaii S University of Hawaii Honolulu, HawaiiHouston S University of Houston Houston, TexasHoward P Howard University Washington, DCIllinois, Chicago S University of Illinois at Chicago Chicago, IllinoisIllinois, Urbana S University of Illinois at Urbana Urbana, IllinoisIndiana S Indiana University Bloomington, IndianaIowa S University of Iowa Iowa City, IowaIowaSfate S Iowa State University Ames, IowaJolms Hopkins P Johns Hopkins University Baltimore, MarylandKansas S University of Kansas Lawrence, KansasKent State S Kent State University Kent, OhioKentucky S University of Kentucky LeXington, KentuckyLaval C Laval University QuebecLouisiana State S Louisiana State University Baton Rouge, LouisianaMcGill C McGill University Montreal, QuebecMcMaster C McMaster University Hamilton, OntarioManitoba C University of Manitoba Winnipeg, ManitobaMaryland S University of M81yland College Park, MarylandMassachusetts S University of Massachusetts Amherst, Massad\usettsS-U.S. public university P-U,S. private university N-U.S. nonuniversity library C-Canadian university X-Canadian nonuniversity123
InstitutionCategoryFull Name of InstitutionLocationMITPMiamiPMichiganSMichigan StateSMinnesotaSMissouriSNebraskaSNew MexicoSNew YorkPNorth CarolinaSNorth Carolina State SNorthwesternPNoh'e DamePOhioSOhio StateSOklahomaSOklahoma StateSOregonSPelU1sylvaniaPPennsylvania State SPittsburghSPrincetonPPurdueSQueen!sCRicePRochesterPRutgersSSaskatchewanCSouth CarolinaSSouthern California PSouthern IllinoisSStanfordPSUNY.AlbanySSUNY-Buffalo 5SUNY -Stony Brook SSyracusePTempleSTennesseeSTexasSTexas A&MSTexas TechSTorontoCTulanePUtahSVanderbiltPVirginiaSVPI &SU 5WashingtonSWashington StateSWashington U.-St. Louis PWaterlooCWayne StateSWestern OntarioCWisconsinSYalePYorkCMassachusetts Institute of TechnologyUniversity of MiamiUniversity of MichiganMichigan State UniversityUniversity of MinnesotaUniversity of MissouriUniversity of Nebraska-LincolnUniversity of New MexicoNew York UniversityUniversity of North CarolinaNorth Carolina State UniversityNorthwestern UniversityUniversity of Notre DameOhio UniversityOhio State UniversityUniversity of OklahomaOklahoma State UniversityUniversity of OregonUniversity of PennsylvaniaPennsylVania State UniversityUniversity of PittsburghPrinceton UniversityPurdue UniversityQueen's UniversityRice UniversityUniversity of RochesterRutgers UniversityUniversity of SaskatchewanUniversity of South CarolinaUniversity of Southern CaliforniaSouthern Illinois UniversityStanford UniversityState University of New York at AlbanyState University of New York at BuffaloState University of New York at Stony BrookSyracuse UniversityTemple UniversityUniversity of TennesseeUniversity of TexasTexas A&M UniversityTexas TechUniversity of TorontoTulane UniversityUniversity of UtahVanderbilt UniversityUniversity of VirginiaVirginia Polyteclmic Institute & State UniversityUniversity of WashingtonWashington State UniversityWashington UniversityUniversity of WaterlooWayne State UniversityUniversity of Westem OntarioUniversity of WisconsinYale UniversityYork UniversityCambridge, MassachusettsCoral Gables, FloridaAnn Arbor, MichiganEast LanSing, MichiganMilUleapolis, MinnesotaColumbia, MissouriLincoln, NebraskaAlbuquerque, New MexicoNew York, New YorkChapel Hill, North CarolinaRaleigh, North CarolinaEvanston, IllinoisNoh'e Dame, IndianaAthens, OhioColumbus, OhioNorman, OklahomaStillWater, OklahomaEugene, OregonPhiladelphia, PennsylvaniaUniversity Park Pennsylval'tiaPittsburgh, PelmsylvaniaPrinceton, New JerseyWest Lafayette, IndianaKingston, OntarioHouston, TexasRochester, New YorkNew Brunswick, New JerseySaskatoon, SaskatchewanColumbia, South CarolinaLos Angeles, CaliforniaCarbondale, IllinoisStanford, CaliforniaAlbany, New YorkBuffalo, New YorkStony Brook, New YorkSyracuse, New YorkPhiladelphia, PelU1sylvaniaKnoxville, TelmesseeAustin, TexasCollege Station, TexasLubbock, TexasToronto, OntarioNew Orleans, LouisianaSalt Lake City, UtahNashville, TennesseeCharlottesville, VirginiaBlacksburg, VirginiaSeattle, WashingtonPullman, WashingtonSt. Louis, MissouriWaterloo, OntarioDetroit, MichiganLondon, OntarioMadison, WisconsinNew Haven, ConnecticutNorth York, OntadoBoston Public LibraryCanada Inst. for SciTechCenter for Research Libs.Library of CongressNatl. Agricultural Lib.Natl. Library of CanadaNatl. Library of MedicineNew York Public LibraryNew York State LibrarySmithsonian InstitutionNXNNNXNNNNBoston Public LibraryCanada Inst. for Scientific & Technical InformationCenter for Research LibrariesLibrary of CongressNational Agricultural LibraryNational Library of CanadaNational Library of MedicineNew York Public LibraryNew York State LibrarySmithsonian InstitutionBoston, MassachusettsOttawa, OntarioChicago, IllinoisWashington, DCBeltsville, MarylandOttawa, OntarioBet~1Csda, MarylandNew York, New YorkAlbany, New YorkWashington, DCS U.S. public university P U.S. private university N-U.S. Ilolluiliversity library C Canadian university X Canadian nonuniversity124
ApPENDIXBTABLE NUMBERING CHANGES <strong>1999</strong>-<strong>2000</strong>For <strong>1999</strong>-<strong>2000</strong> a number of new tables were added to the publication and some old tables were renumbered. As a result ofthese changes, there is now a new section entitled U.S. ARt University Libraries that includes two new tables (Tables 26 and 29).Two new tables showing averages for all U.S. and Canadian institutions are included as Table 3 and Table 4. The table below mapsthe old table-numbering scheme to the new one for purposes of comparison.OldNew12N/AN/A2345678910111314151719212222b2323b24123456789101112131415]6171819202122232425SALARY LEVELS FOR STAFF IN <strong>ARL</strong> LIBRARIESDistribution by <strong>Salary</strong> Level<strong>Salary</strong> Trends in <strong>ARL</strong> University Libraries<strong>Salary</strong> Trends in U.S. <strong>ARL</strong> University Libraries<strong>Salary</strong> Trends in Canadian <strong>ARL</strong> University Libraries<strong>ARL</strong> NONUNIVERSITY LIBRARIESMedian and Beginning Professional Salaries in <strong>ARL</strong> Nonuniversity Libraries<strong>Salary</strong> Trends in <strong>ARL</strong> Nonuniversity Libraries<strong>ARL</strong> UNIVERSITY LIBRARIESFilled Positions; Average, Median, Beginning Professional Salaries;And Average Years of Professional Experience in <strong>ARL</strong> University Libraries, FY <strong>1999</strong>-<strong>2000</strong>Beginning Professional Salaries in <strong>ARL</strong> University Libraries;Rank Order Table, FY 1998-99Beginning Professional Salaries in <strong>ARL</strong> University Libraries;Rank Order Table, FY <strong>1999</strong>-<strong>2000</strong>Median Professional Salaries in <strong>ARL</strong> University Libraries;Rank Order Table, FY 1998-99Median Professional Salaries in <strong>ARL</strong> University Libraries;Rank Order Table, FY <strong>1999</strong>-<strong>2000</strong>Average Professional Salaries in <strong>ARL</strong> University Libraries;Rank Order Table, FY 1998-99Average Professional Salaries in <strong>ARL</strong> University Libraries;Rank Order Table, FY <strong>1999</strong>-<strong>2000</strong>Average, Median, and Beginning Professional Salaries in <strong>ARL</strong> University Libraries;Summary of Rankings, FYs 1996-97 to <strong>1999</strong>-<strong>2000</strong>Distribution of Professional Staff in <strong>ARL</strong> University Librariesby <strong>Salary</strong> and Position, FY <strong>1999</strong>-<strong>2000</strong>Distribution of Professional Staff in <strong>ARL</strong> University Librariesby <strong>Salary</strong>, Sex, and Position, FY <strong>1999</strong>-<strong>2000</strong>Number and Average Salaries of <strong>ARL</strong> University Librariansby Position and Sex, FY <strong>1999</strong>-<strong>2000</strong>Number and Average Years of Experience of <strong>ARL</strong> University Librariansby Position and Sex, FY <strong>1999</strong>-<strong>2000</strong>Number and Average Salaries of <strong>ARL</strong> University Librariansby Years of Experience and Sex, FY <strong>1999</strong>-<strong>2000</strong>. Average Salaries of <strong>ARL</strong> University Librarians by Years of Experience, FY <strong>1999</strong>-<strong>2000</strong>Number and Average Salaries of <strong>ARL</strong> University Librariansby Position and Type of Institution, FY <strong>1999</strong>-<strong>2000</strong>Years of Experience of <strong>ARL</strong> University Librariansby Position and Type of Institution, FY <strong>1999</strong>-<strong>2000</strong>Number and Average Salaries of <strong>ARL</strong> University Librariansby Position and Size of Professional Staff, FY <strong>1999</strong>-<strong>2000</strong>Years of Experience of <strong>ARL</strong> University Librariansby Position and Size of Professional Staff, FY <strong>1999</strong>-<strong>2000</strong>Average Salaries of <strong>ARL</strong> University Librariansby Position and Geographic Region, FY <strong>1999</strong>-<strong>2000</strong>125
OldNewN/A1618N/A202526272829303132333435363738394041422627282930313233343536373839404142434445464748u.s. <strong>ARL</strong> UNIVERSITY LIBRARIESAverage Salaries of U.S. <strong>ARL</strong> University Librarianssby Position and Years of Expereince, FY <strong>1999</strong>-<strong>2000</strong>Number and Average Salaries of Minority U.S, <strong>ARL</strong> University Librariansby Position and Sex, FY <strong>1999</strong>-<strong>2000</strong>Number and Average Years of Experience of Minority U.S.-<strong>ARL</strong> University Librariansby Position and Sex, FY <strong>1999</strong>-<strong>2000</strong>Number and Average Salaries of U.S. <strong>ARL</strong> University Librariansby Years of Experience and Sex, FY <strong>1999</strong>-<strong>2000</strong>Number and Average Salaries of Minority U.S. <strong>ARL</strong> University Librariansby Years of Experience and Sex, FY <strong>1999</strong>-<strong>2000</strong>CANADIAN <strong>ARL</strong> UNIVERSITY LIBRARIESFilled Positions; Average, Median, and Beginning Professional Salaries; and AverageYears of Professional Experience in Canadian <strong>ARL</strong> University Libraries, FY <strong>1999</strong>-<strong>2000</strong>Number and Average Salaries of Canadian <strong>ARL</strong> University Librariansby Position and Sex, FY <strong>1999</strong>-<strong>2000</strong>Number and Average Years of Experience of Canadian <strong>ARL</strong> University Librariansby Position and Sex, FY <strong>1999</strong>-<strong>2000</strong>Number and Average Salaries of Canadian <strong>ARL</strong> University Librariansby Years of Experience and Sex, FY <strong>1999</strong>-<strong>2000</strong><strong>ARL</strong> UNIVERSITY MEDICAL LIBRARIESFilled Positions; Average, Median, Beginning Professional Salaries; and AverageYears of Professional Experience in <strong>ARL</strong> University Medical Libraries, FY <strong>1999</strong>-<strong>2000</strong>Beginning Professional Salaries in <strong>ARL</strong> University Medical Libraries;Rank Order Table, FY <strong>1999</strong>-<strong>2000</strong>Median Professional Salaries in <strong>ARL</strong> University Medical Libraries;Rank Order Table, FY <strong>1999</strong>-<strong>2000</strong>Average Professional Salaries in <strong>ARL</strong> University Medical Libraries;Rank Order Table, FY <strong>1999</strong>-<strong>2000</strong>Number and Average Salaries of <strong>ARL</strong> University Medical Librariansby Position and Sex, FY <strong>1999</strong>-<strong>2000</strong>Number and Average Years of Experience of <strong>ARL</strong> University Medical Librariansby Position and Sex, FY <strong>1999</strong>-<strong>2000</strong>Number and Average Salaries of <strong>ARL</strong> University Medical Librariansby Years of Experience and Sex, FY <strong>1999</strong>-<strong>2000</strong><strong>ARL</strong> UNIVERSITY LAW LIBRARIESFilled Positions; Average, Median, Beginning Professional Salaries; and AverageYears of Experience in <strong>ARL</strong> University Law Libraries, FY <strong>1999</strong>-<strong>2000</strong>Beginning Professional Salaries in <strong>ARL</strong> University Law Libraries;Rank Order Table, FY <strong>1999</strong>-<strong>2000</strong>Median Professional Salaries in <strong>ARL</strong> University Law Libraries;Rank Order Table, FY <strong>1999</strong>-<strong>2000</strong>Average Professional Salaries in <strong>ARL</strong> University Law Libraries;Rank Order Table, FY <strong>1999</strong>-<strong>2000</strong>Number and Average Salaries of <strong>ARL</strong> University Law Librariansby Position and Sex, FY <strong>1999</strong>-<strong>2000</strong>Number and Average Years of Experience of <strong>ARL</strong> University Law Librariansby Position and Sex, FY <strong>1999</strong>-<strong>2000</strong>Number and Average Salaries of <strong>ARL</strong> University Law Librariansby Years of Experience and Sex, FY <strong>1999</strong>-<strong>2000</strong>126
<strong>ARL</strong> Statistics and Measurement ProgramPUBLICATIONS AND SERVICEShttp://www.arl.org<strong>ARL</strong> Academic Law and Medical Library StatisticsISSN 1088-1093· Back issues are available· Standing order: $79 ($39 <strong>ARL</strong> members)Yearly report of data for collections' size and growth, materials and operating expenditures,staffing, and public service activities in <strong>ARL</strong> university law and medical libraries. Includescomparisons to the larger research collections at each university.<strong>ARL</strong> Preservation StatisticsISSN 1050-7442 • Back issues are available· Standing order: $65 ($35 <strong>ARL</strong> members)<strong>Annual</strong> compilation of data on current levels of preservation efforts and reports on the keyorganizational, functional, and fiscal components comprising <strong>ARL</strong> preservation programs.<strong>ARL</strong> StatisticsISSN 0147-2135 • Back issues are available· Standing order: $79 ($39 <strong>ARL</strong> members)<strong>Annual</strong> compilation of data on collection size and growth, materials and operating expenditures,staffing, and library services. The most comprehensive resource for information onresearch library operations and trends.Developing Indicators for Academic Library Performance: Ratios from the <strong>ARL</strong> StatisticsISSN 1084-9459 • Back issues are available· Standing order: $50 ($25 <strong>ARL</strong> members)Presents 30 selected ratios that describe changes in internal library operations, as well asresources per faculty and per student, for <strong>ARL</strong> university libraries over a two-year period.User <strong>Survey</strong>s in Academic LibrariesThis workshop presents the basic concepts and steps for conducting a user survey: definingobjectives, sampling, measurement scales, logistics, data analysis, and report writing.Electronic Publishing of Data Sets on the World Wide WebThis three-day workshop is designed for librarians, information professionals, and educators.It provides hands-on experience in developing interfaces for publishing and analyzing social,economic, and other numeric data sets on the WWW.Customized ServicesFor any dataset produced by <strong>ARL</strong>, one can request comparative institutional data and <strong>ARL</strong>will perform the analysis and provide tables and reports in the format best suited to the need.For more information on any of these products or services, please contact Martha K yrillidou,Senior Program Officer for Statistics and Measurement, at 202-296-2296 or email.
<strong>ARL</strong>ASSOCIATION OF REl:~a:ISSN 0361-5669