
You also want an ePaper? Increase the reach of your titles
YUMPU automatically turns print PDFs into web optimized ePapers that Google loves.
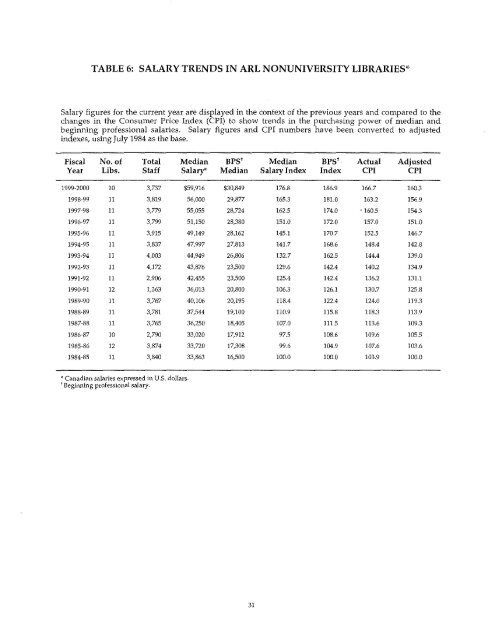
TABLE 6: SALARY TRENDS IN <strong>ARL</strong> NONUNIVERSITY LIBRARIES*<strong>Salary</strong> figures for the current year are displayed in the context of the previous years and compared to thechanges in the Consumer Price Index (CPl) to show trends in the purchasing power of median andbeginning professional salaries. <strong>Salary</strong> figures and CPI numbers have been converted to adjustedindexes, using July 1984 as the base.Fiscal No. of Total Median BPS' Median BPS' Actual AdjustedYear Libs. Staff <strong>Salary</strong>* Median <strong>Salary</strong> Index Index CPI CPI<strong>1999</strong>-<strong>2000</strong> 10 3,737 $59,916 $30,849 176.8 186.9 166.7 160.31998·99 11 3,819 56,000 29,877 165.3 181.0 163.2 156.91997-98 11 3,779 55,055 28,724 162.5 174.0 . 160.5 154.31996·97 11 3,799 51,150 28,380 151.0 ]72.0 157.0 151.01995-96 11 3,915 49,149 28,162 145.1 170.7 152.5 146.71994·95 11 3,837 47,997 27,813 141.7 168.6 148.4 142.81993-94 11 4,003 44,949 26,806 132.7 162.5 144.4 139.01992-93 11 4,172 43,876 23,500 129.6 142.4 140.2 134.91991-92 11 2,906 42,455 23,500 125.4 142.4 136.2 131.11990-91 12 1,363 36,013 20,800 106.3 126.1 130.7 125.81989-90 11 3,767 40,106 20,195 118.4 122.4 124.0 119.31988-89 11 3,781 37,544 19,100 110.9 115.8 118.3 1l3.91987-88 11 3,765 36,250 18,405 107.0 111.5 113.6 109.31986-87 10 2,790 33,020 17,912 97.5 108.6 109.6 105.51985-86 12 3,874 33,720 17,308 99.6 104.9 107.6 103.61984-85 11 3,840 33,863 16,500 100.0 100.0 103.9 100.0>I- Canadian salaries expressed in U.S. dollars.t Begi11l1ing professional salary.31