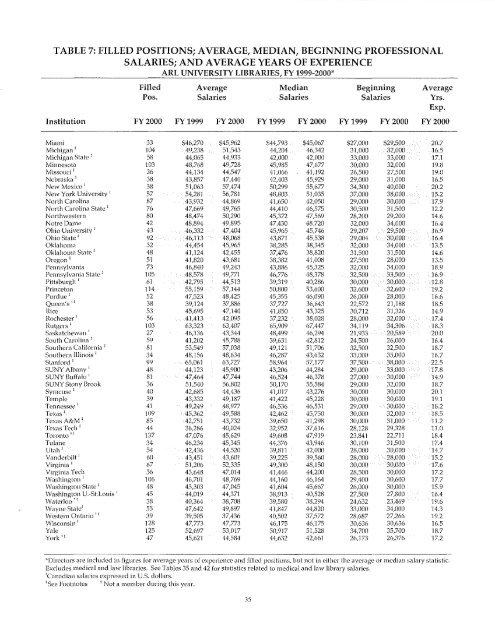
TABLE 7: FILLED POSITIONS; AVERAGE, MEDIAN, BEGINNING PROFESSIONALSALARIES; AND AVERAGE YEARS OF EXPERIENCE<strong>ARL</strong> UNIVERSITY LIBRARIES, FY <strong>1999</strong>-<strong>2000</strong>*Filled Average Median Beginning AveragePos. Salaries Salaries Salaries Yrs.Exp.Institution FY <strong>2000</strong> FY <strong>1999</strong> FY <strong>2000</strong> FY <strong>1999</strong> FY <strong>2000</strong> FY <strong>1999</strong> FY <strong>2000</strong> FY <strong>2000</strong>Miami 33 $46,270 $45,962 $44,793 $45,()67 $27,000 $2Y,SOD 20.7Michigan! ](}4 49,238 51,543 44,204 46,342 3"l,OOO 32,000 16.5Michigan Stiltc 1 58 44,065 44,933 42,000 42,000 33,000 33,000 17.1Minnesol
TABLES: BEGINNING PROFESSIONAL SALARIES IN <strong>ARL</strong> UNIVERSITY LIBRARIESRANK ORDER TABLE, FY 1998-99"Rank Institution <strong>Salary</strong> Rank Institution <strong>Salary</strong>1 Howard $40,000 50 Temple $30,0002 Georgetown 38,357 50 Texas 30,0003 Stanford 37,500 50 TexasA&M 30,0004 New York 37,000 50 Virginia 30,0005 Kent State 36,667 60 Cornell 29,5006 Colorado State 36,000 60 Emory 29,5006 Columbia 36,000 62 Boston 29,4258 Connecticut 35,500 63 Washington 29,4009 Arizona 34,921 64 Ohio 29,20710 Yale 34,700 65 Ohio State 29,00411 Harvard 34,300 66 Georgia Tech 29,00011 New Mexico 34,300 66 Nebraska 29,00013 Rutgers 34,119 66 North Carolina 29,00014 Johns Hopkins 33,956 66 SUNY Albany 29,00015 Hawaii 33,312 66 SUNY Stony Brook 29,00016 Michigan State 33,000 66 Tennessee 29,00016 Southern Illinois 33,000 72 Western Ontario 28,68716 Wayne State 33,000 73 Brigham Young 28,50019 Princeton 32,600 73 Georgia 28,50020 Chicago 32,500 73 Louisiana State 28,50020 Pennsylvania State 32,500 73 Virginia Tech 28,50020 Southern California 32,500 77 Northwestern 28,20023 Notre Dame 32,000 78 Texas Tech 28,12823 Oklahoma 32,000 79 Arizona State 28,00023 Pennsylvania 32,000 79 Florida 28,00026 Calif. Berkeley 31,656 79 Kentucky 28,00026 Calif. Davis 31,656 79 Rochester 28,00026 Calif. Irvine 31,656 79 Utah 28,00026 Calif. Los Angeles 31,656 79 Vanderbilt 28,00026 Calif. Riverside 31,656 85 Oregon 27,50026 Calif. San Diego 31,656 85 Wash Univ ~ St Louis 27,50026 Calif. Santa Barbara 31,656 87 Houston 27,00033 Colorado 31,500 87 Miami 27,00033 Oklahoma State 31,500 87 SUNY Buffalo 27,00035 Indiana 31,039 90 Guelph t 26,97036 Dartmouth 31,000 91 Missouri 26,50036 Illinois, Urbana 31,000 92 York t 26,17336 Massachusetts 31,000 93 Alabama 26,00036 MIT 31,000 93 Kansas 26,00036 Michigan 31,000 93 Purdue 26,00041 Rice 30,712 93 Washington State 26,00042 Wisconsin 30,636 97 Cincinnati 25,00043 Duke 30,550 97 Florida State 25,00044 Illinois, Chicago 30,500 99 Maryland 24,81944 North Carolina State 30,500 10O Waterloo t 24,63246 Auburn 30,450 101 South Carolina 24,50047 Case Western Reserve 30,410 102 British Columbia t 24,49748 Brown 30,200 103 McMaster f 24,02349 Tulane 30,100 104 McGill t 23,98350 Delaware 30,000 105 Toronto t 23,84150 Iowa 30,000 106 Laval t 23,76450 Iowa State 30,000 107 Alberta t 23,52850 Minnesota 30,000 108 Queen's t 22,57250 Pittsburgh 30,000 109 Manitoba t 22,39350 Syracuse 30,000 110 Saskatchewan t 21,933~. Reprinted from <strong>ARL</strong> <strong>Annual</strong> <strong>Salary</strong> <strong>Survey</strong> 1998-99. Beginning salary figures represent officially designated base, not necessarily salariesof actual incumbents. Excludes medical and law libraries. See Tables 36 and 43 for statistics related to medical and law librarysalaries.t Canadian salaries expressed in U.S. dollars.36