
You also want an ePaper? Increase the reach of your titles
YUMPU automatically turns print PDFs into web optimized ePapers that Google loves.
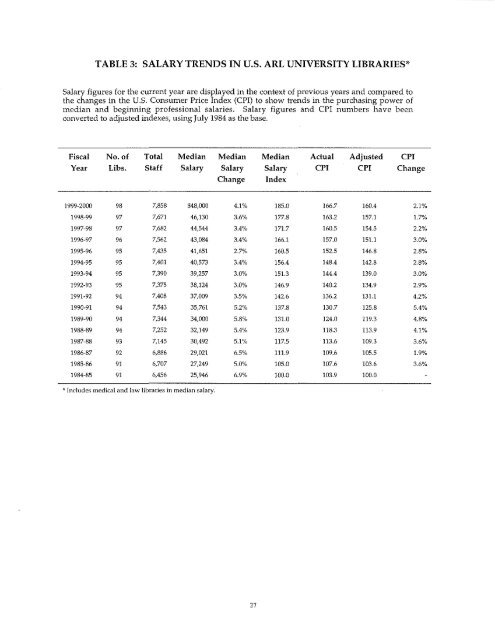
TABLE 3: SALARY TRENDS IN U.S. <strong>ARL</strong> UNIVERSITY LIBRARIES*<strong>Salary</strong> figures for the current year are displayed in the context of previous years and compared tothe changes in the U.S. Consumer Price Index (CPI) to show trends in the purchasing power ofmedian and beginning professional salaries. <strong>Salary</strong> figures and CPI numbers have beenconverted to adjusted indexes, using July 1984 as the base.Fiscal No. of Total Median Median Median Actual Adjusted CPIYear Libs. Staff <strong>Salary</strong> <strong>Salary</strong> <strong>Salary</strong> CPI CPI ChangeChange Index<strong>1999</strong>-<strong>2000</strong> 98 7,858 $48,000 4.1% 185.0 166.7 160.4 2.1%1998-99 97 7,671 46,130 3.6% 177.8 163.2 157.1 1.7'101997-98 97 7,682 44,544 3.4% 171.7 160.5 154.5 2.2%1996-97 96 7,562 43,084 3.4% 166.1 157.0 151.1 3.0%1995-96 95 7,435 41,651 2.7% 160.5 152.5 146.8 2.8%1994-95 95 7,401 40,573 3.4% 156.4 148.4 142.8 2.8%1993-94 95 7,390 39,257 3.0% 151.3 144.4 139.0 3.0%1992-93 95 7,375 38,124 3.0% 146.9 140.2 134.9 2.9'%1991-92 94 7,408 37,009 3.5% 142.6 136.2 131.1 4.2%1990-91 94 7,543 35,761 5.2% 137.8 130.7 125.8 5.4%1989-90 94 7,344 34,000 5.8% 131.0 124.0 119.3 4.8%1988-89 94 7,252 32,149 5.4% 123.9 118.3 113.9 4.1%1987-88 93 7,145 30,492 5.1% 117.5 113.6 109.3 3.6'Yo1986-87 92 6,886 29,021 6.5% 111.9 109.6 105.5 1.9%1985-86 91 6,707 27,249 5.0% 105.0 107.6 103.6 3.6%1984-85 91 6,456 25,946 6.9% 100.0 103.9 100.0OJ- Includes medical and law libraries in median salary.27