
Create successful ePaper yourself
Turn your PDF publications into a flip-book with our unique Google optimized e-Paper software.
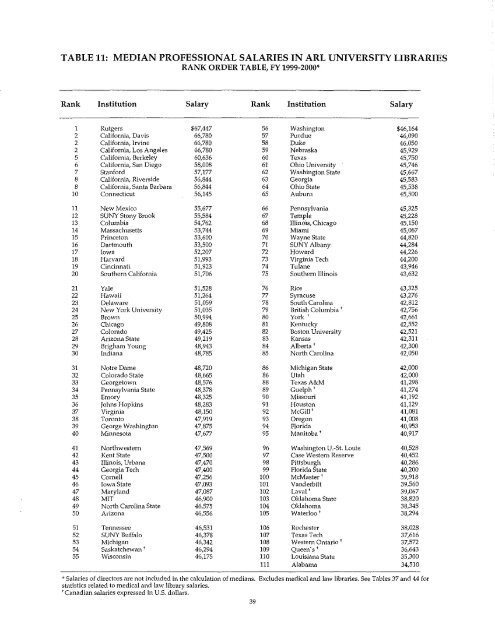
TABLE 11: MEDIAN PROFESSIONAL SALARIES IN <strong>ARL</strong> UNIVERSITY LIBRARIESRANK ORDER TABLE, FY <strong>1999</strong>-<strong>2000</strong>*Rank Institution <strong>Salary</strong> Rank Institution <strong>Salary</strong>1 Rutgers $67,447 56 Washington $46,1642 California, Davis 66,780 57 Purdue 46,0902 California, Irvine 66,780 58 Duke 46,0502 California, Los Angeles 66,780 59 Nebraska 45,9295 California, Berkeley 60,636 60 Texas 45,7506 California, San Diego 58,008 61 Ohio University 45,7467 Stanford 57,177 62 Washington State 45,6678 California, Riverside 56,844 63 Georgia 45,5838 Caiifol'llia, Santa Barbara 56,844 64 Ohio State 45,53810 Connecticut 56,145 65 Auburn 45,50011 New Mexico 55,677 66 Pennsylvania 45,32512 SUNY Stony Brook 55,584 67 Temple 45,22813 Columbia 54,762 68 Illinois, Chicago 45,15014 Massachusetts 53,744 69 Miami 45,06715 Princeton 53,600 70 Wayne State 44,82016 Dartmouth 53,500 71 SUNY Albany 44,28417 Iowa 52,207 72 Howard 44,22618 Harvard 51,993 73 Virginia Tech 44,20019 Cincinnati 51,923 74 Tulane 43,94620 Southern California 51,706 75 Southern Jllinois 43,63221 Yale 51,528 76 Rice 43,32522 Hawaii 51,264 77 Syracuse 43,27623 Delaware 51,059 78 South Carolina 42,81224 New York University 51,035 79 British Columbia t 42,75625 Brown 50,994 80 York t 42,66126 Chicago 49,808 81 Kentucky 42,55227 Colorado 49,425 82 Boston University 42,52128 Arizona State 49,219 83 Kansas 42,31129 Brigham Young 48,943 84 Alberta t 42,30030 Indiana 48,785 85 North Carolina 42,05031 Notre Dame 48,720 86 Michigan State 42,00032 Colorado State 48,665 86 Utah 42,00033 Georgetown 48,576 88 TexasA&M 41,29834 Permsylvania State 48,378 89 Guelph t 41,27435 Emory 48,325 90 Missouri 41,19236 Johns Hopkins 48,283 91 Houston 41,12937 Virginia 48,150 92 McGill t 41,08138 Toronto 47,919 93 Oregon 41,00839 George Washington 47,875 94 Florida 40,95340 Minnesota 47,677 95 Manitoba t 40,91741 Northwestern 47,569 96 Washington U.-St. Louis 40,52842 Kent State 47,500 97 Case Western Reserve 40,45243 Illinois, Urbana 47,470 98 Pittsburgh 40,28644 Georgia Tech 47,400 99 Florida State 40,20045 Cornell 47,256 100 McMaster t 39,91846 Iowa State 47,093 101 Vanderbilt 39,56047 Maryland 47,087 102 Laval t 39,06748 MIT 46,900 103 Oklahoma State 38,82049 North Carolina State 46,575 104 Oklahoma 38,34550 Arizona 46,556 105 Waterloo t 38,29451 Tennessee 46,531 106 Rochester 38,02852 SUNY Buffalo 46,378 107 Texas Tech 37,61653 Michigan 46,342 108 Western Ontario t 37,57254 Saskatchewan t 46,294 109 Queen's t 36,64355 Wisconsin 46,175 110 Louisiana State 35,300111 Alabama 34,510* Salaries of directors are not included in the calculation of medians. Excludes medical and law libraries. See Tables 37 and 44 forstatistics related to medical and law library salaries.t Canadian salaries expressed in U.S. dollars.39