
Create successful ePaper yourself
Turn your PDF publications into a flip-book with our unique Google optimized e-Paper software.
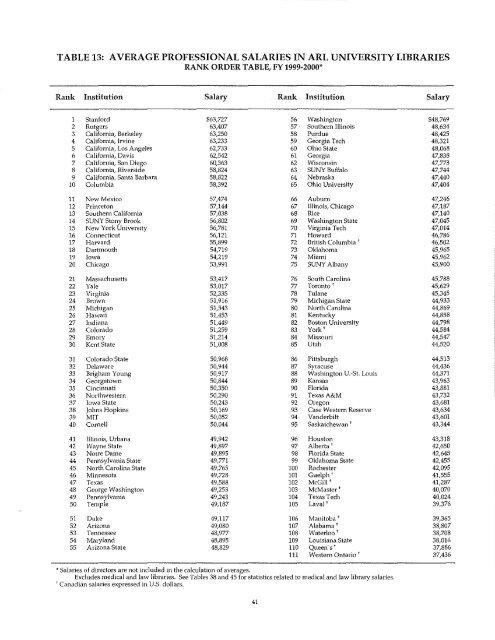
TABLE 13: AVERAGE PROFESSIONAL SALARIES IN <strong>ARL</strong> UNIVERSITY LIBRARIESRANK ORDER TABLE, FY <strong>1999</strong>-<strong>2000</strong>*Rank Institution <strong>Salary</strong> Rank Institution <strong>Salary</strong>1 Stanford $63,727 56 Washington $48,7692 Rutgers 63,407 57 Southern Illinois 48,6343 California, Berkeley 63,250 58 Purdue 48,4254 California, Irvine 63,233 59 Georgia Tech 48,3215 California, Los Angeles 62,733 60 Ohio State 48,0686 California, Davis 62,542 61 Georgia 47,8387 California, San Diego 60,363 62 Wisconsin 47,7738 California, Riverside 58,824 63 SUNY Buffalo 47,7449 California, Santa Barbara 58,822 64 Nebraska 47,44010 Columbia 58,392 65 Ohio University 47,40411 New Mexico 57,474 66 Auburn 47,24612 Princeton 57,144 67 Illinois, Chicago 47,18713 Southern California 57,038 68 Rice 47,14014 SUNY Stony Brook 56,802 69 Washington State 47,04515 New York University 56,781 70 Virginia Tech 47,01416 Connecticut 56,121 71 Howard 46,78617 Harvard 55,899 72 British Columbia t 46,50218 Dartmouth 54,719 73 Oklahoma 45,96519 Iowa 54,219 74 Miami 45,96220 Chicago 53,991 75 SUNY Albany 45,90021 Massachusetts 53,417 76 South Carolina 45,78822 Yale 53,017 77 Toronto t 45,62923 Virginia 52,335 78 Tulane 45,34524 Brown 51,916 79 Michigan State 44,93325 Michigan 51,543 80 North Carolina 44,86926 Hawaii 51,453 81 Kentucky 44,85827 Indiana 51,449 82 Boston University 44,79828 Colorado 51,259 83 York t 44,58429 Emory 51,214 84 Missouri 44,54730 Kent State 51,008 85 Utah 44,52031 Colorado State 50,968 86 Pittsburgh 44,51332 Delaware 50,944 87 Syracuse 44,43633 Brigham Young 50,917 88 Washington U.-St. Louis 44,37134 Georgetown 50,844 89 Kansas 43,96335 Cincinnati 50,350 90 Florida 43,88136 Northwestern 50,290 91 TexasA&M 43,73237 Iowa State 50,243 92 Oregon 43,68138 Johns Hopkins 50,169 93 Case Western Reserve 43,63439 MIT 50,052 94 Vanderbilt 43,60140 Cornell 50,044 95 Saskatchewan t 43,34441 Illinois, Urbana 49,942 96 Houston 43,31842 Wayne State 49,897 97 Alberta t 42,65043 Notre Dame 49,895 98 Florida State 42,64544 Pennsylvania State 49,771 99 Oklahoma State 42,45545 North Carolina State 49,765 100 Rochester 42,09546 Minnesota 49,728 101 Guelph t 41,55547 Texas 49,588 102 McGill t 41,28748 George Washington 49,253 103 McMaster t 40,07049 Pennsylvania 49,243 104 Texas Tech 40,02450 Temple 49,187 105 Laval t 39,37651 Duke 49,117 106 Manitoba t 39,36552 Arizona 49,080 107 Alabama t 38,80753 Tennessee 48,977 108 Waterloo t 38,70854 Maryland 48,895 109 Louisiana State 38,01655 Arizona State 48,829 110 Queen's t 37,886111 Western Ontario t 37,436* Salaries of directors are not included in the calculation of averages.Excludes medical and law libraries. See Tables 38 and 45 for statistics related to medical and law library salaries.t Canadian salaries expressed in U.S. dollars.41