Kemira Annual Report 2005
Kemira Annual Report 2005
Kemira Annual Report 2005

Create successful ePaper yourself
Turn your PDF publications into a flip-book with our unique Google optimized e-Paper software.
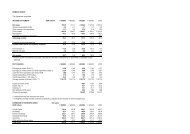
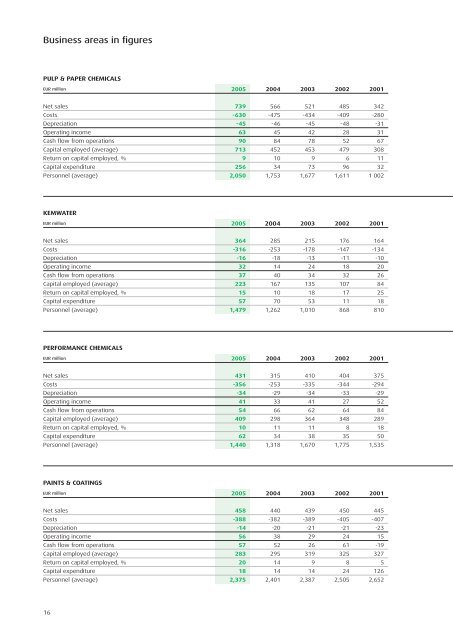
Business areas in figuresPULP & PAPER CHEMICALSEUR million <strong>2005</strong> 2004 2003 2002 2001Net sales 739 566 521 485 342Costs -630 -475 -434 -409 -280Depreciation -45 -46 -45 -48 -31Operating income 63 45 42 28 31Cash flow from operations 90 84 78 52 67Capital employed (average) 713 452 453 479 308Return on capital employed, % 9 10 9 6 11Capital expenditure 256 34 73 96 32Personnel (average) 2,050 1,753 1,677 1,611 1 002KEMWATEREUR million <strong>2005</strong> 2004 2003 2002 2001Net sales 364 285 215 176 164Costs -316 -253 -178 -147 -134Depreciation -16 -18 -13 -11 -10Operating income 32 14 24 18 20Cash flow from operations 37 40 34 32 26Capital employed (average) 223 167 135 107 84Return on capital employed, % 15 10 18 17 25Capital expenditure 57 70 53 11 18Personnel (average) 1,479 1,262 1,010 868 810PERFORMANCE CHEMICALSEUR million <strong>2005</strong> 2004 2003 2002 2001Net sales 431 315 410 404 375Costs -356 -253 -335 -344 -294Depreciation -34 -29 -34 -33 -29Operating income 41 33 41 27 52Cash flow from operations 54 66 62 64 84Capital employed (average) 409 298 364 348 289Return on capital employed, % 10 11 11 8 18Capital expenditure 62 34 38 35 50Personnel (average) 1,440 1,318 1,670 1,775 1,535PAINTS & COATINGSEUR million <strong>2005</strong> 2004 2003 2002 2001Net sales 458 440 439 450 445Costs -388 -382 -389 -405 -407Depreciation -14 -20 -21 -21 -23Operating income 56 38 29 24 15Cash flow from operations 57 52 26 61 -19Capital employed (average) 283 295 319 325 327Return on capital employed, % 20 14 9 8 5Capital expenditure 18 14 14 24 126Personnel (average) 2,375 2,401 2,387 2,505 2,65216