Kemira Annual Report 2005
Kemira Annual Report 2005
Kemira Annual Report 2005

You also want an ePaper? Increase the reach of your titles
YUMPU automatically turns print PDFs into web optimized ePapers that Google loves.
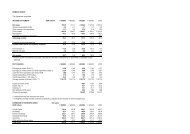
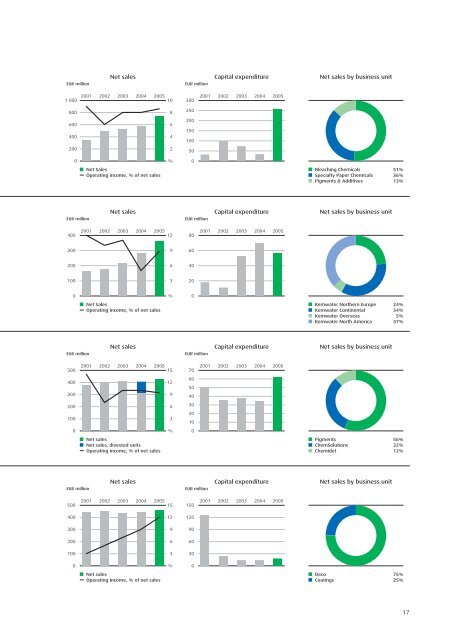
EUR millionNet salesEUR millionCapital expenditureNet sales by business unit2001 2002 2003 2004 <strong>2005</strong>1 000 10800 8600 6400 4200 2300250200150100502001 2002 2003 2004 <strong>2005</strong>0 %Net SalesOperating income, % of net sales0Bleaching Chemicals 51%Specialty Paper Chemicals 36%Pigments & Additives 13%EUR millionNet salesEUR millionCapital expenditureNet sales by business unit2001 2002 2003 2004 <strong>2005</strong>400 12802001 2002 2003 2004 <strong>2005</strong>300 960200 640100 3200 %Net SalesOperating income, % of net sales0Kemwater Northern Europe 24%Kemwater Continental 34%Kemwater Overseas 5%Kemwater North America 37%EUR millionNet salesEUR millionCapital expenditureNet sales by business unit2001 2002 2003 2004 <strong>2005</strong>500 15702001 2002 2003 2004 <strong>2005</strong>400 12300 9605040200 6100 33020100 %0Net salesNet sales, divested unitsOperating income, % of net salesPigments 56%ChemSolutions 32%Chemidet 12%EUR millionNet salesEUR millionCapital expenditureNet sales by business unit2001 2002 2003 2004 <strong>2005</strong>500 15400 12300 9200 6100 31501209060302001 2002 2003 2004 <strong>2005</strong>0 %Net salesOperating income, % of net sales0Deco 75%Coatings 25%17