Annual Report 2009-10 - United Breweries Limited
Annual Report 2009-10 - United Breweries Limited
Annual Report 2009-10 - United Breweries Limited

You also want an ePaper? Increase the reach of your titles
YUMPU automatically turns print PDFs into web optimized ePapers that Google loves.
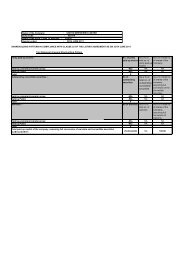
Notes on Accounts for the year ended March 31, 20<strong>10</strong> (contd.)B. (i) Transactions with related parties during the year:Rs. in ThousandsParticulars MBIL MAPL UMBL EMPEE UEBFTPL KMP MML20<strong>10</strong> <strong>2009</strong> 20<strong>10</strong> <strong>2009</strong> 20<strong>10</strong> <strong>2009</strong> 20<strong>10</strong> <strong>2009</strong> 20<strong>10</strong> <strong>2009</strong> 20<strong>10</strong> <strong>2009</strong> 20<strong>10</strong> <strong>2009</strong>Purchase of goods 2,131,421 2,374,835 — — 7,489 4,304 31,004 6,061 — — — — — —Sale of goods186,164 187,471 — — 94,181 86,994 82,898 76,336 — — — — — —[including sales taxes/ VAT]Receipts/(Payments) 45,363 30,671 — — 32,975 32,897 1,690 — — — — — — —against renderingServicesBrand Fees paid 25,398 18,021 — — — — — — — — — — — —Technical, Advisory— <strong>10</strong>0,000 — — 40,000 40,000 160,000 <strong>10</strong>0,000 — — — — — —and Management FeeSponsorship and other — — — — — — — — 52,042 56,767 — — — —paymentsGuarantee8,022 8,000 — — 6,000 6,000 7,300 7,300 — — — — — —Commission receivedPurchase of Assets 135 5,397 — — 15,249 2,386 — 26 — — — — — —Sale of Assets /Spares 71 — — — 12,239 5,264 — 225 — — — — — —Lease Rentals on3,223 2,798 — — — — — — — — — — 5,682 5,901MachineryInterest Paid — — — — — — — — — — — — 1,720 2,021Recovery of18,259 18,690 — — 5,536 6,253 9,175 7,884 — — — — — —employees Salaries (ondeputation)Payments2,320,534 2,602,249 19,130 15,315 116,033 19,649 (233,701) (211,572) 52,034 50,248 — — 8,841 8,499(For Supplies includingloan in cash or kind)Remuneration to— — — — — — — — — — 41,035 34,354 — —Directors*Guarantees andCollateralsRefer Schedule 19 Note <strong>10</strong>(i)Amount Due From/(To) 1,163,240 745,006 65,469 46,339 731,685 447,458 <strong>10</strong>2,358 <strong>10</strong>6,001 (26) (18) — — (<strong>10</strong>,697) (12,136)* Kalyan Ganguly: Rs.34,266 (<strong>2009</strong>: Rs.34,354)[Including payment to relative of KMP and a firm in which such relative is a partner – Rs.Nil (<strong>2009</strong>: Rs.2,883)]Guido de Boer: Rs.6,769 (<strong>2009</strong>: Rs.Nil)Figures in bracket indicate amounts received(ii) Transactions with Subsidiaries:Balance due from ABDL – Rs.83,865 (<strong>2009</strong>: Rs.83,791)C. Transactions with S & N Group1. Transaction with S & NManagement Fees2. Transactions with SNUKInterest on ECBPurchase of Raw Material3. Transactions with SNILBalance of Preference Share CapitalDividend on aboveInterim Dividend on Equity SharesFinal Dividend on Equity Shares13. Earnings per Share:Rs. 45,000 (<strong>2009</strong>: Rs.Nil)Rs. Nil (<strong>2009</strong>: Rs.17,852)Rs. 123 (<strong>2009</strong>: Rs.186)Rs. 2,469,000 (<strong>2009</strong>: Rs.2,469,000)Rs. 74,070 (<strong>2009</strong>: Rs.74,070)Rs. Nil (<strong>2009</strong>: Rs.13,499)Rs. 13,499 (<strong>2009</strong>: Rs.Nil)Particulars 20<strong>10</strong> <strong>2009</strong>a) Profit after taxation as per profit and loss account 969,709 624,940b) Less: Preference Dividend (including dividend distribution tax thereon) 86,658 86,658c) Net Profit attributable to equity shareholders 883,051 538,282d) Weighted average number of equity shares outstanding240,048,255 234,589,624(Face value of Re.1 per share)e) Earnings per share (Basic /Diluted) 3.68 2.2947