Annual Report 2009-10 - United Breweries Limited
Annual Report 2009-10 - United Breweries Limited
Annual Report 2009-10 - United Breweries Limited

You also want an ePaper? Increase the reach of your titles
YUMPU automatically turns print PDFs into web optimized ePapers that Google loves.
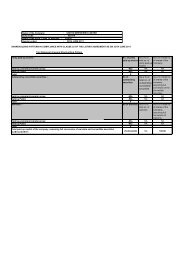
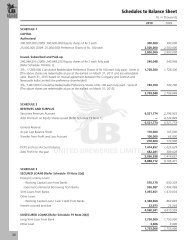
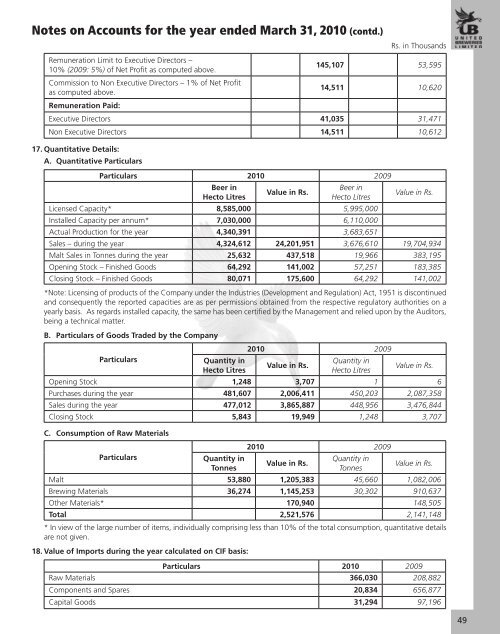
Notes on Accounts for the year ended March 31, 20<strong>10</strong> (contd.)Rs. in ThousandsRemuneration Limit to Executive Directors –<strong>10</strong>% (<strong>2009</strong>: 5%) of Net Profit as computed above.Commission to Non Executive Directors – 1% of Net Profitas computed above.145,<strong>10</strong>7 53,59514,511 <strong>10</strong>,620Remuneration Paid:Executive Directors 41,035 31,471Non Executive Directors 14,511 <strong>10</strong>,61217. Quantitative Details:A. Quantitative ParticularsParticulars 20<strong>10</strong> <strong>2009</strong>Beer inHecto LitresValue in Rs.Beer inHecto LitresValue in Rs.Licensed Capacity* 8,585,000 5,995,000Installed Capacity per annum* 7,030,000 6,1<strong>10</strong>,000Actual Production for the year 4,340,391 3,683,651Sales – during the year 4,324,612 24,201,951 3,676,6<strong>10</strong> 19,704,934Malt Sales in Tonnes during the year 25,632 437,518 19,966 383,195Opening Stock – Finished Goods 64,292 141,002 57,251 183,385Closing Stock – Finished Goods 80,071 175,600 64,292 141,002*Note: Licensing of products of the Company under the Industries (Development and Regulation) Act, 1951 is discontinuedand consequently the reported capacities are as per permissions obtained from the respective regulatory authorities on ayearly basis. As regards installed capacity, the same has been certified by the Management and relied upon by the Auditors,being a technical matter.B. Particulars of Goods Traded by the CompanyParticularsQuantity inHecto Litres20<strong>10</strong> <strong>2009</strong>Value in Rs.Quantity inHecto LitresValue in Rs.Opening Stock 1,248 3,707 1 6Purchases during the year 481,607 2,006,411 450,203 2,087,358Sales during the year 477,012 3,865,887 448,956 3,476,844Closing Stock 5,843 19,949 1,248 3,707C. Consumption of Raw Materials20<strong>10</strong> <strong>2009</strong>ParticularsQuantity inQuantity inValue in Rs.TonnesTonnesValue in Rs.Malt 53,880 1,205,383 45,660 1,082,006Brewing Materials 36,274 1,145,253 30,302 9<strong>10</strong>,637Other Materials* 170,940 148,505Total 2,521,576 2,141,148* In view of the large number of items, individually comprising less than <strong>10</strong>% of the total consumption, quantitative detailsare not given.18. Value of Imports during the year calculated on CIF basis:Particulars 20<strong>10</strong> <strong>2009</strong>Raw Materials 366,030 208,882Components and Spares 20,834 656,877Capital Goods 31,294 97,19649