Annual Report 2009-10 - United Breweries Limited
Annual Report 2009-10 - United Breweries Limited
Annual Report 2009-10 - United Breweries Limited
You also want an ePaper? Increase the reach of your titles
YUMPU automatically turns print PDFs into web optimized ePapers that Google loves.
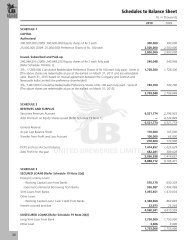
Notes on Consolidated Accounts for the year ended March 31, 20<strong>10</strong> (contd.)Rs. in Thousands16. Segmental <strong>Report</strong>ing:The Group is engaged in manufacture, purchase and sale of beer including licensing of brands which constitutes a singlebusiness segment. The Group operates only in India. Accordingly, primary and secondary reporting disclosures for businessand geographical segment as envisaged in AS-17 are not applicable to the Group.17. (i) Disclosures envisaged in AS 15 in respect of gratuity are given below:Particulars 20<strong>10</strong> <strong>2009</strong> 2008A) Reconciliation of opening and closing balances of thepresent value of the defined benefit obligationObligations at the beginning of the year 157,316 144,890 118,048Add: Transitional Obligation — — <strong>10</strong>1Add: Current Service cost 9,902 14,268 43,745Add: Interest cost 11,985 9,691 9,349Add: Actuarial (gains)/ losses (500) (696) (333)(Less): Benefits paid during the year (12,646) (<strong>10</strong>,837) (26,020)Obligations at the end of the year 166,057 157,316 144,890B) Reconciliation of opening and closing balances of the fairvalue of plan assetsFair Value of Plan assets at the beginning of the year 135,218 138,650 117,753Add: Expected Return on Plan Assets <strong>10</strong>,337 <strong>10</strong>,824 9,425Add: Actuarial Gain (1,490) (7,776) <strong>10</strong>,738Add: Contributions 25,501 4,683 26,754(Less): Benefits Paid (12,646) (11,163) (26,020)Fair Value of Plan assets at the end of the year 156,920 135,218 138,650C) Reconciliation of present value of defined benefitobligation and the fair value of plan assets to the assetsand liabilities recognised in the balance sheet:Present Value of Obligation as at March 31, 20<strong>10</strong> 166,057 157,316 144,890(Less): Fair Value of Plan Assets as at March 31, 20<strong>10</strong> 156,920 135,218 138,650Amount recognised in the Balance Sheet 9,137 22,098 6,240D) Expenses recognised in Profit and Loss account under“Employee Cost” in Schedule 15Current service cost 9,902 14,268 43,745Add: Interest cost 11,985 9,691 9,349(Less): Expected Return on Plan Assets (<strong>10</strong>,337) (<strong>10</strong>,824) (9,425)Prior period adjustment — — (23,739)Add: Actuarial (gains) / losses 990 6,493 6,256Net Gratuity Cost 12,540 19,628 26,186E) Investment details of plan assetsPlan assets are invested in Government Securities, Private Sector Bonds, Managed Funds and others.Based on the above allocation and the prevailing yields on these assets, the long term estimate of the expected rateof return on fund assets has been arrived at. Assumed rate of return on assets is expected to vary from year to yearreflecting the return.F) Actual return on plan assets 12,760 7,269 24,077G) AssumptionsDiscount rate per annum 8.00% 7.00% 8.00%Interest rate per annum 8.00% 7.00% 8.00%Expected return on plan assets 8.00% 7.00 to 8.00% 8.00%Expected salary increase per annum 5.00 to 6.00% 5.00 to 6.00 % 5.00%Attrition Rate 1.00% 1.00% 1.00%Retirement Age 58 58 58Mortality rate - LIC (94-96) Ultimate Mortality TableThe estimates of future increase in salary, considered in the actuarial valuation, have been taken on account of inflation,seniority, promotion and other relevant factors such as supply and demand in the employment market.76


