Justice Studies - Department of Chemistry - San Jose State University
Justice Studies - Department of Chemistry - San Jose State University
Justice Studies - Department of Chemistry - San Jose State University
Create successful ePaper yourself
Turn your PDF publications into a flip-book with our unique Google optimized e-Paper software.
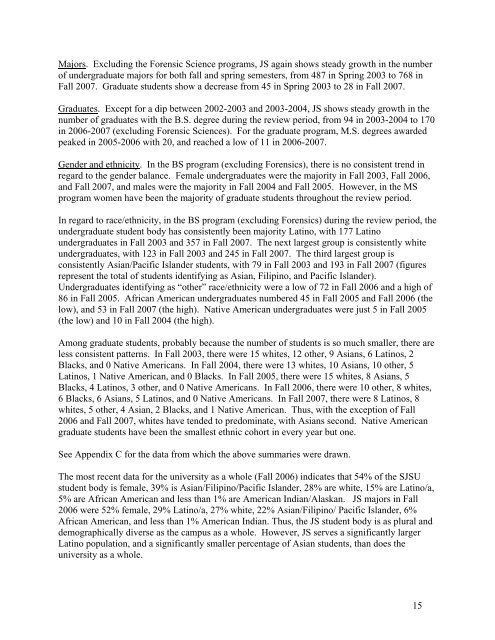
Majors. Excluding the Forensic Science programs, JS again shows steady growth in the number<strong>of</strong> undergraduate majors for both fall and spring semesters, from 487 in Spring 2003 to 768 inFall 2007. Graduate students show a decrease from 45 in Spring 2003 to 28 in Fall 2007.Graduates. Except for a dip between 2002-2003 and 2003-2004, JS shows steady growth in thenumber <strong>of</strong> graduates with the B.S. degree during the review period, from 94 in 2003-2004 to 170in 2006-2007 (excluding Forensic Sciences). For the graduate program, M.S. degrees awardedpeaked in 2005-2006 with 20, and reached a low <strong>of</strong> 11 in 2006-2007.Gender and ethnicity. In the BS program (excluding Forensics), there is no consistent trend inregard to the gender balance. Female undergraduates were the majority in Fall 2003, Fall 2006,and Fall 2007, and males were the majority in Fall 2004 and Fall 2005. However, in the MSprogram women have been the majority <strong>of</strong> graduate students throughout the review period.In regard to race/ethnicity, in the BS program (excluding Forensics) during the review period, theundergraduate student body has consistently been majority Latino, with 177 Latinoundergraduates in Fall 2003 and 357 in Fall 2007. The next largest group is consistently whiteundergraduates, with 123 in Fall 2003 and 245 in Fall 2007. The third largest group isconsistently Asian/Pacific Islander students, with 79 in Fall 2003 and 193 in Fall 2007 (figuresrepresent the total <strong>of</strong> students identifying as Asian, Filipino, and Pacific Islander).Undergraduates identifying as “other” race/ethnicity were a low <strong>of</strong> 72 in Fall 2006 and a high <strong>of</strong>86 in Fall 2005. African American undergraduates numbered 45 in Fall 2005 and Fall 2006 (thelow), and 53 in Fall 2007 (the high). Native American undergraduates were just 5 in Fall 2005(the low) and 10 in Fall 2004 (the high).Among graduate students, probably because the number <strong>of</strong> students is so much smaller, there areless consistent patterns. In Fall 2003, there were 15 whites, 12 other, 9 Asians, 6 Latinos, 2Blacks, and 0 Native Americans. In Fall 2004, there were 13 whites, 10 Asians, 10 other, 5Latinos, 1 Native American, and 0 Blacks. In Fall 2005, there were 15 whites, 8 Asians, 5Blacks, 4 Latinos, 3 other, and 0 Native Americans. In Fall 2006, there were 10 other, 8 whites,6 Blacks, 6 Asians, 5 Latinos, and 0 Native Americans. In Fall 2007, there were 8 Latinos, 8whites, 5 other, 4 Asian, 2 Blacks, and 1 Native American. Thus, with the exception <strong>of</strong> Fall2006 and Fall 2007, whites have tended to predominate, with Asians second. Native Americangraduate students have been the smallest ethnic cohort in every year but one.See Appendix C for the data from which the above summaries were drawn.The most recent data for the university as a whole (Fall 2006) indicates that 54% <strong>of</strong> the SJSUstudent body is female, 39% is Asian/Filipino/Pacific Islander, 28% are white, 15% are Latino/a,5% are African American and less than 1% are American Indian/Alaskan. JS majors in Fall2006 were 52% female, 29% Latino/a, 27% white, 22% Asian/Filipino/ Pacific Islander, 6%African American, and less than 1% American Indian. Thus, the JS student body is as plural anddemographically diverse as the campus as a whole. However, JS serves a significantly largerLatino population, and a significantly smaller percentage <strong>of</strong> Asian students, than does theuniversity as a whole.15


