

The Economist - 19_25 April 2014
The Economist - 19_25 April 2014
The Economist - 19_25 April 2014
- No tags were found...

You also want an ePaper? Increase the reach of your titles
YUMPU automatically turns print PDFs into web optimized ePapers that Google loves.
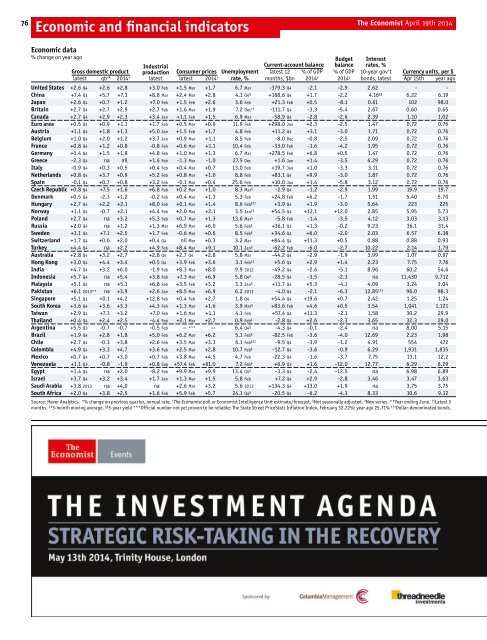
76 <strong>The</strong> <strong>Economist</strong> <strong>April</strong> <strong>19</strong>th <strong>2014</strong>Economic and financial indicatorsEconomic data% change on year ago Budget InterestIndustrial Current-account balance balance rates, %Gross domestic product production Consumer prices Unemployment latest 12 % of GDP % of GDP 10-year gov't Currency units, per $latest qtr* <strong>2014</strong> † latest latest <strong>2014</strong> † rate, % months, $bn <strong>2014</strong> † <strong>2014</strong> † bonds, latest Apr 15th year agoUnited States +2.6 Q4 +2.6 +2.8 +3.0 Feb +1.5 Mar +1.7 6.7 Mar -379.3 Q4 -2.1 -2.9 2.62 - -China +7.4 Q1 +5.7 +7.3 +8.8 Mar +2.4 Mar +2.8 4.1 Q4 § +188.6 Q4 +1.7 -2.2 4.16 §§ 6.22 6.<strong>19</strong>Japan +2.6 Q4 +0.7 +1.2 +7.0 Feb +1.5 Feb +2.6 3.6 Feb +21.3 Feb +0.5 -8.1 0.61 102 98.0Britain +2.7 EconomicQ4 +2.7 data +2.9 +2.7 Feb +1.6 Mar +1.9 7.2 Dec †† -111.7 Q4 -3.3 -5.4 2.67 0.60 0.65Canada +2.7 Q4 +2.9 +2.3 +3.4 Jan +1.1 Feb +1.5 6.9 Mar -58.9 Q4 -2.8 -2.6 2.39 1.10 1.02Euro area +0.5 Q4 +0.9 +1.1 +1.7 Feb +0.5 Mar +0.9 11.9 Feb +298.0 Jan +2.3 -2.5 1.47 0.72 0.76Austria +1.1 Q4 +1.8 +1.3 +5.0 Jan +1.5 Feb +1.7 4.8 Feb +11.2 Q4 +3.1 -3.0 1.71 0.72 0.76Belgium +1.0 Statistics Q4 +2.0 on +1.2 42 economies, +3.7 Jan plus +0.9 Mar a closer +1.1 8.5 Feb -8.0 Dec -0.8 -2.5 2.09 0.72 0.76France +0.8 look Q4 at taxing +1.2 +0.8 wages -0.8 Feb +0.6 Mar +1.1 10.4 Feb -33.0 Feb -1.6 -4.2 1.95 0.72 0.76Germany +1.4 Q4 +1.5 +1.8 +4.8 Feb +1.0 Mar +1.3 6.7 Mar +278.5 Feb +6.8 +0.5 1.47 0.72 0.76Greece -2.3 Q4 na nil +1.6 Feb -1.3 Mar -1.0 27.5 Dec +1.6 Jan +1.4 -3.5 6.29 0.72 0.76Italy -0.9 Q4 +0.3 +0.5 +0.4 Feb +0.4 Mar +0.7 13.0 Feb +<strong>19</strong>.7 Jan +1.0 -3.3 3.11 0.72 0.76Netherlands +0.8 Q4 +3.7 +0.9 +5.2 Feb +0.8 Mar +1.0 8.8 Feb +83.1 Q4 +9.9 -3.0 1.87 0.72 0.76Spain -0.1 Q4 +0.7 +0.8 +3.2 Feb -0.1 Mar +0.4 <strong>25</strong>.6 Feb +10.0 Jan +1.4 -5.8 3.12 0.72 0.76Czech Republic +0.8 Q4 +7.5 +1.6 +6.8 Feb +0.2 Mar +1.0 8.3 Mar § -2.9 Q4 -1.2 -2.9 1.99 <strong>19</strong>.9 <strong>19</strong>.7Denmark +0.5 Q4 -2.3 +1.2 -0.2 Feb +0.4 Mar +1.3 5.3 Feb +24.8 Feb +6.2 -1.7 1.51 5.40 5.70Hungary +2.7 Q4 +2.2 +2.1 +8.0 Feb +0.1 Mar +1.4 8.6 Feb §†† +3.9 Q4 +1.9 -3.0 5.64 223 2<strong>25</strong>Norway +1.1 Q4 -0.7 +2.1 +4.4 Feb +2.0 Mar +2.1 3.5 Jan ‡‡ +54.5 Q4 +12.1 +12.0 2.85 5.95 5.73Poland +2.7 Q4 na +3.2 +5.3 Feb +0.7 Mar +1.3 13.6 Mar § -5.8 Feb -1.4 -3.5 4.12 3.03 3.13Russia +2.0 Q4 na +1.2 +1.3 Mar +6.9 Mar +6.0 5.6 Feb § +36.1 Q1 +1.3 -0.2 9.23 36.1 31.4Sweden +3.1 Q4 +7.1 +2.5 +1.7 Feb -0.6 Mar +0.6 8.5 Feb § +34.6 Q4 +6.0 -2.0 2.03 6.57 6.38Switzerland +1.7 Q4 +0.6 +2.0 +0.4 Q4 nil Mar +0.3 3.2 Mar +84.4 Q4 +11.3 +0.5 0.88 0.88 0.93Turkey +4.4 Q4 na +2.2 +4.9 Feb +8.4 Mar +9.1 10.1 Jan § -62.2 Feb -6.0 -2.7 10.22 2.14 1.79Australia +2.8 Q4 +3.2 +2.7 +2.8 Q4 +2.7 Q4 +2.8 5.8 Mar -44.2 Q4 -2.9 -1.9 3.99 1.07 0.97Hong Kong +3.0 Q4 +4.4 +3.4 +0.5 Q4 +3.9 Feb +3.6 3.1 Feb ‡‡ +5.6 Q4 +2.9 +1.4 2.23 7.75 7.76India +4.7 Q4 +3.2 +6.0 -1.9 Feb +8.3 Mar +8.0 9.9 2012 -49.2 Q4 -2.6 -5.1 8.96 60.2 54.6Indonesia +5.7 Q4 na +5.4 +3.8 Feb +7.3 Mar +6.9 5.8 Q4 § -28.5 Q4 -3.5 -2.3 na 11,430 9,712Malaysia +5.1 Q4 na +5.1 +6.8 Feb +3.5 Feb +3.2 3.3 Jan § +11.7 Q4 +5.3 -4.1 4.09 3.24 3.04Pakistan +6.1 2013** na +3.9 +2.6 Jan +8.5 Mar +6.9 6.2 2013 -4.0 Q4 -2.1 -6.3 12.85 ††† 96.0 98.3Singapore +5.1 Q1 +0.1 +4.2 +12.8 Feb +0.4 Feb +2.7 1.8 Q4 +54.4 Q4 +<strong>19</strong>.6 +0.7 2.42 1.<strong>25</strong> 1.24South Korea +3.6 Q4 +3.6 +3.3 +4.3 Feb +1.3 Mar +1.6 3.9 Mar § +83.6 Feb +4.6 +0.5 3.54 1,041 1,121Taiwan +2.9 Q4 +7.3 +3.2 +7.0 Feb +1.6 Mar +1.1 4.1 Feb +57.4 Q4 +11.3 -2.1 1.58 30.2 29.9Thailand +0.4 Q4 +2.4 +2.5 -4.4 Feb +2.1 Mar +2.7 0.9 Feb § -2.8 Q4 +2.6 -2.3 3.65 32.3 29.0Argentina +5.5 Q3 -0.7 -0.7 -0.5 Feb — *** — 6.4 Q4 § -4.3 Q4 -0.1 -2.4 na 8.00 5.15Brazil +1.9 Q4 +2.8 +1.8 +5.0 Feb +6.2 Mar +6.2 5.1 Feb § -82.5 Feb -3.6 -4.0 12.69 2.23 1.98Chile +2.7 Q4 -0.3 +3.8 +2.6 Feb +3.5 Mar +3.3 6.1 Feb §‡‡ -9.5 Q4 -3.9 -1.2 4.91 554 472Colombia +4.9 Q4 +3.3 +4.7 +3.6 Feb +2.5 Mar +2.8 10.7 Feb § -12.7 Q4 -3.6 -0.9 6.29 1,931 1,835Mexico +0.7 Q4 +0.7 +3.0 +0.7 Feb +3.8 Mar +4.5 4.7 Feb -22.3 Q4 -1.6 -3.7 7.75 13.1 12.2Venezuela +1.1 Q3 -0.8 -1.9 +0.8 Sep +57.4 Feb +61.0 7.2 Feb § +6.9 Q3 +1.6 -12.0 12.77 6.29 6.29Egypt +1.4 Q4 na +2.0 -8.2 Feb +9.9 Mar +9.9 13.4 Q4 § -3.3 Q4 -2.4 -12.5 na 6.98 6.89Israel +3.7 Q4 +3.2 +3.4 +1.7 Jan +1.3 Mar +1.5 5.8 Feb +7.2 Q4 +2.9 -2.8 3.46 3.47 3.63Saudi Arabia +3.8 2013 na +4.0 na +2.6 Mar +3.2 5.6 2013 +134.3 Q4 +13.0 +1.9 na 3.75 3.75South Africa +2.0 Q4 +3.8 +2.5 +1.6 Feb +5.9 Feb +5.7 24.1 Q4 § -20.5 Q4 -6.2 -4.3 8.33 10.6 9.12Source: Haver Analytics. *% change on previous quarter, annual rate. † <strong>The</strong> <strong>Economist</strong> poll or <strong>Economist</strong> Intelligence Unit estimate/forecast. § Not seasonally adjusted. ‡ New series. **Year ending June. †† Latest 3months. ‡‡ 3-month moving average. §§ 5-year yield ***Official number not yet proven to be reliable; <strong>The</strong> State Street PriceStats Inflation Index, February 32.22%; year ago <strong>25</strong>.71% ††† Dollar-denominated bonds.