The Economist - 19_25 April 2014
The Economist - 19_25 April 2014
The Economist - 19_25 April 2014
- No tags were found...
You also want an ePaper? Increase the reach of your titles
YUMPU automatically turns print PDFs into web optimized ePapers that Google loves.
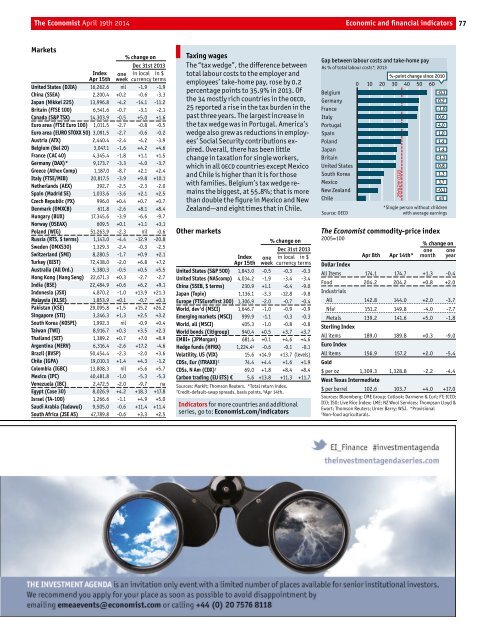
<strong>The</strong> <strong>Economist</strong> <strong>April</strong> <strong>19</strong>th <strong>2014</strong> Economic and financial indicators 77Markets% change onDec 31st 2013Index one in local in $Apr 15th week currency termsMarketsUnited States (DJIA) 16,262.6 nil -1.9 -1.9China (SSEA) 2,200.4 +0.2 -0.6 -3.3Japan (Nikkei 2<strong>25</strong>) 13,996.8 -4.2 -14.1 -11.2Britain (FTSE 100) 6,541.6 -0.7 -3.1 -2.1Canada (S&P TSX) 14,303.9 -0.5 +5.0 +1.6Euro area (FTSE Euro 100) 1,011.5 -2.7 -0.8 -0.5Euro area (EURO STOXX 50) 3,091.5 -2.7 -0.6 -0.2Austria (ATX) 2,440.4 -2.4 -4.2 -3.9Belgium (Bel 20) 3,047.1 -1.6 +4.2 +4.6France (CAC 40) 4,345.4 -1.8 +1.1 +1.5Germany (DAX)* 9,173.7 -3.3 -4.0 -3.7Greece (Athex Comp) 1,187.0 -8.7 +2.1 +2.4Italy (FTSE/MIB) 20,817.5 -3.9 +9.8 +10.1Netherlands (AEX) 392.7 -2.5 -2.3 -2.0Spain (Madrid SE) 1,033.6 -3.6 +2.1 +2.5Czech Republic (PX) 996.0 +0.4 +0.7 +0.7Denmark (OMXCB) 611.8 -2.6 +8.1 +8.4Hungary (BUX) 17,345.6 -3.9 -6.6 -9.7Norway (OSEAX) 609.5 +0.1 +1.1 +3.1Poland (WIG) 51,263.9 -2.3 nil -0.6Russia (RTS, $ terms) 1,143.0 -4.4 -12.9 -20.8Sweden (OMXS30) 1,329.3 -2.4 -0.3 -2.5Switzerland (SMI) 8,280.5 -1.7 +0.9 +2.1Turkey (BIST) 72,438.0 -2.0 +6.8 +7.2Australia (All Ord.) 5,380.3 -0.5 +0.5 +5.5Hong Kong (Hang Seng) 22,671.3 +0.3 -2.7 -2.7India (BSE) 22,484.9 +0.6 +6.2 +9.1Indonesia (JSX) 4,870.2 -1.0 +13.9 +21.3Malaysia (KLSE) 1,853.9 +0.1 -0.7 +0.3Pakistan (KSE) 29,095.8 +1.5 +15.2 +26.2Singapore (STI) 3,246.3 +1.3 +2.5 +3.2South Korea (KOSPI) 1,992.3 nil -0.9 +0.4Taiwan (TWI) 8,916.7 +0.3 +3.5 +2.3Thailand (SET) 1,389.2 +0.7 +7.0 +8.9Argentina (MERV) 6,316.4 -2.6 +17.2 -4.6Brazil (BVSP) 50,454.4 -2.3 -2.0 +3.6Chile (IGPA) <strong>19</strong>,010.3 +1.4 +4.3 -1.2Colombia (IGBC) 13,808.3 nil +5.6 +5.7Mexico (IPC) 40,481.8 -1.0 -5.3 -5.3Venezuela (IBC) 2,472.5 -2.0 -9.7 naEgypt (Case 30) 8,026.9 +4.2 +18.3 +17.8Israel (TA-100) 1,266.6 -1.1 +4.9 +5.0Saudi Arabia (Tadawul) 9,505.0 -0.6 +11.4 +11.4South Africa (JSE AS) 47,789.8 -0.6 +3.3 +2.5Taxing wages<strong>The</strong> “tax wedge”, the difference betweentotal labour costs to the employer andemployees’ take-home pay, rose by 0.2percentage points to 35.9% in 2013. Ofthe 34 mostly rich countries in the OECD,<strong>25</strong> reported a rise in the tax burden in thepast three years. <strong>The</strong> largest increase inthe tax wedge was in Portugal. America’swedge also grew as reductions in employees’Social Security contributions expired.Overall, there has been littlechange in taxation for single workers,which in all OECD countries except Mexicoand Chile is higher than it is for thosewith families. Belgium’s tax wedge remainsthe biggest, at 55.8%; that is morethan double the figure in Mexico and NewZealand—and eight times that in Chile.Other marketsOthermarkets% change onDec 31st 2013Index one in local in $Apr 15th week currency termsUnited States (S&P 500) 1,843.0 -0.5 -0.3 -0.3United States (NAScomp) 4,034.2 -1.9 -3.4 -3.4China (SSEB, $ terms) 230.9 +1.1 -6.4 -9.0Japan (Topix) 1,136.1 -3.3 -12.8 -9.8Europe (FTSEurofirst 300) 1,306.9 -2.0 -0.7 -0.4World, dev'd (MSCI) 1,646.7 -1.0 -0.9 -0.9Emerging markets (MSCI) 999.9 -1.1 -0.3 -0.3World, all (MSCI) 405.3 -1.0 -0.8 -0.8World bonds (Citigroup) 940.4 +0.5 +3.7 +3.7EMBI+ (JPMorgan) 681.4 +0.1 +4.6 +4.6Hedge funds (HFRX) 1,224.4 § -0.6 -0.1 -0.1Volatility, US (VIX) 15.6 +14.9 +13.7 (levels)CDSs, Eur (iTRAXX) † 74.4 +4.4 +1.6 +1.9CDSs, N Am (CDX) † 69.0 +1.8 +8.4 +8.4Carbon trading (EU ETS) € 5.6 +13.8 +11.3 +11.7Sources: Markit; Thomson Reuters. *Total return index.† Credit-default-swap spreads, basis points. § Apr 14th.Indicators for more countries and additionalseries, go to: <strong>Economist</strong>.com/indicatorsGap between labour costs and take-home payAs % of total labour costs*, 2013%-point change since 20100 10 20 30 40 50 60BelgiumGermanyFranceItalyPortugalSpainPolandJapanBritainUnited StatesSouth KoreaMexicoNew ZealandChile-0.10.2-1.00.64.01.01.41.4-1.10.81.33.7-0.1nilSource: OECDOECD AVERAGE*Single person without childrenwith average earnings<strong>The</strong> <strong>Economist</strong> commodity-price index2005=100% change on<strong>The</strong> <strong>Economist</strong> commodity-price one indexoneApr 8th Apr 14th* month yearDollar IndexAll Items 174.1 174.7 +1.3 -0.4Food 204.2 204.2 +0.8 +2.0IndustrialsAll 142.8 144.0 +2.0 -3.7Nfa † 151.2 149.8 -4.0 -7.7Metals 139.2 141.6 +5.0 -1.8Sterling IndexAll items 189.0 189.8 +0.3 -9.0Euro IndexAll items 156.9 157.2 +2.0 -5.4Gold$ per oz 1,309.3 1,328.8 -2.2 -4.4West Texas Intermediate$ per barrel 102.6 103.7 +4.0 +17.0Sources: Bloomberg; CME Group; Cotlook; Darmenn & Curl; FT; ICCO;ICO; ISO; Live Rice Index; LME; NZ Wool Services; Thompson Lloyd &Ewart; Thomson Reuters; Urner Barry; WSJ. *Provisional† Non-food agriculturals.


