
Create successful ePaper yourself
Turn your PDF publications into a flip-book with our unique Google optimized e-Paper software.
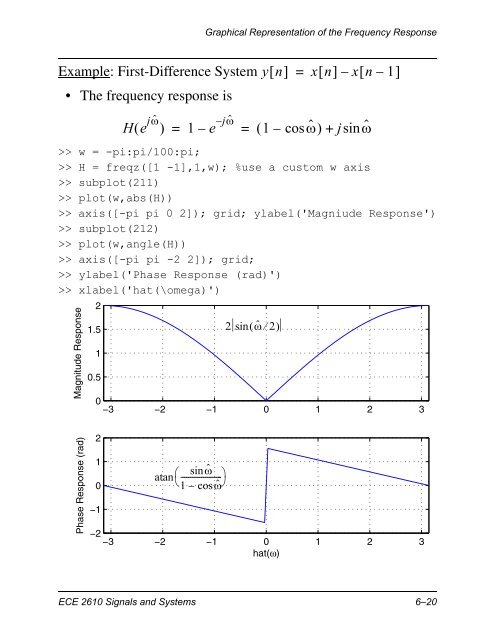
Graphical Representation <strong>of</strong> the <strong>Frequency</strong> <strong>Response</strong>Example: First-Difference System• The frequency response isHe jˆyn xn –xn – 1– = 1 – e jˆ= 1 – cosˆ+jsinˆ>> w = -pi:pi/100:pi;>> H = freqz([1 -1],1,w); %use a custom w axis>> subplot(211)>> plot(w,abs(H))>> axis([-pi pi 0 2]); grid; ylabel('Magniude <strong>Response</strong>')>> subplot(212)>> plot(w,angle(H))>> axis([-pi pi -2 2]); grid;>> ylabel('Phase <strong>Response</strong> (rad)')>> xlabel('hat(\omega)')2Magnitude <strong>Response</strong>1.510.52 sinˆ 20−3 −2 −1 0 1 2 3=Phase <strong>Response</strong> (rad)210−1atan sinˆ--------------------- 1 – cosˆ−2−3 −2 −1 0 1 2 3hat(ω)ECE 2610 Signals and Systems 6–20