
Create successful ePaper yourself
Turn your PDF publications into a flip-book with our unique Google optimized e-Paper software.
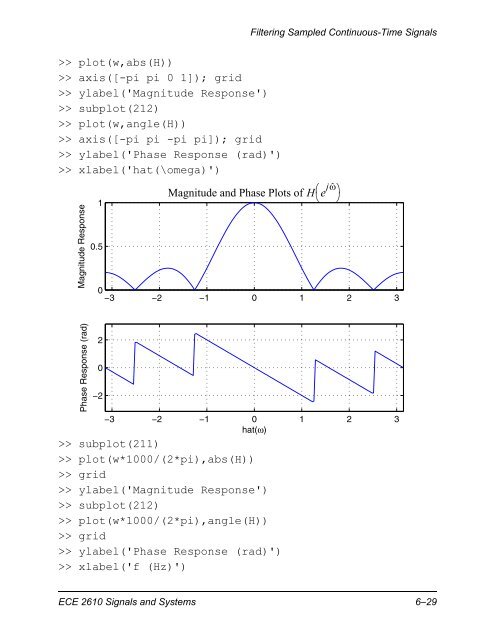
Filtering Sampled Continuous-Time Signals>> plot(w,abs(H))>> axis([-pi pi 0 1]); grid>> ylabel('Magnitude <strong>Response</strong>')>> subplot(212)>> plot(w,angle(H))>> axis([-pi pi -pi pi]); grid>> ylabel('Phase <strong>Response</strong> (rad)')>> xlabel('hat(\omega)')Magnitude <strong>Response</strong>10.5Magnitude and Phase Plots <strong>of</strong> He jˆ 0−3 −2 −1 0 1 2 3Phase <strong>Response</strong> (rad)20−2−3 −2 −1 0 1 2 3hat(ω)>> subplot(211)>> plot(w*1000/(2*pi),abs(H))>> grid>> ylabel('Magnitude <strong>Response</strong>')>> subplot(212)>> plot(w*1000/(2*pi),angle(H))>> grid>> ylabel('Phase <strong>Response</strong> (rad)')>> xlabel('f (Hz)')ECE 2610 Signals and Systems 6–29