
You also want an ePaper? Increase the reach of your titles
YUMPU automatically turns print PDFs into web optimized ePapers that Google loves.
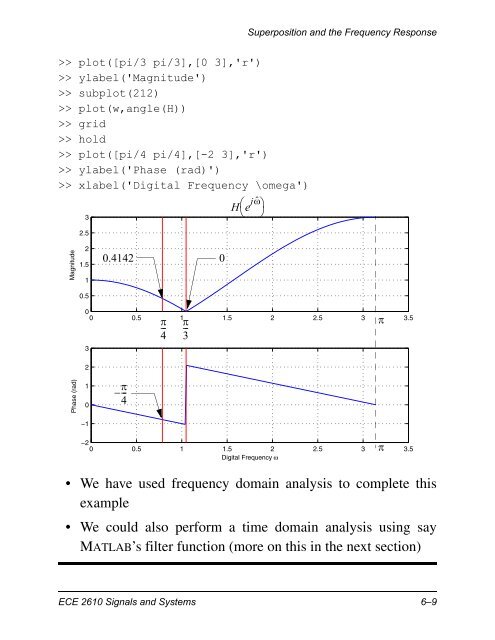
Superposition and the <strong>Frequency</strong> <strong>Response</strong>>> plot([pi/3 pi/3],[0 3],'r')>> ylabel('Magnitude')>> subplot(212)>> plot(w,angle(H))>> grid>> hold>> plot([pi/4 pi/4],[-2 3],'r')>> ylabel('Phase (rad)')>> xlabel('Digital <strong>Frequency</strong> \omega')He jˆ 32.5Magnitude21.510.4142 00.500 0.5 1 1.5 2 2.5 3 3.532--4--3Phase (rad)10−1–--4−20 0.5 1 1.5 2 2.5 3 3.5Digital <strong>Frequency</strong> ω• We have used frequency domain analysis to complete thisexample• We could also perform a time domain analysis using sayMATLAB’s filter function (more on this in the next section)ECE 2610 Signals and Systems 6–9