Create successful ePaper yourself
Turn your PDF publications into a flip-book with our unique Google optimized e-Paper software.
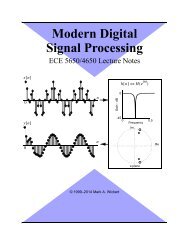
Moving Average FilteringPlotting the <strong>Frequency</strong> <strong>Response</strong>• The frequency response can be plotted most easily usingMATLAB’s freqz() function• Consider a 10-point moving average>> w = -pi:pi/500:pi;>> H = freqz(ones(1,10)/10,1,w);>> subplot(211)>> plot(w,abs(H))>> grid; axis([-pi pi 0 1])>> ylabel('Magnitude <strong>Response</strong>')>> subplot(212)>> plot(w,angle(H))>> grid; axis([-pi pi -pi pi])>> ylabel('Phase <strong>Response</strong> (rad)')>> xlabel('hat(\omega)')Magnitude <strong>Response</strong>10.5L = 100−3 −2 −1 0 1 2 3 2 4 3--5-----5ˆ=-----52-----L-----5Phase <strong>Response</strong> (rad)20−2–e j4.5 ˆon this segment−3 −2 −1 0 1 2 3hat(ω)ECE 2610 Signals and Systems 6–26