COMPREHENSIVE DEVELOPMENT PLAN - Puri District
COMPREHENSIVE DEVELOPMENT PLAN - Puri District
COMPREHENSIVE DEVELOPMENT PLAN - Puri District

You also want an ePaper? Increase the reach of your titles
YUMPU automatically turns print PDFs into web optimized ePapers that Google loves.
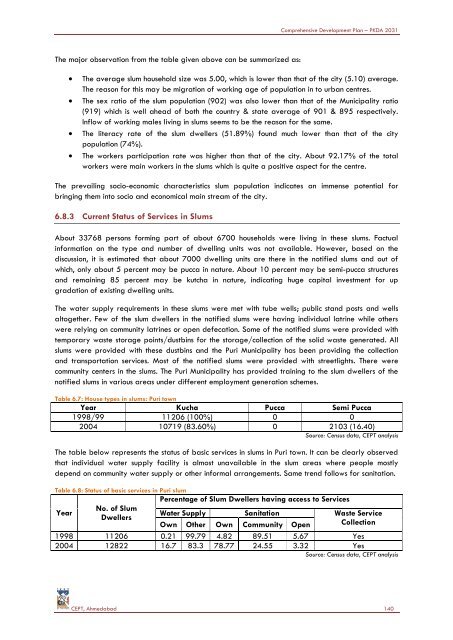
Comprehensive Development Plan – PKDA 2031The major observation from the table given above can be summarized as:The average slum household size was 5.00, which is lower than that of the city (5.10) average.The reason for this may be migration of working age of population in to urban centres.The sex ratio of the slum population (902) was also lower than that of the Municipality ratio(919) which is well ahead of both the country & state average of 901 & 895 respectively.Inflow of working males living in slums seems to be the reason for the same.The literacy rate of the slum dwellers (51.89%) found much lower than that of the citypopulation (74%).The workers participation rate was higher than that of the city. About 92.17% of the totalworkers were main workers in the slums which is quite a positive aspect for the centre.The prevailing socio-economic characteristics slum population indicates an immense potential forbringing them into socio and economical main stream of the city.6.8.3 Current Status of Services in SlumsAbout 33768 persons forming part of about 6700 households were living in these slums. Factualinformation on the type and number of dwelling units was not available. However, based on thediscussion, it is estimated that about 7000 dwelling units are there in the notified slums and out ofwhich, only about 5 percent may be pucca in nature. About 10 percent may be semi-pucca structuresand remaining 85 percent may be kutcha in nature, indicating huge capital investment for upgradation of existing dwelling units.The water supply requirements in these slums were met with tube wells; public stand posts and wellsaltogether. Few of the slum dwellers in the notified slums were having individual latrine while otherswere relying on community latrines or open defecation. Some of the notified slums were provided withtemporary waste storage points/dustbins for the storage/collection of the solid waste generated. Allslums were provided with these dustbins and the <strong>Puri</strong> Municipality has been providing the collectionand transportation services. Most of the notified slums were provided with streetlights. There werecommunity centers in the slums. The <strong>Puri</strong> Municipality has provided training to the slum dwellers of thenotified slums in various areas under different employment generation schemes.Table 6.7: House types in slums: <strong>Puri</strong> townYear Kucha Pucca Semi Pucca1998/99 11206 (100%) 0 02004 10719 (83.60%) 0 2103 (16.40)Source: Census data, CEPT analysisThe table below represents the status of basic services in slums in <strong>Puri</strong> town. It can be clearly observedthat individual water supply facility is almost unavailable in the slum areas where people mostlydepend on community water supply or other informal arrangements. Same trend follows for sanitation.Table 6.8: Status of basic services in <strong>Puri</strong> slumYearNo. of SlumDwellersPercentage of Slum Dwellers having access to ServicesWater Supply Sanitation Waste ServiceCollectionOwn Other Own Community Open1998 11206 0.21 99.79 4.82 89.51 5.67 Yes2004 12822 16.7 83.3 78.77 24.55 3.32 YesSource: Census data, CEPT analysisCEPT, Ahmedabad 140