antenna analysis report - VIR History
antenna analysis report - VIR History
antenna analysis report - VIR History
- No tags were found...

You also want an ePaper? Increase the reach of your titles
YUMPU automatically turns print PDFs into web optimized ePapers that Google loves.
BEST AVAILABLE COPYNRL Memorandum Report 2475Radiation Parameters of the VLF TransmittingStation NPM, Lualualei, HawaiiE. E. BARR-AND J. E. RAUDENBUSHElectromagnetic Propagation BranchCommunications Sciences DivisionLD DC\Li mn~August 1972 SEP 13 1972R byNATIONAL TECHNICAL \,.INFORMATION SERVICEU S DooIn.nt f Cm. ',cSpi1gf;,1ld VA 2V' !51NAVAL RESEARCHWm.mgtaaWLABORATORYD.C.Approved for public release: distribution unfimited.
j~USTAVA1MLABLCOPySUNCLASSIFED,, Sl Cl ,asofo.bt.n bud,,vnd .n..'. l.....o.l... , . ......DOCUMENT CONTROL DATA - R & D(Security classification of title. body of ab~trart and indexing annotstion muist be Iteseed when the overall export Is claisilled)1.ONrINATING AC TiVI TY (Corporate .auhor) 2.EO Tý UIYCASFCTONaval Research Laboratory.Washington, D.C. 20390oUNCLASSIFIED3. REsPORT TITLERADIATION PARAMETERS OF THE VLF TRANSMITTING STATION NPM, LUALUALEI,HAWAII.A. DESCRIPTIVE NOTES (Ty•pe Of -'p
BEST AVAILABLE'COPYUNCLASSIFIEDSecurity Classification14 LtINK A LINK 9 LINK CKEY wo NOSRoL.I WT ROLIf WT ROLE WTIVery low frequency (VLF)VLF transmitting stationsRadiation parameters7LiDD IS 1o 473 (BC)UNCLASSIFIED(PAGE- 2)Security Classification
BEST AVAILABLE COPYUNCLASSIFIEDCONTENTSABSTRACTPROBLEM STATUSiiAUTHORIZATIONINTRODUCTION 1MFASUREMENT CONCEPTS AND TECHNIQUES 2General 2Field Strength Measurements 3Distance Measurements 5Antenna Current Measurements 5Corona Measurements 6FIELD STRENGTH MEASUREMENT SITES 7DATA PROCESSING 8R T 'SULTS AND DISCUSSIONS 9Dual Array Operation 10East Array Operation 11West Array Operation 11Corona Tests 12ACKNO)WLEDGEmeNTS 13týEFERENCES 14iiSi C-UNCLASSIFIED/" *
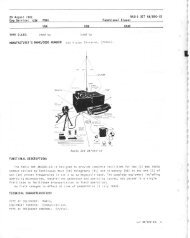
BEST AVAILAB LE COPYUNCLASS IFEDABSTRACTIn November and December 1971, personnel from the Naval ResearchLaboratory experimentally determined the radiation parameters for thevery-low-frequency (VLF) <strong>antenna</strong> system at the U. S. Naval TransmittingFacility, Lualualei, Hawaii. This work was performed as part of theProof of Performance evaluation for the new transmitting <strong>antenna</strong> systemand modified matching network.The radiation parameters were determined at five test frequencies;14.7, 16.6, 19.8, 23.4, and 28.5 kHz, with the transmitting <strong>antenna</strong>operating in a dual or parallel east and west array configuration andin a single east array. The parameters were also determined for the<strong>antenna</strong> system operating in a single west array configuration for fourfrequencies; 16.6, 19.8, 23.4, and 28.5 kHz.A test to determine the possible onset of corona losses was performedwith the dual array operating at 14.7 kHz, 23.4 kHz, and 28.5kHz test frequencies.The values for the radiation parameters as well as the results ofthe corona tests are <strong>report</strong>ed and discussed herein, along with a detaileddescription of the experimental techniques and data reductionprocess.PROBLEM STATUSThis is a final <strong>report</strong> of one phase of this problem.AUTHOIZATIONNRL Problem R07-22NAVAL ELECTRONICS SYSTEMS COMMANDiiUNCIASS IFIEIY. - - I...
UNCIASSIFIEDbES1 AVAILABLE COPYRADIATION PARAMETERS OF THE VLF TRANSMITTINGSTATION N-h•, LUALUALEI, HAWAII1.0 INTRODUCTIONA very-low-frequency (VLF) transmitting <strong>antenna</strong> has been constructedfor the U. S. Navy at the Naval Transmitting Facility (call letters NP4),Lualualei, Hawaii. As a part of the Proof of Performance evaluation ofthe new <strong>antenna</strong>, personnel from the Naval Research laboratory (IRL) determinedthe <strong>antenna</strong> system radiation parameters including radiatedpower, radiation resistance, and effective height, in November and December1971. In addition the <strong>antenna</strong> system was tested for possible coronaconditions. The N!.1 <strong>antenna</strong> basically consists of two, single, top-loadedvertical elements fed in parallel from a common junction point by twofeedl.nes*, which differ appreciably in physical length. The differencein ph,-sical lengths of the two feedlines are required because the twotowers are not symetrically located about the transmitter building andhelix house. The longer feedline which feeds the far tower (east <strong>antenna</strong>array) is connected to the tower at the fourth guy level and alsois electrically jumpered horizontally to two adjacent tophat radials.The short feedline is connected to the near tower (west <strong>antenna</strong> array)at a single point corresponding to the second guy level. The normaloperating <strong>antenna</strong> configuration is with both the east and west arraysdriven in parallel, but for emergency operation a single tower can bedriven (either east or west array) with the unused tower grounded. Theradiation parameters were measured at five operating frequencies (14.7,16.6, 19.8, 23.4, and 28.5 kHz) with the <strong>antenna</strong> in its nor.nal dual modeand also for the east array only. For the single west array configurationno test transmissions were made at the 14.7 kHz test frequency becausethe <strong>antenna</strong> matching network could not provide enough inductanceto tune the <strong>antenna</strong> at this frequency. A test was performed on the dualarray to determine the possible onset of corona losses while operatingat the 14.7 kHz, 23.4 kHz, and 28.5 kHz test frequencies.*These conductors might also be referred to as downleads, however becauseof the manner in which they are connected to the insulated verticaltowers, the term feedlines seems to be more appropriate.1 UNCIASSIFIED
4U$T AVAILABLE COPYUNCS S IFTED2.0 MEASUREMENT CONCEPTS AND TECHNIQUES2.1 GeneralVLF <strong>antenna</strong>s are, in general, electrically very short; that is,their physical dimensions compared to a wavelength are very small. TheVLF transnLitting <strong>antenna</strong> for NI4, Lualualei, is such an <strong>antenna</strong>, employing,in effect, two single vertical elements each wi-th umbrella-type toploading, and fed in parallel from a common junction point by two feedlines.Only the vertical electric component of energy radiated fromsuch a VLF <strong>antenna</strong> system contributes appreciably to the energy receivedin the far field. The top loading acts to increase the effective currentdistribution in the vertical conductor thereby increasing the radiatedfield.The effective height of a transmitting <strong>antenna</strong> is a measure of itseffectiveness as a radiator of electromagnetic energy. The radiationresistance of a transmitting <strong>antenna</strong> system is a fictitious quantity butit can be expressed as the resistance that, when inserted in series withthe <strong>antenna</strong> will consume the same amount of power as is actually radiated.The radiation resistance, R , is used in determining the power,- r• radiated by the transmitting Etation from the relationP 12 R (2-1)Rr a rwhere, I ais the transmitting <strong>antenna</strong> current.For an <strong>antenna</strong> system such as that at Nl4, neither the effectiveheight nor the radiation resistance can be measured directly, or theoreticallycalculated from a practical model to a sufficient degree ofaccuracy. Both of these parameters can be calculated if the radiatedpower and corresponding <strong>antenna</strong> current of the transmitting system areknown. The radiated power can be determined from measurements of thefield strength existing at a known distance from the transmitting <strong>antenna</strong>.For the greatest accuracy, these field strength measurements should bemade in the region where the field strength, E, is proportional to theinverse of the distance, d, from the transmitting <strong>antenna</strong>. Since thefield strength measurements, even in this region are affected by localconditions such as abrupt changes in ground conductivity and more so bytransmission lines, fences, etc., a large number of measurements mustbe made at many distances and bearings from the transmitting <strong>antenna</strong> toinsure a high degree of overall accuracy2 UNCLASSIFIED
UNCIASS IFIEDBEST AVAOUALE COPYThe radiation resistance, R in ohms, can be determined from. therelationrRd d2 E2r -12 (2-2)awhere, d is the distance from the transmitting <strong>antenna</strong> in kilometers,E is the field strength in millivolts per meter, and I a is the <strong>antenna</strong>current in amperes. Using the same units and the frequency, f in kilohertz,the effective height, h e in meters, is determined fromh =796 Ed(23e I f (2-3)aIn a theoretical treatment of the radiation characteristics of anelectrically short monopole <strong>antenna</strong>, the <strong>antenna</strong> current is normallyconsidered to be the current at the base of the monopole. The radiationresistance under this idealized situation is the classical valuefor the <strong>antenna</strong> alone. For the practical situations involved with thesubject system, the <strong>antenna</strong> current as measured and stated here is notnecessarily the current at the base of the <strong>antenna</strong> and may include someloss currents. The radiation resistance obtained using these measured<strong>antenna</strong> currents is therefore an effective value influenced by theselosses.More details of the near-fields from a VLF transmitting <strong>antenna</strong>are given by Garner and Raudenbush (1).2.2 Field Strength MeasurementsThe radiation resistance and effective height of the NPM transmittingsystem were determined from a large number of field strength measurementsat known distances from the NFM <strong>antenna</strong> in the region where thefield strength is proportional to the inverse of the distance. The fieldstrengths were measured using DECO Field Intensity Meters, Model C400-A,manufactured by DECO Electronics. These equipments employ a loop <strong>antenna</strong>and are calibrated to measure field strength in dB relative to one microvoltpee- meter. It should be noted that these field strength measuringequipments with the shielded loop respond only to the magnetic fieldcomponent of the electromagnetic energy radiated. However, if it isassumed that a free space impedence relationship exists between theelectric and magnetic field components, the meter can be calibrated interms of equivalent electric field intensity. Therefore the parameter3 UNCLASSIFIED
UNCIASSIFIED AV CE in (2-2) and (2-3) used in calculating Rr and he is the value measuredusing these measuring equipments.Special, two-minute, key-down transmissions were provided by NPMfor the field strength measurements. In addition some field strengthmeasurements were taken prior to these special transmissions while thetransmitter was being tested by Continental Electronic ManufacturingCompany (CE4C). These CEMC tests provided additional time to check oldmeasurement sites for accessibility, possible field strength gradientand poor loop nulls and when necessary to relocate to a new site. Measurementswere made at five operating frequencies, 14.7, 16.6, 19.8,23.4, and 28.5 kHz, with the NII.1 <strong>antenna</strong> in the dual and east array configurations.For reasons stated previously in the <strong>report</strong>, the singlewest array configuration was not tested at the 14.7 kHz test frequency.The two-minute transmissions were started as soon as the transmitter wasproperly tuned (indicated by several short breaks in the transmission)N to a test frequency. A two-minute transmission at the next testfrequency was then made after the transmitter was retuned. This cyclewas repeated until the measurements had been completed for all the sitelocations and at each test frequency for a particular <strong>antenna</strong> configuration.The dual array measurements were made on 2 December with somepreliminary data also obtained on 23 and 24 November 1971 during theCEMC test runs. The east array measurements were made on 3 Decemberalso supplemented by some data taken on 26 November during the CEMC testruns. The west array measurements were made on 3, 4, and 6 December 1971.Precautions were taken to ensure that the measurement sites werefree from local anomalies in field strength, as might be caused by theeffect of overhead power lines, fences, buried cables, or abrupt discontinuitiesin the conductivity of the terrain. The ratio of the maximumto the null signal level was noted (obtained by nulling the loop on thesignal and then rotating the loop exactly 90 degrees) and sites havingless than a 40 dB ratio were considered unsatisfactory. The existenceof any appreciable gradient in field strength at each site was also determinedby moving the loop to at least three locations separated aminimum distance of 50 feet, and measuring the field strength at eachlocation. More than 0.2 of a dB change in field strength was consideredunsatisfactory and the site was relocated. After the field strengthreadings had been taken at all the sites, a plot of field strength as afunction of distance was made. Any site for which the field strengthdeviated more than 2 dB from the linear average was considered to be unsatisfactoryand a decision was then made to relocate or eliminate thatsite.There were two field strength measuring teams operating simultaneouslyin the field while another NRL representative recorded <strong>antenna</strong>4 UNCIASSIFIED
IUNCLASSIFMDft- AVAILABLE COPYcurrents at the transmitter. Normally each team would make measurementsat all test transmission frequencies at a particular site, and then mo,,eto the next site. Each team had a set of Geological Survey quadranulemaps pertaining to their areas, and the location of each measurementsite was carefully indicated on the appropriate maps by the measurementteams.The metering circuit of the CkOO-A Field intensity Meter is suchthat field changes of 0.1 dB relative to one microvolt per meter aredetectable, with estimates to the nearest 0.05 dB being possible. Eachof these meters was accurately calibrated in a standard field using thetwo-loop method of calibration prior to and following the field measurements.No meter showed a change greater than 0.1 dB relative to onemicrovolt per meter over the period of the field measurements. A precisemilliameter with an accuracy of 0.5 percent was used as the primaryreference for the two-loop method of calibration, and also for standardizingeach C400-A meter throughout the period in which field measurementswere made. It is believed that the calibration techniques used resultedin measurement accuracies within plus or minus 0.1 dB relative to onemicrovolt per meter. To improve the overall measurement accuracy severalmeasurements were made at some sites by different measurement teams.2.3 Distance MeasurementsIt can be seen from equations (2-2) and (2-3), that the distancefrom the transmitting <strong>antenna</strong> to the field measurement sites should bemeasured to an accuracy as good or better than that of the field strengthmeasurements in order to determine the radiation resistance and effectiveheight to a high degree of accuracy, since the errors of E and d areadditive. The island of Oahu is accurately mapped by the U. S. GeologicalSurvey on quadrangle maps. Knowing the latitude and longitude ofthe measurement sites and the NPM transmitter location as scaled fromthe quadrangle maps the distances could be calculated using a computerprogram. The accuracy of these distances is believed to be commensuratewith that of the field strength measurements.2.4 Antenna Current MeasurementsAlthough at the time of the NRL field strength measurements, theNPM <strong>antenna</strong> current meter had been calibrated, it should be noted thata frequency dependence does exist in the technique used to measure the<strong>antenna</strong> current. During the NPM transmitting system heat runs, conducted5 UNCIASSEFIED
I1UNCLASSIFIEDby CEMC, the frequency dependence was discovered and investigationswere carried out to determine not only the source of the problem, butto ascertain a valid method of obtaining the true <strong>antenna</strong> current. Adetailed description of the final technique adopted by CEMC will not bediscussed here, but basically it required a console mounted panel meterwith a linear 0 to 100 scale, and then using a Pearson ElectronicsStandard Current transformer (0.01 volt/ampere) and a digital vot..eteras the reference current reading device, the <strong>antenna</strong> current was variedin steos for a particular test frequency. The Dane! meter readings andthe <strong>antenna</strong> currents were recorded for each step over the selected range.This procedure was repeated until all the test frequencies had beencovered. Finally, using the recorded data, a family of curves was plottedof <strong>antenna</strong> current versus panel meter numbers for each test frequency.For the field strength measurements, an <strong>antenna</strong> current of about85 percent of the CF4C suggested operating level for each <strong>antenna</strong> configurationwas maintained as constant as possible. If any significantchange in the panel meter indication did occur during the measurements,the meter reading was recorded and the corresponding <strong>antenna</strong> current waslater extrapolated from the curves. It should be noted here that readingthe panel meter accurately is quite important, especially in thelower portion of the scale. The deflection of the panel current metervaries as the square of the current, causing the lower portion of themeter scale to be extremely compressed. This means that the scalegraduations for the smaller values of current, say below 400 amperes,could be as much as 20 to 30 amperes per scale division. Thus an errorin reading of + 5 amperes or more could occur with little difficulty,and in turn the values of the radiation parameters would reflect thiserror. This subject will be discussed further in the result portion ofthe <strong>report</strong>.2.5 Corona ý.easurementsA test to determine the possible onset of corona losses for the<strong>antenna</strong> system when operated in the dual array configunration was performedon 7 December 1971 at the 14.7 kHz, 23.4 k.z, and 28.5 kz testfrequencies. The technique used was to first, tune the transmitting=system to some nominal <strong>antenna</strong> current and then to continue transmissionsin a key-down condition for two minutes to allow for proper orientationof the receiving loop. Next, the <strong>antenna</strong> current was reduced toa predetermined lowest usable value mnd a field strength measurement wastaken in the key-down condition. The <strong>antenna</strong> current was then increasedin given steps with a two-minute d~ration key-down transmission being6 UNC LXS TFT[
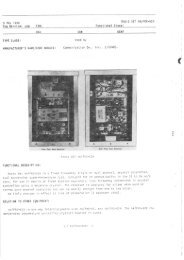
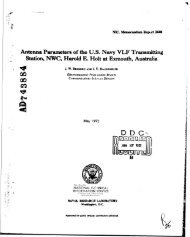
UNCLASSIFIEDmade at each increment to enable field strength readings to be taken.This procedure was continued until a highest predetermined value of <strong>antenna</strong>current was reached, with field strength readings taken at eachtwo-minute key-down period.For this test two fixed sites were chosen that appeared to give themost consistent results during the previous field strength measurements.Two teams operated simultaneously in the field while another TIRL representativerecorded <strong>antenna</strong> currents at the transmitter.It should be noted that the technique used for corona loss detectionis dependent on three important factors. First, the <strong>antenna</strong> currentmetering circuit must accurately indicate the current at the transmitteroutput. Second, there should be minimal losses between the transmitteroutput and the <strong>antenna</strong> input. Third, the <strong>antenna</strong> current panel metermust be read as accurately as possible. If these three conditions aremet, then the recorded current will be the true <strong>antenna</strong> current, and anyindication of non-linearity between field strength and <strong>antenna</strong> currentwill be indicative of corona losses.3.0 FIELD STRENGTH FEASUREENT SITESA total of 20 sites were used for field strength measurements. Asshown in Figure 1 these sites were divided for convenience into twogroups; those on the west, southrwest, and center portions of Oahu andthose on the southeast, east, and northeast side of Oahu. The siteswere chosen, in general, to obtain as many locations as possible arýundthe Island away from highly industrialized or populated areas. Many ofthe sites werc at beaches or parks located around the coae.t of 'ahu.Because of the relatively small size of Oahu and the location of the NPMtransmitting <strong>antenna</strong> system, some sites on the west coast were withinthe distance limits where the contributions of the induction field tothe total measured electromagnetic field cannot be reglected. Thenecessary modifications to the measured field strengths at these locationswere made ia processing the data.Each site was chosen so as to be wel! away from any obstacle thatwas believed to be a possible source of a local field anomaly. As mentionedpreviously the tests prior to 2 December 1971 were most helpfulin attaining this goal because they enabled NRL representatives to investigatethe measurement sites and to relocate those sites where anomaliesin the field strength were discovered, before the special measurementwork waa begun. Consequently the field measurements were completedin an efficient manner when the special transmissions became available.7 UNCLASSIFIED
UNCLASSIFIED4.0 DATA PROCESSINGThe field strength mcasurement data were tabulated in log bookz,and at the end of each series of measurements, the data were reviewedto determine the reliability of the individual data samples. This reviewwas based on the depths of the loop <strong>antenna</strong> nulls, and the scatterof plotted data points on a field strength versus distance curre. Afterthe data were reviewed and found acceptable, the corrected fie!3 strenguth,E, for each measurement was tabulated after applying appropriate metercorrection factors.The field strength meters, employing a shielded loop <strong>antenna</strong>, measuredthe total magnetic field which is the resultant of the inductionand radiation fields. The effect of the induction field on the totalmagnetic field was calculated and the magnitude of this effect was eliminatedfrom the field strength measurements after the meter correctionfactors had been applied. The induction field effects diminish rapidlyas distance and frequency increase. For the dual <strong>antenna</strong> array at a"distance of 9.5 kilometers (site C) and at a frequency of 14.7 'Kz,0.48 dB of the total magnetic field is the result of the effect of theinduction field. At this same frequency, and at a distance of 21kilometers (site K), the contribution of the induction field to thetotal field is reduced to 0.10 dB. At 28.5 kHz the induction fieldaccounts for only 0.13 dB of the total magnetic field at the shortestdistance used, 9.5 kilometers."After applying the meter correction factors and taking into account* the effects of the induction field, the field strengths were normalizedto a constant <strong>antenna</strong> current for each transmission frequency. For mostof the special transmissions for these measurements, the NPM <strong>antenna</strong>* current, Ia, was adjusted to the same value at a particular frequency,and this was the <strong>antenna</strong> current used for normalization. The correctedfield strengths normalized to a constant <strong>antenna</strong> current were then normalizedto a distance, d, of 100 kilometers and identified as EId.The number of field strength measurements made at each site andeach frequency were essentially the same for all frequencies except forthe dual <strong>antenna</strong> array and the east <strong>antenna</strong> array at 23.4 kHz. Forthese two <strong>antenna</strong> configurations at 23.4 kHz, some measurements weremade during the CEMC tests. In order to avoid giving undue weight toany site, all measurements at a site for a particular frequency wereaveraged (arithmetic mean), and those individual site averages were thenused in determining the overall average (arithmetic mean) field strengthnormalized to a constant <strong>antenna</strong> current and distance Ed. Since theId'8 UNCLASS IFIEDfiJ;;
UNCIASS IFIEDSaveragefield strength EId in millivolts per :2eter, was normalized to adistance of 100 kilometers, the expression for the radiated power, Pin kilowatts, reduces toPrEIdI(41The radiation resistances, R , in ohms, were calculated using theequationRr = P/a2(4-2.)where P is the radiated power in watts and I is the correspondingnominaIrvalue of <strong>antenna</strong> current in amperes.The values for the <strong>antenna</strong> effective height, h , in meters, werecalculated using eq. (2-3), which, since Eld is nor~ialized to a distanceof 100 kilometers, reduces toh -= 7.96xlo 4 Eld/Iaf (4-3)where I is the same as used in eq. (4-2) and f is the frequency inakilohertz.5.0 IMZSULTS AND DISCUSSIONSThe VLF transmitting <strong>antenna</strong> system for NPM is normally operatedV in the dual array configuration (i.e. the east and west arrays are drivenin parallel), however, the <strong>antenna</strong> system can also be operated witheither of the single arrays employed. Although the field strength measurementsfor each <strong>antenna</strong> cunfiguration utilized the same number offield sites (20), the number of measurements for the dual and east arrayat the 23.4 kHz test frequency exceeded those for the west array. Forthe dual array the number of measurements at 23.4 kHz totaled 64 ratherthan 20 by utilizing the CEMC tests on 23 and 24 November. The eastarray measurements at 23.4 kHz totaled 36 by utilizing the CEMC testson 26 November. For the west array the 14.7 kHz test frequency was excluded,however, 20 measurements were made at each of the other testfrequencies. The test to determine the possible onset of corona wasperformed on 7 December 1971 after all other required tests had beencompleted. The <strong>antenna</strong> was in the dual array configuration and operatedat 14.7, 23.4, and 28.5 kHz test frequencies.9 UNCLASSIFIED
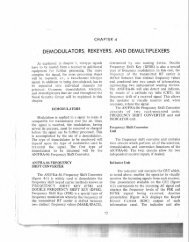
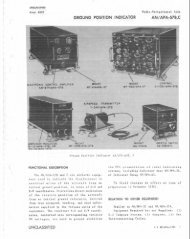
UNCIASS IFIED5.1 Dual Array OperationThe measured field strength values corrected for receiver factorsand normalized to a constant <strong>antenna</strong> current, Ia, are presented inFigures 2 through 6 for the IMM <strong>antenna</strong> operating in the dual arrayconfiguration. The data exhibit very little scatter about the averageinverse distance curve.In spite of the small scattering of the field strength data, thedata do show definite local terrain effects. A statistical <strong>analysis</strong>was performed to determine if any one site was being weighted tooheavily. It turns out-that such was the case and therefore some measurementswere discarded in favor of a smaller standard deviation and animprovement in the average normalized field strength.The radiation parameters for the NRM <strong>antenna</strong> system operating inthe dual mode are given in Table 1 and Figure 7. The field strengthsas measured by NRL were further analyzed when the calculated radiationparameters were plotted because the least square polynomial curve fitwas not as expected. Although every conceivable technique was used toanalyze the data, a satisfactory curve to fit the plotted data was notforthcoming. As a result of this more thorough <strong>analysis</strong>, as mentioned-previously, some measurements were discarded because of inconsistenciesand the values of the calculated radiation parameters did change. Sincethe field strength measurements did not seem to be responsible for theunusual shaped curves, other reasons must be found. One very likelysource of error is in the <strong>antenna</strong> current readings, and as can be seenin equations (4-2) and (4-3) an error in <strong>antenna</strong> current, Ia, w-ill changethe values for radiation resistance, Rr, and effective height, h . Asrementioned previously the meter used to read <strong>antenna</strong> current was a regularconsole panel meter movement with a temporary face plate marked offin evenly spaced graduations of 0 to 100. Depending on the frequency,the tick marks for the smaller currents (e.g. 400 ampere range) whichwere in the lower portion of the scale could be 20 to 30 amperes perdivision. Thus an error in reading of + 5 amperes or more could occurwith little difficulty and in turn the effective height could be changedby one to two meters. If, for example, the effective height at 16.6 kHz(see Figure 7) were increased by 2 meters f•.om 191.9 to 193.9 meters theoverall curve fit for the dual array would improve. Another possiblesource of error is the method used for detecting the <strong>antenna</strong> current.The accuracy of detection technique is at best 5 percent, and if morethan minimal losses occur between the transmitter output and the <strong>antenna</strong>input, the error is even larger.10 UNCIASSIFTED
UNCLASS IFIED5.2 East Array OperationThe NPM transmitting system can be operated with one of the arrayseither east or west disabled. For east array operation, the west arrayfeedline is disconnected and the <strong>antenna</strong> grounded, thus enabling thedriven east array parameters to be measured. The radiation parametersfor the east array were measured in the same manner and at the same testfrequencies as for the dual array configuration. The field strengthsfor the east array operation are given in Figures 8 through 12 and exhibitthe same general distribution as for the dual array operation.The same statistical <strong>analysis</strong> that was performed on the dual array wasused to determine if any one site for the east array measurements wasbeing weighted too heavily. The result was a smaller standard deviationand an improvement in the average normalized field strength.The radiation parameters for the NRM <strong>antenna</strong> system operating withonly the east array are given in Table 1 and Figure 7. The apparentinconsistency at the lower frequencies as shown in Figure 7 could be due,as was mentioned for the dual array, to the errors in panel meter readingsand/or ar.tenna current detection techniques.5.3 West Array OperationDuring the period of the measurement program the field strength ofthe NPM transmitting system with the west <strong>antenna</strong> array only being drivenwas measured. The radiation parameters for the west array were measuredin the same manner as for the dual and east array but at only four testfrequencies. The field strengths for the west array operation are givenin Figures 13 through 16 and show the same tendencies as for the dualand east array operation. The west array standard deviation and normalizedfield strength shown in Table 1 are a result of the same statistical<strong>analysis</strong> used for the dual and east array configurations.The radiation parameters for the NPI <strong>antenna</strong> system operating withonly the west array driven are given in Table 1 and Figure 7. Noticeshould be taken of the values of radiation resistance and effectiveheight at the four test frequencies because these values are less thanthe dual array and greater than the east array configuration. The plotsof effective height and radiation resistance for the west array appearto result in a smooth curve, but without any field strength measurementsbelow 16.6 kHz the curve cannot be extended to the 14.7 kHz test frequencynor can the curve fit be considered absolutely correct throughthe measured points.11 UNCIASSIFIED/ " "• /
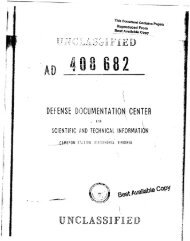
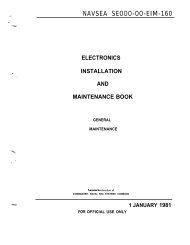
UNCLASSIFIED5.4 Corona TestsThe test to determine the possible onset of excessive corona losseswas performed employing only the dual array <strong>antenna</strong> configuration. The"<strong>antenna</strong> current was varied in given steps over the 14.7 kHz, 23.4 kJiz,and 28.5 kHz test frequencies and the resultant field strengths meas,.redat two fixed sites. As can be seen in Figures 17 through 19 the plotsof radiated potver versus <strong>antenna</strong> current exhibit a slight S shape and atthe 14.7 kHz test frequency a flattening off is apparent near the highend of the radiated power. A check of possible corona onset at the 16.6kHz and 19.8 kHz test frequencies in addition to those measured ray haveteen helpful, but at the time these tests were conducted, the !TPM transmitterwas experiencing some difficulties. Numerous kickdowns of thetransmitter power had occurred during the entire series of tests by CEMCand during the field strength tests by NRL. ConsequentJy, when thecorona tests were conducted on the NPM transmitting system, the possibilityof transmitter breakdown was considered and therefore only thelowest test frequency 14.7 kHz, the operating frequency 23.4 kHz, andthe highest test frequency 28.5 kHz were selected. Even though onlythree test frequencies were used, the test still required an excessiveamount of time (8 hours) to accomplish because of numerous transmitterpower shutdowns.As was pointed out earlier in the <strong>report</strong>, the technique used to detectthe possibility of corona loss depends on three important factors.The <strong>antenna</strong> current metering circuit must accurately indicate the true:current at the transmitter output, there should be minimal losses betweenthe transmitter output and <strong>antenna</strong> input, and the <strong>antenna</strong> current mustbe read as accurately as possible. For example, an inspection of Figures17a and b will reveal an irregularity at an <strong>antenna</strong> current of 905amperes for the 14.7 kHz test frequency at two measurement sites-. Twodifferent field strengths were measured at the same <strong>antenna</strong> current(905 amps), but at separate times during the tests. The higher field.V strength was measured at the initial tune up of the transmitter and thelower field strength was measured when the <strong>antenna</strong> current was stepoedthrough a range of currents for the corona test. It is difficult topoint out the exact cause of this irregularity because it could be onething or a combination of problems. Either the <strong>antenna</strong> current detectiontechniques are at fault, the <strong>antenna</strong> current was read incorrectly,the system is going into corona, or a combination of these difficulties-.is responsible. More tests are required before any definite conclusionscan be made, but an irregularity does exist in the corona test resultsand it was witnessed at two different measurement sites.12 UNCLASSIFIED
UNCLASSIFIED6.0 ACOWIL0EDGhN,2TSThe authors express their appreciation for the cooperation of themany individuals and organizations that assisted in the measurementwork necessary to evaluate the <strong>antenna</strong> radiation parameters of the N?'4transmitting facility. The individuals and organizations are: Mr. M.Look and staff of NAVSEEAPAC; Mr. G. Williams and staff of CEMC; LCDRD. Tatum, CWO P. Knapik and staff of the Naval Transmitting Facility,Lualualei. Also the assistance of our colleagues, F. Rhoads, 4. Lawrence,and I. Hansen, who assisted in the collection and processing of the data,is gratefully acknowledged.13 UNCLASSIFIED
UNCIASS IFIED7.0 REFERENCES1. Garner, W. E. and Raudenbush, J. E., "Program for the Determ-,ination of the Effective Height and Radiation Resistance of the VLFTransmitting System at NAVCOMSTA, North West Cape, Australia", NRLMemorandum Report 1606, April 23, 1965.14 UNCLASSIFIED
UNCLASSIFIED4j c 4 %0csr- o 0 n 00C4 0 0% V4 co %4u 0 4)J N-%U1. ~ 0 O 04.4 0 ) o a,0 00 &IbUU%5 rý c r. 0% 0%t.4 -. 4 V-4%N "cq 4-1P4 e-S - 44 p-r 4 r- 4 1-40r 00 -~~e O 4 '~04 w.co r mt 4CJ O %o04e 0%0%co J-0%-TC'l,-I-4" s 04 r- m0V4 0 1 %mo i * wl00 000 00 4 0 0000 4 qenL00%0co0 %D cl %4~O0 W$ t 4 n 00 14~ 04"-4 04 04( ~ S-4 -4NNCJ *4 c~lC'NcUV0w 45 r-0e. aq n n 0 -0 -4 on0ucd 41 0o'oc1c5 LnO~% r-rnoC4oC't0 s-a 4P-4 -4 -40.r40040 0 W~4 :3 0 00a-0 0 0O'%0 o 0ON 00 co 00 0 4% 40 4MC4 C4"ý 1*04) 0 0 00 0 000C 00CC0000a0 444J C1 4C14 J04 C4 C4 4C4 eqC4 N 44Z, Z ý0cas4)ý4- 4 C N r-..0'u 4v 4Cý4sr 4u15 UNC4ASS4.
FitiFig.1 sits ued -Oahu fr Haaii feldstregthmeasremnts*-16
X5 at7~T~bDcLL1rI-.5pczI-OOHI C1H9) H C)Aic 0C) C17
CD1CO LOQ-CO CD WC ()~x.- 4 -4Jk0oU cd04)0 wOCD-)C DC-n nNIOAUI ("Iuc HICDlI TC))18
CDCDr -Ia) -0a0"I C) -:T C) >)C)C- -4) - -4 r I(N/IOAODIN ~U8]) H9N7dI~T3119D
------ CciCEz uC\1~ fcL~-)\J~hoX5
____ ____ ____ ___ __________ ___C)I COJ CD I -- U) 3 -4L)0CD CD CDCD- tWI1OAUOINT~RO H19~1S 1AUmd4LL21_
0.8_M >L06 -L.- 60 wz 0.5--00._'.¢";0.9220-0.2-0.2UA0.10 I I15 20 25 30FREQUENCY (KILOHERTZ)Fig. 7 - Radiation resistance and effective height of the NPM <strong>antenna</strong>system operating in the dual mode, single east mode and single westmode as a function of frequency.22". .:)'i,/- -i
LU -fl-'CdL4CDzPCCPC44-. p,-r230- .. - - - -" -* - , - - - .~0Go-
LCU CCDL.4J2:~2 M0DC-) :J cdZ 0c244/ ,c
______ ___ ___ ___ ____ ____ ___ ___ ___ ____ ___ ___ _ A-ijt--CLCI C-) OD(1 DWC'd \dCOMM 2LLJ24 p0>10rmScoC) C)L.~. C)-__255~$cc-- L. J
___________________________________c:juJXco 00~Z4~4J-4(N/I1OAOH3IWCD C CD~ C-) CDC-1iH 90) HID ]YiS W-III26BEST AVAILABLE COPY
C)r1 r)1U) X:/iuCLncD~o2-1c @20co CD CD C) CD CD CD(W/iIOAOH3IN Alýl 90) Hi9NI1AHiS MAHJ27
U):~ U) .N-NLb,- (C) N U T04JCD-0p 0~.- 4,C)-C3 CD(W/-IAO31 TAy9 ) I -N-qýJIS01,10-) ccr)28/VALECPBES
4-~~~1 I ~ I C/DLiCE~-coc/ 4JJz/rr400IfLL.LLf) r) CT)GW/-i]OAOUJTW TIHJ HO) HiONWiuv; gi29
N J CL.LUCCZE'//- - Cl/ -202/c-_ a r- Lr,_ . . L 1 .Xc!)C )C )C --L) - 4_ , ') t_ -.(NC CT-)BS VL C41/ I• 0300(•4i-O OU 1 -. IU 9Q] • ON I Q -lAI.BEST AVAILABLE COPY
- , ¾C.,- '7 . t&'V ~ .CL a)r- LU CD:3 co~41)1- -1C)LU7004.0c.CD' CD Ccn Z)0C(W/I1OAOY3IN TAY 00) HIDN_]Y.S 01f1-A31
2 , II II .. . . I I "iCcNPM1.lL7 KHZ2- -- 0 1270HMKDEC 714Ixx800 1600•, RNTENNA CURRENT fRMPI.. ~(a) '-JLU"NPM""14-7 KHZ""24 -O ,I27OHM- ~DEC71CE.LU'cn-S]5a-.-00 800 1600RNTENNR CURRENT (RMP)Fig. 17 - Radiated power as a function of <strong>antenna</strong> current for the NPM<strong>antenna</strong> system operating with dual array at 14.7 kHz. (a) site C,es) site M.32BEST AVAILABLE COPY
33NI I I I I lI 7INPM23.4 KHZ"3,- 0- 4080HM- : DEC 71C-m 27-mna-21-£L1 SI I I I 1 1 11o00 800 1600ANTENNA CURRENT (RMP)(a)331NPM23. 4 KHZ30 -0 4Q8OHM- JDEC 7i_JCO9 27rncD 2.4-Er112CL 21-100ANTENNA800CURRENT (AMP)1600(b)Fig. 18 - Radiated power as a function of <strong>antenna</strong> current for the NPM<strong>antenna</strong> system o p era t Ing with dual array at 23.4 kHz. (a) site C,(b) site M.33 3Fig.oeJsafntono 18-ldajnen urn o h P
NPM0 - 0. o6120HM1CEC,7cc ._2K@ 2 L!8-- I I I I I I I .""0000RNTENNR CURRENT (RMP)]10(a)LLýNPM28 5 KHZS3o - 0 o612OHMDEC 7i 90~a.W9 4021-00800 16-00PNTENN: CURRENT (RMP)(b)Fig. 19 - ]Radiated power as a function of <strong>antenna</strong> current for the NPM<strong>antenna</strong> system operating with dual array at 28.5 kHz. (a) site C,(b) site M.34BEST AVAILABLE COPY