antenna design report - VIR History
antenna design report - VIR History
antenna design report - VIR History
- No tags were found...

You also want an ePaper? Increase the reach of your titles
YUMPU automatically turns print PDFs into web optimized ePapers that Google loves.
ContainsPage/sThis DocumentReproduced From• Best Available CopyAElkADAO 82VKDEFENSE DOCUMENTATION CENTERSCIENTIFIC AND TECHNICAL INFORMATION_• .AMERON ST;]ION A•tEXANDRIA. <strong>VIR</strong>GINIABest vallable CoPYI!UNCLASSJFRHED
hs Document Contains Page/sReproduced FromBest Available CopyNOTICE: When government or other drawings, specificatIvlar-•-therdata are used for any purposeother than in connection with a definitely relatedgovernment procurement opcration, the U. S.2Government thereby incurs no responsibility,,\nor anyoblirg'_hon whatsoever; a.nd the fact that the Governmentmay have formulated, fturLished, or in any way.3upplied the said drawings, specifications, or otherdata is not to be regarded by implication or otherwiseas in any manner licensing the holder or anyother person or corporation, or conveying any rightsor permission to manufacture, use or sell anypatented invention that may in any way be relatedthereto.Best Available Copy
CON T ETSEPage1. Introduction 1-12. Scope of Study 2-1t3. Basis2. 1 Electronic Considerations 2-12. 2 Structural Considerations 2-2for Electronic Analysis 3-13. 1 General 3-13. 2 Resonant Frequency Studies 3-23.3 Performance Requirements 3-33.4 Tolerances 3-44. Basis for Structural Analysis 4-14.1 General 4-14. Z Towers 4-14. 2. 1 Aspect Ratio Study 4-14. 2. 2 Effect of Varying Cantil~ver Projectionand Halyard Type 4-24.2.3 Fixed 'Halyard Study 4-34.3 Top Hat 4-44. 3. 1 Aspect Ratio Study '4-44.3.2 Effect of ilalyard Type 4-43.3 Fixed Halyard Study 4-45. Summary of Results 5-15.1 General 5-15.2 Resonant Frequency Studies 5-15.3 Coupling Circuitry Effects 5-45.4 Aspect Ratio Studies 5-55.4.1 General 5-55. 4. 2 Eluctronic Performance Facto! _ 5-55.4.3 Cost Factors and Other Considerations 5-10Best Available Copy
Page. Hal- a rd- C;ntilcvcr-Compe ation Studies 5-115.5.1 lectronic Performance Factors 5-115.5.2 Cost Factors and Other* qonsiderations 5-12*j5.6 Fixed Halyard System 5-145.7 Assessment of Fixed Halyard System 5-15j Other Items Incluaed 6-16. 1 Ground System Cost 6-16.2 Main String Insulators 6-27. Conclusions and Recommendations 7-1AppendicesA. Effect of Coupling Circuitry on OperatingFrequency A-1_.__BBComposite Performance Curves andTolerancesB-lC. Cost Estimates C-IReferencesIAl[ ~Best Available Copy .t:K
ILLUS TRATIONSFigure 2-i Layout of Antenna ArrayFigure 2-2 Summary of DimensionsFigure 2-3 "B"-Tower (Aspect Ratio 0.70;Similitude Ratio = 1. 10)Figure 2-4 "B"-Tower (Aspect Ratio 1.00;Similitude Ratio = 1. 00)Figure 2-5 "B"-Tower (Aspect Ratio 1.40;Similitude Ratio . 1. 00)Figure 3-1 Antenna Parameters from Model Measurements,4-Wire Gage DownleadsFigure 5-1 Resonant Frequency Tests Configurations1, 2, 9, 10 and 11Figure 5-2 Resonant Frequency Tests Configurations3, 4 and 5Figure 5-3 Resonant Frcequency Tests Configurations6, 7 and 8Figure 5-4 Resonant Frequency Tests ConfigurationsIla, l1b and 12Figure 5-5 Simplified Antenna and Coupling CircuitryFigure 5-6 Bandwidth as a Function of Scale FactorFigure 5-7 Resonant Frequency as a Function of Scale FactorFigure 5-8 Top Hat Voltage as a Function of Scale FactorFigure 5-9 Predicted Performance of Single Modified CutlerAntenna from Model Measurements, 4-Wire CageDownleads
TABLESTable 3-1 Basic Antenna Parameters Single ModifiedCutler AntennaTable 5-1 Summary - Resonant Frequency Test DataModel Data, Adjusted to Full ScaleTable 5-2 Summary - Cantilever - Compensation StudyModel Data, Adjusted to Full ScaleTable 5-3 Comparative Costs of Antenna SystemsTable 5-4 Wind Shear and Pulloff DistributionsTable C-i Summary of Estimated Costs (I of 4)Table C-i Summary of Estimated Costs (2 of 4)Table C-I Summary of Estimated Costs (3 of 4)Table C-I Summary of Estimated Costs (4 of 4)
1. INTRODUCTION ,Tthi -4e background and studies,,leading to - -recommendation for the basic configuration of the high-power, very-lowfrequency<strong>antenna</strong> system on which final <strong>design</strong> was developed for theVLF <strong>antenna</strong> to be constructed at the U. S. Navy's VLF CommunicationFacility, at-North West Cape, Western Australia. The recommendation,subseque tly accepted by the Navy, was based on work accomplishedunder a preliminary engineering phase and continued under the finaldesig contract.Under Bureau of Yards and Docks Contract NBy-37598, aFealsibility Study and Preliminary Engineering Report for the VLFCo 4 nmunication Facilities, Pacific (Ref. 1) was developed by the JointVejture firm of Developmental Engineering Corporation (later,DýCO Electronics, Inc.) and Holmes & Narver, Inc. The final <strong>design</strong>eftort based on these preliminary studies was carried out under ContractNBy-37636 between the Bureau of Yards and Docks and the augmentedJoint Venture firm, HNCD, comprised of Holme s & Narver, Inc.,Continental Electronics Manufacturing Company and DECO Electronics, Inc.SFour basic approaches were considered under the preliminaryengineering phase: a complete Cutler -type <strong>antenna</strong> scaled down to aboutnine-tenths size, a single 3000-foot vertical radiator, a pair of 2200-footvertical radiators operated simultaneously and a single modified Cutlertype<strong>antenna</strong>. The latter, a single section of the Cutler <strong>antenna</strong> scaledupward by a factor of 1.28 was selected as the most economical of the<strong>design</strong>s examined and formed the basis for further work in the PreliminaryEngineering Report (PER) and the initial base for the final <strong>design</strong> effort.1-1
IThe electrical parameters for the basic <strong>antenna</strong>, as estimated inSupplement 1 (Ref. 2) to the PER, were subjected to scale model studies(Refs. 3, 4) under Change Order F to the same contract. In the coursegof the model studies, information was developed with regard to electricalperformance under various structural configurations as outlined laterunder Section 3, Basis for Electronic Analysis. It was left, however, tothe final <strong>design</strong> contract to analyze this data in more detail and to developcosts corresponding to the various electronic parameters so that anoptimum <strong>design</strong> could be pursued under the detailed final <strong>design</strong> effort.It is the purpose of this <strong>report</strong> to document those further electronicanalyses and structural cost studies and their composites which wereanalyzed to develop the configuration selected for final <strong>design</strong>.Navy-Joint Venture conferences were held in early January andearly February to review developments toward the <strong>antenna</strong> selection andto resolve problems which developed. The final recommendation ofthe Joint Venture was forwarded to the Navy by letter of 7 February 1962(Ref. 5) and the selected basic configuration concurred in by reply letterof 20 February 1962, Serial 238 (Ref. 6).This <strong>report</strong> is aimed basically at showing the development of the<strong>design</strong> to the point of recommendation in the HNCD letter of 7 February 1962.Since an appreciable time has elapsed since the recommendation wasmade and basic selection approved, it should be borne in mind that the<strong>report</strong> reflects the thinking and conditions at a time before final decisionsrelating to all major features of the towers and top hat system had beenmade. Consequently, it is to be expected that some of the details containedin the <strong>report</strong> will not reflect conditions as finally evolved. Any suchdifferences have stemmed from later developments in the course of thefinal <strong>design</strong> process.1-2
One item of particular note which occurred subsequent to thebasic configuration selection is discussed since it is a major ieature inthe finally developed system. This is the non-counterweighted, or fixedhalyard,system used in lieu of the original counterweighted system whichforms the basis for this <strong>report</strong>. While the modification would have hadno major influence on the selection of the optimum combination of <strong>antenna</strong>height and top hat span, there is an economic importance associated withthe use of fixed halyards which justifies inclusion of the study in this<strong>report</strong> for completeness.1-3
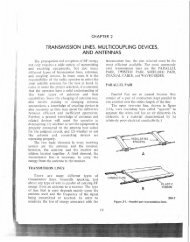
2. SCOPE OF STUDY2. 1 Electronic ConsiderationsIn the electronics portion of the <strong>antenna</strong> selection study,several items were considered. These included the critical item ofdeveloping means of increasing the resonant frequency of the system, theeffect of coupling circuitry on maximum operating frequency, and thefurther analysis of data gathered under the Change Order F tests. Thisinformation was combined with cost information developed for variouscombinations of top hat heights and spans to arrive at a practical optimumfor maximum bandwidth for no more than the <strong>antenna</strong> system cost developedin the PER.During the course of the study, approximate ground systemcost variations with top hat heights and spans were also developed aswere the main string insulator requirements as a function of top hat voltage.Results of final model studies are contained in the <strong>report</strong> "Model Studiesof the VLF PAC Antenna" (Ref. 7).2.2 Structural ConsiderationsThis investigation consisted of two phases. The first phaseconsidered optimization of the structural system with respect to electronicperformance. For this, preliminary structural <strong>design</strong>s were developedfor 18 cases involving various tower heights and top hat spans chosen tocover the range considered in the electronic performance determinations.Costs were developed for each of the 18 cases, in all of which slopingcounterweighted halyards were assumed. Figure 2-1 shows the layout ofthe tower and <strong>antenna</strong> system, and Fig. 2-2 summarizes the principaldimensions for the various cases.2-1
A second phase considered the effect of varying certainstructural parameters. The intent of this phase was to study the effectand develop the costs of changing the length of the cantilever at the topof the tower for both sloping and vertical halyard systems. Again, thesecosts were evaluated in terms of the electronic performance under correspondingstructural conditions.counterweighted halyards.These tower systems also utilizedAn additional investigation conducted after the basic <strong>antenna</strong>configuration was selected studied a fixed (non -counterweighted) slopinghalyard system in lieu of the counterweighted system. It is <strong>report</strong>edhere for completeness.The structural criteria used was consistent with that previouslyused in the Preliminary Engineering Report phase (Ref. 1). The analysisapproach, however, was necessarily less refined than that of Ref. 2 becauseof time limitations.A reasonably accurate structural analysis of the top hat for thesingle modified Cutler <strong>antenna</strong> was available. This analysis served as abasis for estimating pulloffs, conductor tensions and counterweight massesfor the various configurations.Figures Z-3, 2-4 and Z-5 show the makeup of the tower andguying system for the shortest towers, the single modified Cutler <strong>antenna</strong>towers (aspect ratio*. 1.0; similitude ratid, = 1. 0) from the PER, and thetallest towers, respectively. The figures represent the extremes andthe approximate average of guy sizes and tower heights.* For definitions of "aspect ratio" and "similitude ratio", see Paragraph 3.Z-2
ATMWEFR 7Y'PC DESIGNA477CA4"A "- OuTLMe RAM6 7TOWeRBt- IAN/ER RIA16 70- WERfn n - EE TOWER303 7M'AU) 3037(14)k4WcE O-C D/MMS/IOAS$YoWMV POR ~SPSC/P/Q MA$S.SEE AIGURE 2.26074 M4A-ý)-FIG. 2-1LAYOUT OF ANTENNA ARRAY
10 S~RS,,. -.-TWERe7YPICAL A4/7EAINA PAIL \•4 /_"EIGHrSTOWER ~9ErW.EAJD/Sr7AAcESTOWERS(ofeeat)_________(eet)(feett) A B C bi c d e0.70 /.10 $.5 788 '157 1042 2225 20M8 4323 2570 43230.70 .20 O6.5 857 1044 /137 2428 12288 47/6 2803 47160.70 1.30 7.0 731 1131 /Z31 2630 2477 5109o 3037 5/1070.85 /00 1.5 870 /024 /10/ 2023 '107 3?'30 2336 .3-300.85 1.05 6.5 ?/3 /074 /155 2V24 2003 4127 ,453 41270.85 /.10 7.0 ?57 1I26 /2/1 2225 2078 4323 2570 43,S0.85 1.20 7,5 1043 /228 132/ 2428 2288 471/ 2803 47/61.00 0.95 7.0 972 /1/8 It?/ 1722 1812 3734 2217 37341.00 4.00 70 1023 1177 1254 2023 /807 3730 2336 37301.00 1.0b 7.5 1074 1236 1317 2124 2003 4127 2453 41271.00 1./0 8.0 1/25 /M 13 7? 2225 20?8 43Z3 2570 43231.20 090- 7- I//06 1243 13/3 /82/ 171,4 3537 2102 35-371.20 0.175 8.0 1/66 /13/3 /386 /921812 3734- 22/-? 37341.20 .00 8.0 /228 /38z /145 2023 /?07 3930 2336 39301.40 0.85 8.0 /2/17 /348 /4/4 1720 /62/ 3341 1986 334/Z.40 0.70 8.5 1287 /428 /497 /82/ 1/7/1 3537 2102 35371.40 .O5 .5 /361 15/07 1580 11722 1812 3734 2219 3734[40 /.00 9.0 /432 ,,586 /663 20231 1707 3930 233, 373o0FIG. 2-2SUMMARY OF DIMENSIONS
PLAA1E/. 957.0 ,El 900.0El 693.0II____-G UZk' C4 6LS SALL -161 492.0C/. 308.05E 142.05/ 0.0400-.0'-1ELEVAT/O7 /FIG. 2-3 'B" TOWER (ASPECT RATIO = 0.70: SIMILITUDE RATIO = 1.i0)I
1/2007'o" O/AMErEPZAMTOWEREl. /17700'El /120.0EL 82a.0ALL GUY CA8LES-BRIDGE S"rAID, 12. 06l 383.00 \El. /770__El. 0.cELVATIONFIG. 2-4 "B" TOWER (ASPECT RATIO = 1.00: SIMILITUDE RATIO = 1o00)
1200/200 - _ __ __I-o"•AMFrsRPL.AA/r'ow-EREl. 1523.0EA1836.0 1El 24T/0 1770All GUY QASL•S-El, 00-er.4679.5 1353.0'ELEVATIONFIG. Z-5 "B" TOWER (ASPECT RAT10 1.40: SIMILITUDE RATIO - 1. 00)
3. BASIS FOR ELECTRONIC ANALYSIS3. 1 GeneralThe electronic analysis was an extension of the work undertakenin the PER phase in which the single modified (1. 28) Cutler <strong>antenna</strong>was selected for first <strong>design</strong>. Since the results of this earlier work formedthe basis for the final <strong>design</strong> development, pertinent aspects are brieflyreviewed.The electronic effects of the number of guy levels, the tophat halyard pulloff system (vertical vs sloping), the amount of towercantilever, compensation for these effects by change of the B tower height,and selected locations of the transmitter building were determined underChange Order F. Analysis of the resultant data indicated no significanteffect of the number of guys used (4, 5 or 6) nor of the location of thetransmitter building relative to the helix house. A prelirminary optimumcompromise of halyard type, cantilever, and B-tower compensation, basedon approximate cost trends, was used for the succeeding model studiesconducted under Change Order F.The compromise solution of vertical halyard, 10-foot cantileverlengths and 45-foot B-tower compensations (relative to a strictlyscaled 1. 28 Cutler-size) was applied to the model used in developing theaspect ratio', data. This electrical data was one of the prime factors involvedin gaining increased bandwidth without increasing <strong>antenna</strong> systemThroughout this <strong>report</strong> the terms "aspect ratio" and "scale factor" or"similitude ratio" are used repeatedly. Definitions developed in earlier<strong>report</strong>s are summarized here for convenience: "rAspect ratio" a is definedas the ratio of outer tower height to maximum top hat span, normalizedto the 1. 28-Cutler dimension. "Scale factor" or "similituderatio" s relates all linear dimensions to the 1.28 Cutler <strong>design</strong> forunity aspect ratio.3-1
cost over that of the PER configuration. The aspect ratio study developedthe basic electrical performance data for a Cutler-type <strong>antenna</strong> whoseheight, in relation to horizontal dimension, was varied above and belowthat of the PER configuration (1. 28 times a single Cutler section). Forthe same plan configuration and size, the 1. Z8 Cutler <strong>antenna</strong> was variedin height. Increases of 20 and 40 per cent above, and decreases of 15and 30 per cent below the PER size were investigated.The characteristics of the <strong>antenna</strong> at the five specific aspectratios were determined by model techniques.Intermediate points maythen be determined from curves developed from the measured data. Byfurther analysis, expansion of the "measured" curves, either upward ordownward, is possible by similitude scaling. Table 3-1 summarizes thebasic data resulting from the aspect ratio studies; Figure 3-1 is a plot ofthese basic parameters in the region of primary interest. In developingfurther information in the study, data taken from the smooth curves ofFigure 3-1 was used as a base.3. 2 Resonant Frequency StudiesThe resonant frequency characteristics of the single modifiedCutler <strong>antenna</strong>, scaled upward to 1. Z8 times the size of one of the Cutlersections, was recognized as a critical item in Supplement 1 to the PER.Under strict upward scaling of the Cutler configuration the resonant frequency,and consequently the upper limit of operating frequency, waspredicted to require series capacitance to tune to 30 kc, the desired upperlimit of operating frequency. Inclusion of such tuning element requirednot only the capacitor, but also added such other components as switchesand a static drain inductor, and required expansion of the helix housevolume to accommodate the added components. Recognizing the significantadditional cost, one of the first steps in planning the final model effort was3-2
a study of selected means of increasing the <strong>antenna</strong> resonant frequency inan effort to achieve the desired upper operating frequency of 30 kc.3. 3 Performance RequirementsA Navy-Joint Venture meeting early in January 1962, discussedthe preliminary results of the aspect ratio versus cost study, andthe resonant frequency studies to that date. The results available indicatedthat, at no additional cost for the basic <strong>antenna</strong> system, some gain couldbe made in bandwidth by adjusting the aspect ratio downward and similitudescale factor upward. Simultaneously, however, using an estimated effectof the coupling circuitry on the <strong>antenna</strong> resonant frequency, it appearedthat the desired maximum operating frequency of 30 kc could not be achievedsimultaneously with the gain in bandwidth without the use of a capacitivetuning clement. Consequently, certain criteria for the <strong>antenna</strong> to beselected were modified by the Navy to the following:I. Antenna bandwidth (100 per cent efficiency) -37.5 cycles at 15.5 kc.2. Upper limit of system operating frequency -not less than Z8.5 kc.3. No tuning capacitors to be required to meet(2) above.Other basic requirements remained unchanged, including:1. Estimated cost - not to exceed estimated costof the single modified (1.28) Cutler <strong>antenna</strong>.2. 1 megawatt radiated at 15. 5 kc.3. Operation down to 14 kc, at relaxed performance,if necessary.3-3
3.4 TolerancesIn complying with the electronic requirements outlinedabove, it was necessary to recognize, as in any measurement program,that the results have some degree of tolerance. Therefore, an estimateof this degree of accuracy of the data was required to give a reasonableassurance that the desired results would be achieved. In the performancecostevaluation, it was readily apparent that such an estimate was neededto intelligently select the optimum <strong>antenna</strong> configuration.Throughout the collection of model data, continued improvementwas made in measurement techniques, analysis procedures, andconsequently, in the accuracy of the resulting information. Consideringthe various factors involved, the probable errors for the various basicmeasurements were regarded as within the following tolerances:Effective height plus or minus 2%Static capacitance plus or minus 1%Resonant frequency plus or minus 1%It was necessary, therefore, that these tolerances be appliedto the basic curves in order to provide a sufficient margin of safety toassure the probability that the end results would meet the requirements.In addition to the above parameters predicted directly frommeasurements, the resulting effect on the pertinent parameter of bandwidthwas also evaluated. Since bandwidth is proportional to the squareof the effective height and the first power of capacitance, it follows thatthe tolerance for the predicted bandwidth is approximately plus or minus5 per cent.3-4
Departures from measurements or derived information, inaccordance with the tolerances above, must be recognized. Throughoutthe study, the conservative approach with regard to tolerances wasobviously followed in order to assure the greatest probability of compliancewith the specified operation.If3-5
TABLE 3 -1BASIC ANTENNA PARAMETERSSINGLE MODIFIED CUTLER ANTENNAFrom model measurements -converted to full scale values4-wire cage downleadsEffective Static ResonantAspect Height Capacitance FrequencyRatio ft. (microfarads) kc0.7 483 .1609 34.60.85 551 .1541 3Z.91.00 632 .148o 31.51.20 694 .1455 29.71.40 751 .145J 28.5
In--- 9-----III'p______ ______ ______ U)IHo o o.';'o o o0 ifl 0 a 0I- I'- - Z:j 1 In '4- 1- [4'3 1f9.I-iii IA" I U)ridI'II /%I / [4U)U___ __ '7- ___1'II /-'I--- /I///___ -o_____I//'I/ /kctI1//I [4/ HI,,//II/ 61/ __'I,1//I- 4 -A -Nat tE Nen ry c'- 9 vs,aw r'vos'
4. BASIS FOR STRUCTURAL ANALYSIS4.1 GeneralThis preliminary <strong>design</strong> effort was confined to the inner rowof towers (B towers). To estimate cost of the A and C towers and counterweighttowers, it was assumed that the relationship between the costs ofthese various towers was in accordance with those previously derivedfrom cost estimates set forth in Ref. 1. The previous studies of Ref. 1demonstrated that tubular towers for supporting the top hat system areessentially identical in cost to their framed counter-parts; consequently,the further studies of Ref. 2 and this investigation also, considered tubulartowers to take advantage of a large saving in <strong>design</strong> time. The materialconsidered was A-7 steel throughout.4.2 Towers4.2. 1 Aspect Ratio StudyThe compressed time scale available for the preliminary<strong>design</strong> of 18 towers completely eliminated the possibility of any computationrefinement, computer based or otherwise, and dictated the use ofnumerous simplifications. These simplifications were chosen sotoprovide, as far as possible, uniformity in the degree of optimization foreach tower-f'op hat system. One such simplification was to make allheight increments between guy levels proportional to those of the B towerof Ref. 2, (hereafter <strong>design</strong>ated as the reference tower). In addition, thedeflection pattern for each tower <strong>design</strong> was assumed to be proportionalto that of the reference tower, and the tower shaft diameters were variedfrom 6.5 feet to 9.0 feet depending on height.Tower loading conditions assumed for each study wereas outlined in Appendix H of Ref. 1.Pulloff loads from the top hat wereobtained by extrapolatiors of previous data.4-1
The approximate method of tower analysis utilized theassumed deflection curve previously described and consisted of thefollowing steps:(a)Fixed-end moments derived from the wind,top hat pulloffs, and assumed deflected shape,were distributed in the conventional mannerto obtain end moments.(b)(c)Cross-sectional areas of the guys at anylevel relative to those of the referencetower, were assumed to be proportional tothe simple beam wind reaction.Axial thrust increments due to guy tension ateach guy level were assumed to include thevertical component of initial tension plus thevertical component induced by the simplebeam reaction. These were combined withthe vertical component of the top hat pulloff andthe tower dead load to give the total axial thrustat any given level.(d)Wall thicknesses, based on the assumed use ofA-7 steel, were selected according to thecriteria of Ref. 1.Tower anchor blocks were sized on the basis of the simple beamreactions at each guy level relative to those of the reference tower. Thesize of the footing under each tower was proportioned on the basis of axialthrust at the base relative to that of the reference tower.4.2.2 Effect of Varying Cantilever Projection and Halyard TypeThis portion of the investigation studied the effect ofvarying the height of the cantilever sections above the top guy level on towers4-2
having a similitude ratio of 1. 0 and an aspect ratio nominally equal to unity,and using both sloping and vertical halyard systems. For both halyardsystems, cantilever projections of 10, 30, and 57 feet were investigated,10 feet being considered an approximation of a practical minimum, and57 feet being the projection used in Ref. 2. The influence of cantileverprojection and the effect of type of halyard (sloping vs. vertical), on theelectronic characteristics, required different total heights for each tower.For this reason, the towers with 10 foot cantilevers were higher thanthose having 30 or 57 foot cantilevers, and towers with sloping halyardswere higher than those with vertical halyards. The analysis procedure,as in the case of the aspect ratio study, was based on maintaing a towerdeflection pattern proportional to that of the reference tower. However, -themethod of analysis of each tower was somewhat more refined than that usedin the aspect ratio study in that it was possible in this instance to utilizeguy data made available from the computer program (GLAD) in all calculations.After assuming a deflection curve for the tower under wind, guysizes were selected so as to result in a deflection consistent with thedeflection pattern assumed. End moments were then computed by themethod of balancing angle changes described in Ref. 1, in a simplifiedversion which neglected the somewhat minor influences of guy couples andaxial thrust. Thereafter, reactions and deflections were computed ateach guy level and the computed deflections were then compared againstthose assumed, for purposes of detecting significant variations from theassumed shape of the deflection curve. The remaining analysis paralleledthat of the aspect ratio study, except that tower axial thrust and footingand anchor block <strong>design</strong> utilized the computer-derived data previouslymentioned.4.2.3 Fixed Halyard StudyThe effect of using fixed (non-counterweighted) halyardswas studied for the case of a similitude ratio of 1. 0 and a nominal aspect4-3
having a similitude ratio of 1. 0 and an aspect ratio nominally equal to unity,and using both sloping and vertical halyard systems. For both halyardsystems, cantilever projections of 10, 30, and 57 feet were investigated,10 feet being considered an approximation of a practical minimum, and57 feet being the projection used in Ref. 2. The influence of cantileverprojection and the effect of type of halyard (sloping vs. vertical), on theelectronic characteristics, required different total heights for each tower.For this reason, the towers with 10 foot cantilevers were higher thanthose having 30 or 57 foot cantilevers, and towers with sloping halyardswere higher than those with vertical halyards. The analysis procedure,as in the case of the aspect ratio study, was based on maintaing a towerdeflection pattern proportional to that of the reference tower. However, themethod of analysis of each tower was somewhat more refined than that usedin the aspect ratio study in that it was possible in this instance to utilizeguy data made available from the computer program (GLAD) in all calculations.After assuming a deflection curve for the tower under wind, guysizes were selected so as to result in a deflection consistent with thedeflection pattern assumed. End moments were then computed by themethod of balancing angle changes described in Ref. 1, in a simplifiedversion which neglected the somewhat minor influences of guy couples andaxial thrust. Thereafter, reactions and deflections were computed ateach guy level and the computed deflections were then compared againstthose assumed, for purposes of detecting significant variations from theassumed shape of the deflection curve. The remaining analysis paralleledthat of the aspect ratio study, except that tower axial thrust and footingand anchor block <strong>design</strong> utilized the computer-derived data previouslymentioned.4.2.3 Fixed Halyard StudyThe effect of using fixed (non-counterweighted) halyardswas studied for the case of a sin.ilitude ratio of 1. 0 and a nominal aspect4-3
atio of 1.0, adjusted electronically to compensate for the increased tophat sag required for a non-counterweighted system. The approach usedwas identical to that described in the preceding section.4.3 Top Hat4. 3. 1 Aspect Ratio StudyThe load case selected for the top hat study was windparallel to the catenary. The conductor size (1-1/8" Alumoweld)selected for the study of the single modified Cutler <strong>antenna</strong> system,(Ref. 2), was used throughout this investigation. A constant proportionof sag to span was maintained for all similitude ratios. Pulloffs,conductor tensions, and counterweight requirements were assumed to beproportional to the total wind load acting on the top hat. To determinethe variation of counterweight tower and counterweight cost with changesin aspect and similitude ratios, a rough trial <strong>design</strong> was made based onthe combination of these two parameters which yielded an extreme maximum.The change in cost from that of the counterweight and counterweight towerof Ref. 2 was not a large percentage of the total cost of the <strong>antenna</strong> system;consequently, the interpolation used to determine cost for other aspectand similitude ratios involved only minor error.4.3.2 Effect of Halyard TypeHalyards and top hat conductor tensions for a given towerheight and spacing are essentially independent of the type of halyard systemused (sloping or vertical). This fact enabled determination of tower pulloffsfor either system based on this assumption.4. 3. 3 Fixed Halyard StudyThe possibility of eliminating counterweights had beenexplored previously (Ref. 8), (based on a similitude ratio of 1.0 and4-4
a nominal aspect ratio of 1. 0), with results tending to indicate reasonablepulloffs and potential savings in cost. A subsequent study by the JointVenture substantiated the approach used and the results obtained.An important consideration, in the case of the fixed halyardsystem, is whether there is a detrimental redistribution of wind shearbetween the various towers under overload wind conditions. To resolvethis question the top hat of Ref. 8 was further studied on the premise ofa wind velocity about 30% greater than that used in the study of Ref. 8.In adapting the fixed halyard concept of Ref. 8 to the requirementsof the <strong>antenna</strong> configuration study, the plan dimensions of thepanels were maintained; however, certain alterations became necessaryto provide consistency, from an electronic standpoint. These adjustmentsconsisted of increasing the tower heights to provide the necessary averagetop hat elevation, and changing of wires sizes from the 1-inch diameterassumed in Ref. 8 to the 1-1/8-inch diameter assumed throughout the<strong>antenna</strong> configuration study. This latter change required an estimateof the resulting increased pulloff.4-5
5. SUMMARY OF RESULTS5. 1 GeneralThe results of the several studies conducted in arriving at the<strong>antenna</strong> configuration selected for recommendation are presented and discussedbelow. The results include those of the resonant frequency studiesmade on the scale model and the effect of the coupling circuitry in derivingthe system operating frequency from the <strong>antenna</strong> resonance. Results alsoinclude the electronic, structural and cost considerations related to theselection of aspect ratio and similitude scale factor and also the considerationsrelated to the recommended halyard-cantilever-compensation combination.Information concerned with the fixed halyard system, which was actuallydeveloped after the basic <strong>antenna</strong> configuration was selected, is also includedfor completeness.5.2 Resonant Frequency StudiesIn pursuing means of increasing the resonant frequency of the<strong>antenna</strong>, studies were made of this and other pertinent electrical characteristicsof the 1.28 Cutler <strong>antenna</strong> with several variations of downlead configuration.Basically, the variations were in the shape of the downlead from thestandpoints of the location of the hinge point, the location of the point of attachmentto the top hat, and the configuration of the vertical portion of thedownlead (i. e., the cage or fan version). The results of some twelve tests,plus two supplemental measurements, are given in Table 5-1. Figures 5-1,5-2, 5-3 and 5-4 illustrate the various configurations studied, and showpertinent dimensions and downlead arrangements. While shown on Table 5-1,test results are also included on the figures for ready reference.Tests 1 and 9 (Figure 5-1) of the test series represent the'rl. 28" version of the <strong>antenna</strong> system (with vertical halyards, 10-foot cantilever,45-foot B-tower compensation) and yield an <strong>antenna</strong> resonant frequencyof approximately 31. 5 kc. Test Z (also Figure 5-1) maintainedthe same attachment point at the <strong>antenna</strong> top hat, but reduced the length5-I
of the 4-wire cage downlead by virtually eliminating the hinge point. Whilethis reduced the downlead length, it also resulted in a smaller averagediameter for the "cage" composed of the six vertical downleads around theC tower. The increased inductance resulting from the reduced overalldownlead diameter apparently overrides the reduced inductance of theshortened length and effects a reduction in resonant -frequency.Tests 3, 4 and 5 (Figure 5-2) were made with the attachment pointat the top hat moved out by some 200 feet beyond the original radius. ForTest 5, a 4-wire cage downlead, essentially vertical from the top hat attachmentpoint to the hinge point, and a more or less horizontal run to the helixhouse, a gain of approximately 0.7 kc was achieved. Again, however, thevirtual elimination of the hinge point by routing the downlead directly fromthe top hat attachment point to the helix house attachment point (Test 3)reduced the resonant frequency as it did in the case of the original top hatattachment point radius. In Test 4, with a hinge point intermediate betweenthose of Tests 3 and 5, a slightly higher resonant frequency was achieved,but at a lesser bandwidth than for Test 3.A third basic approach to the problem of increasing the resonantfrequency was made by substituting a fan arrangement for the 4-wire cageon the vertical portion of the downlead (Tests 6-8, 10-12; Figures 5-1, 5-3 ,5-4). Both 4- and 8-wire versions of the fan were studied, not only for thenormal point of attachment to the top hat but also for one at an additional200 feet from the C tower. Depending on the radius of the point of attachmentto the top hat, gains from about 1. 8 to 2. 7 kc were made with the8-wire fan configurations, as compared to otherwise similar 4-wire cageversions.Test 12 was similar to the basic PER configuration with the 4-wirecage, except that a 4-wire fan was used and the hinge point was slightlyfarther from the C tower than the attachment point of the top hat, rather5-2
than slightly nearer the C tower as in Test 11. This arrangement yieldeda slight increase in resonant frequency over Test 11, but not quite asgreat as Test 10 where an 8-wire fan was used. Considering that theresonant frequency for the Test 12 configuration would have beenincreased slightly if an 8-wire fan had been used, it is estimated that suchmodified Test 12 configuration would have characteristics quite similarto those of Test 10. Test 10 also had a very slight advantage in bandwidthcharacteristics.Tests Ila and hlb were supplemental checks made using thesame basic configuration as Test 11. Test 1 la added the strain insulatorand pulloff halyard at each of the six hinge points, but showed essentiallyno different result from corresponding Test 11, where the hinge pointswere positioned by non-conductors.Test llb showed the effects of a significant capacitive shunt at thehelix house. As anticipated, the measured static capacitance at the basewas increased and the apparent effective height decreased. The bandwidth,as derived from equations based on simple equivalent circuits,actually showed a slight increase with the added capacitance. A morerigorous representation of the equivalent circuit, however, would probablyshow a slight loss, rather than a gain, in bandwidth. Of particular significancehere, however, is the fact that there was no indicated change inresonant frequency of the system.For structural reasons, it was considered undesirable to increasethe radius to the attachment point on the top hat. Therefore, for theadditional studies, and as the basis for selection, the results of Test 10were adopted for the further analysis. At some time after the selection,further structural considerations gave preference to the Test 12 configurationmodified to an 8-wire fan. This change, however, introduced nosignificant differences in predicted performance from that of the originallyselected configuration.5-3
5.3 Coupling Circuitry EffectsIn a very simple form (Figure 5-5), a VLF <strong>antenna</strong> may berepresented as a simple series circuit composed of inductance, capacitanceand resistance, where the inductance is that of the top hat and downleads,the capacitance is the static capacitance of the system, and the resistanceis composed of radiation resistance and losq resistances representingthose of the ground system, <strong>antenna</strong> conductors, dielectrics and otherlosses reflected into the system from towers, guys, and other structuresin the surrounding area. As frequency is increased, a point is reachedat which the reactance of the apparent inductance in the system is equal tothe reactance of the static capacitance. This is the frequency which hasbeen termed "<strong>antenna</strong> resonant frequency.The resistance in the system is relatively low, even at thehigher end of the nominal operating frequency range. The output impedanceof the transmitter is, by comparison, relatively high. Toefficiently couple the transmitter to the <strong>antenna</strong>, a relatively low-lossimpedance-matching circuit (Figure 5-5) composed of a coupling inductorand a tuning inductor, which allows the complete system to be resonatedat various frequencies throughout the desired operating range, is employed.As indicated in Appendix A showing a sample calculation ofcoupling circuitry <strong>design</strong>, a certain reactance is required in the couplinginductor to properly match between the generator and load resistances.For a given frequency, this value is fixed for a given combination ofgenerator and load resistances. The inclusion of this added inductancein the circuit results in an overall resonant frequency below that of the<strong>antenna</strong> system itself. In practice the minimum normal inductanceadjustment of the tuning inductor must be somewhat greater than zero,even at the highest frequency of operation, so that some variation ispossible for tuning the <strong>antenna</strong> to a particular frequency and for following5-4
equired inductance variations as the <strong>antenna</strong> characteristics vary slightlywith temperature, wind, etc. In addition, the inductance of connectingbusses must be included in the maximum operating frequency determination.In estimating the extent of the change from <strong>antenna</strong> resonantfrequency to maximum operating frequency, the coupling inductance asrequired by the generator and load resistances, was used as a base. Thetotal of the other inductances in the circuit, including the tuning inductorand the various busses, was assumed to equal that of the coupling inductance.On the basis of several calculations following the simplified<strong>antenna</strong> circuit concept and the coupling circuit element philosophy outlinedabove, it was shown that the upper operating frequency before requiring acapacitive element, was approximately 10 per cent lower than the <strong>antenna</strong>resonant frequency.5.4 Aspect Ratio Studies5.4. 1 GeneralResults of the aspect ratio studies were developedin the areas of electronic performance and structural costs. These elementswere then combined into a performance-cost display wvhich wasused in selecting the recommended <strong>antenna</strong> configuration.5.4. Z Electronic Performance FactorsAs pointed out above, the basic experimentaldata of the aspect ratio studies was developed in the PER phase and issummarized in Table 3-1 and Fig. 3-1 of this <strong>report</strong>. Figure 3-1 is anexpanded plot of the predicted <strong>antenna</strong> parameters as a function of aspectratio in the area of primary interest and for a similitude scale factorof 1. 0. In developing the further information for use in performanceevaluation, data taken from the smooth curves of Figure 3- 1 was usedas a base. Similitude scaling was then applied to this data to cover abroadrange of <strong>antenna</strong> sizes, resulting in Figs. 5-6, 5-7 and 5-8 which show,5-5
espectively, the primary parameters of bandwidth, resonant frequency andtop hat voltage, each as a function of scale factor and for the selected valuesof aspect ratio of 0.7, .85, 1.0, 1.Z and 1.4.The bandwidth figures were based on the effectiveheight and capacitance data from Fig. 3-1 and are the predicted characteristicsat 15.5 kc.The basic effective height and capacitance data fromFig. 3-1, along with the required radiation of 1 megawatt at 15.5 kc,resulted in the required top hat voltage values shown in Fig. 5-8. Theseveral values were derived for particular aspect ratios and were scaled,by similitude, to cover other sizes in accordance with the following laws:ParameterPower Law3Bandwidth (at a given frequency)sResonant frequency s"1Top hat voltage (at a given frequencyand radiated power)sIt will be noted from the three figures that, as indicatedby the laws above, the resulting curves are straight lines as plottedon the log-log paper.Included on each of the three figures are the valuesof the particular parameters as predicted from the PER.Since the primary consideration in the aspect ratiostudy was the determination of combinations of aspect ratio and scalefactor yielding an increase in <strong>antenna</strong> bandwidth (at 100 percent <strong>antenna</strong>efficiency and 15. 5 kc) for a given cost, data from the several curvesabove was combined into a composite, Fig. 5-9, in which bandwidth isplotted as a function of aspect ratio for various values of scale factor.Superimposed on these curves are the resonant frequencies correspondingto various combinations of scale factor and aspect ratio, and a constantcost line as developed in a later section and corresponding to the PERcost estimate for the <strong>antenna</strong> system.5-6
The performance information is based on themeasured model data and interpolation from the derived curves with similitudescaling adjustments. No measurement tolerances were consideredin the preparation of Fig. 5-9. The reference <strong>antenna</strong> configuration, asdenoted by the point a = 1, s = 1, is that of the PER, except for the use ofvertical halyards and a 10-foot cantilever with 45-foot B tower compensation.Five guy levels were used and the PER 4-wire cage downlead configurationwas followed.If the <strong>antenna</strong> were to be considered alone and notolerances applied to the measurements, it may, for example, be seen fromFig. 5-9 that a bandwidth of approximately 40 cycles could be achieved witha resonant frequency of 30 kc for the same cost as the PER estimate. Thisconfiguration would have an aspect ratio of approximately 0. 90 and a scalefactor of 1.08. However, in practically evaluating <strong>antenna</strong> performance,the effect of the coupling circuitry on the upper limit of operating frequencyof the system (without resorting to the use of series tuning capacitors)must be considered as well as the measurement tolerances. Over therange of a and s values of interest, it was estimated, as discussed above,that inclusion of the effects of the required coupling circuitry would resultin an operating frequency approximately 10 per cent less than that of the<strong>antenna</strong> resonant frequency.It is obvious, then, that application of the couplingcircuitry effect alone will require that an <strong>antenna</strong> resonant frequency ofsome 33 kc be achieved to permit system operation up to 30 kc. FromFig. 5-9, it may be noted that such an increase in required <strong>antenna</strong>resonant frequency results in a sizeable decrease in the <strong>antenna</strong> bandwidthto well below the desired value of 37.5 cycles if the PER cost estimate isnot to be exceeded.5-7
Under the revised maximum operating frequency of28. 5 kc permitted by the Navy, and the assumption that there will be a 10per cent effect from the coupling circuitry, it may be seen that a minimum<strong>antenna</strong> resonant frequency of 31.67 kc (28.5/. 90) is required, withoutregard for bandwidth or <strong>antenna</strong> resonant frequency tolerances. FromFig. 5-9 it is obvious that there is no combination of a and s values which,for this resonant frequency of 31.67 kc, will yield a bandwidth capabilityof 37.5 cycles, particularly within the PER cost estimate.This serious problem of resonant frequency was, ofcourse, recognized in the PERP studies and, as <strong>report</strong>ed in earlier sections,steps were taken under the final <strong>design</strong> model effort to find means of increasingthe <strong>antenna</strong> resonant frequency. As discussed above, the configurationwhich offered the greatest promise electronically, and was considered structurallyreasonable was Test 10 (or later, Test 12, modified to an 8-wire fan)of the resonant frequency study series. This configuration substituted a fanof eight wires for the vertical portion of each of the six 4-wire cage downleadsfrom the <strong>antenna</strong>. The hinge point location and the attachment pointto the top hat were virtually the same as those proposed in the PER. Themeasured resonant frequency with the fan configuration at an aspect ratioof 1.0 was 33.27 kc, which may be compared to the value of 31.43 kc for the4-wire cage as derived from the resonant frequency curve on Fig. 3-1 atunity aspect ratio.Considering this gain, percentage-wise, from thechange to the fan-type downlead, the estimated 10 per cent coupling circuiteffect, and the one per cent resonant frequency tolerance, it was computed(Appendix B) that an <strong>antenna</strong> resonant frequency of 30.5 kc at an aspectratio of unity on the basic coordinate system of Fig. 5-9 would yield amaximum system operating frequency of 28. 5 kc for the 8-wire fanconfiguration. Correspondingly, an <strong>antenna</strong> resonant frequency of 30.2kcon the basic coordinate system is required if the coupling circuit effect is9 per cent.5-8
At other than unity aspect ratio the required <strong>antenna</strong>resonant frequency on the basic coordinate system would follow the 30.5 kc(or 30.2 kc) line if the variation of this parameter for the 8-wire fan wereassumed to follow that for the 4-wire cage. However, since no modelmeasurements of this variation with aspect ratio were made for the 8-wirefan, the validity of such an assumption could not be assured.An alternate estimate of resonant frequency variationwith aspect ratio for the 8-wire fan assumed that the total inductancein the <strong>antenna</strong> circuit was composed of a fixed and a variable inductancewith the variable portion assumed proportional to the length of the verticalsection of the downlead. Following this premise, a reasonable correlationwith measured data was obtained for the 4-wire cage downlead for whichmodel measurements had been made at several aspect ratios. Extendingthe concept to the fan-type downleads and extrapolating from the singlemeasured point at unity aspect ratio, it was found that the gain inresonant frequency for the fan relative to the cage-type downleads was notas great at the lower aspect ratios as it was at unity. It was apparent,however, that there would always be some gain regardless of aspect ratio.In applying the above principle to the 8-wire fanconfiguration, it was assumed that the increase in resonant frequency at anaspect ratio of 0.7 was only one-half the increase at unity aspect ratio.Based on this assumed aspect ratio function for the 8-wire fan, the estimatedone per cent resonant frequency measurement tolerance and the10 per cent coupling circuitry effect, the limiting <strong>antenna</strong> resonant frequencyto achieve a 28.5 kc system operating frequency over a range ofaspect ratios is shown on Fig. 5-10. The curve is superimposed on thebasic coordinate system and bandwidth performance curves of Fig. 5-9.5-9
5.4.3 Cost Factors and Other ConsiderationsTo evaluate the relative costs of the basic VLF<strong>antenna</strong> configuration at various aspect ratios and scale factors, some 18combinations of these factors were considered in accordance with theanalysis bases outlined in Paragraph 4. These estimates considered thecosts of the towers, top hat, counterweight system, hoists and certainother principal items of the facility for each of the combinations. The costestimates include only those items of the facility which have a significanteffect on cost differences and do not include items whose costs remainessentially constant regardless of the tower heights and <strong>antenna</strong> spans.Consequently, the total cost figures, which are summarized in Appendix C,do not reflect the total costs of the facility.Of primary importance in the aspect ratio study arethe cost differences between the several total costs developed in Table C-Iof Appendix C and the cost of comparable portions of the PER single modified(1.28) Cutler <strong>antenna</strong>. The cost difference information from Table C-1and Fig. C-1 of Appendix C is presented in several forms. Figure 5-11shows combinations of aspect ratios and scale factors for several selected<strong>antenna</strong> cost differences. Figures 5-12, and 5-13 plot cost differences asfunctions of scale factor and aspect ratios, respectively. The zero costdifference line shown on the performance-cost curves, Figs. 5-9 and5- 10, was derived from the basic information developed above.The cost differences incurred in achieving certainelectronic performance characteristics have been developed for variouscombinations of aspect ratio and scale factor. These relationships arepresented in the form of several curves, Figs. 5-14 through 5-16.Figure 5-14 shows the cost difference as a functionof bandwidth, with cost increasing with bandwidth for any given aspect ratioor scale factor. This trend is to be expected since increase of either factortends to increase the overall size of the <strong>antenna</strong>.5-10
Figure 5-15 relates cost difference to resonant frequency.Since higher resonant frequencies are associated with smaller<strong>antenna</strong>s, either by reduced aspect ratio or scale factors, costs decreasewith increasing resonant frequencies, as shown by the curves.Figure 5-16 indicates decreasing costs with increasingtop hat voltage for constant values of either aspect ratio or scale factor.This again follows the expected trend as smaller <strong>antenna</strong>s tend to requirehigher top hat voltages for a given radiated power at a given frequency.To show the variation of top hat insulator loads forvarious combinations of aspect ratio and scale factor, Fig. 5-17 wasdeveloped. This information was used primarily to show practical limitsof loads rather than cost differences which were not developed since theinsulator tension was a result of various aspect ratios and scale factorsrather than a cause.5.5 Halyard-Cantilever -Compensation Studies5. 5. 1 Electronic Performance FactorsThe basic electronic data and background informationof the halyard-cantilever-compensation studies were developed under ChangeOrder F to the PER contract and were <strong>report</strong>ed in the model study data<strong>report</strong> of 22 November 1961 (Ref. 3). The study showed that a series ofequivalent parameters can be determined for comparable <strong>antenna</strong> performance.The B tower height compensations relative to pureI. Z8 scaling of the Cutler configuration and based on an effective height of633 feet and a bandwidth of 35. 4 cycles are shown in Table 5-2 for bothvertical and sloping halyards. For example, it may be seen from the tablethat for sloping halyards, a 56-foot cantilever with a 55-foot B-towercompensation yields the same performance by either the effective height or5-11
andwidth criteria as the vertical halyard arrangement with a 10-foot cantileverand a 45-foot compensation. To be on the conservative side, the greaterrequired compensation for each condition, as shown by the underlining inTable 5-2, was used in the cost comparison of the several combinations.5. 5. 2 Cost Factors and Other ConsiderationsThe cost aspects of the halyard-cantilever-compensationstudies are summarized in Table 5-3. All the results apply to a scalefactor of 1. 0 and a nominal aspect ratio of 1. 0, with the height of the B towercompensated to yield essentially equivalent electronic performance withvariations in halyard slope and cantilever projection as shown in Table 5-2.The first column of Table 5-3 reproduces cost data for the single modifiedCutler tower system which was previously developed in Supplement 1 to thePER (Ref. 2). Some of the implications from the data shown are as follows:a. A combination of sloping halyards and cantileverprojection creates favorable bending moments at the top ofthe tower. The minimum cost shown, which corresponds tothe 30-foot cantilever projection, indicates that for thesloping halyard combination, there is an optimum projectionbetween 10 and 57 feet which is probably in the range of30 feet.b. The main towers of the sloping halyard systemare less costly than those of the vertical halyard systembecause of the smaller pulloff, but the counterweight towersfor the sloping halyard system are more expensive becauseof the less favorable structural conditions created by thesloping halyard.5-12
c. The increased amount of grounding and roads requiredwhen sloping halyards are used, creates a small butsignificant cost penalty against this type of system.d. The cheapest counterweighted combination usessloping halyards and a 30-foot cantilever. However, thevertical halyard combination with a 10-foot cantilever is onlyslightly more expensive (0.4%).It is not possible to estimatecost to within a fraction of a per cent; consequently, it mustbe assumed that for all practical purposes, the costs of thesetwo tower configurations are essentially identical. Underthese circumstances, the greater mechanical simplicity ofthe vertical halyard system is a point in its favor.e. Column 7 shows the results of the analysis of thetower using a sloping halyard without counterweights (fixedhalyard). This tower has a cantilever overhang of 57 feet.It is to be noted that the total cost of the A, B and C towersin this case is somewhat greater than that of the referencetowers shown in Column 1. This is attributable largely to asomewhat greater pulloff and to the slightly greater towerheight required to compensate for increased sag. However,this cost trend is reversed by the elimination of counterweighttowers, resulting in an estimating saving of over oneand a half million dollars (about 10. 8% below the cost of thetower system of Column 1), assuming that features performingthe function of the deleted counterweights do not have tobe added. Using this assumption, it is apparent that the twocheapest configurations would be (1) a system utilizingsloping, fixed halyards and a cantilever projection of about5-13
30 feet, and (2) a system utilizing vertical, fixed halyardsand a cantilever projection of 10 feet.5.6 Fixed Halyard SystemFigure 5-18 shows results of the top hat analysis by the JointVenture for the case of fixed halyards under service wind conditions. Theseresults agree closely with those of Ref. 8. Figure 5-19 shows results forthe overload wind.Similar information, and additional data, are presented inTable 5-4. Relative wind shears, R , and relative horizontal components,yH, of halyard tension, are shown for the counterweighted system of Ref. 2under service wind, and for the fixed halyard system of Ref. 8 under bothservice and overload wind. It is apparent that the windward B tower carriesa considerably greater portion of the wind shear in the case of the fixedhalyard system. Comparison of H values shows that the relative pulloffdistribution is not greatly different between the counterweighted and fixedhalyard systems.The maximum variation occurs at the C tower.A comparison of the data in Columns 3 through 6 shows thatthe windward B tower carries about 12% more of the total wind shear underthe overload condition, (Columns 3 and 5),other towers is relatively unchanged.whereas the distribution at theFairly large changes in pulloff are evident at the A tower andleeward B tower, relative to the pulloff at the windward B tower, when comparingservice and overload conditions (Columns 4 and 6). However, this isonly significant at the A tower, amounting about an 11% increase.5-14
These conditions can be modified within certain limits byadjusting the sags in the catenary and conductor to achieve a more optimumdistribution of the loads acting on the towers.5.7 Assessment of Fixed Halyard SystemImportant considerations in comparing counterweighted andfixed halyard systems are as follows:1. To provide a counterweight system with enough travelto bring the top hat to the ground under wind would require counterweightsand counterweight towers much larger and costly than those used at Cutler.2. A counterweight system with a reduced amount of travelcan be made to function effectively under the <strong>design</strong> wind loading (servicewind) of VLF PAC. However, overload winds not greatly in excess of theservice wind will cause complete payout of the halyard, so that, under overloadconditions, it becomes necessary to consider the top hat, at least inpart, as a fixed halyard system.3. Any system with unlimited payout may not necessarilyprevent portions of the top hat from draping around the guys or shaft of aleeward tower under hurricane winds. The resulting indeterminate loadingcondition may or may not be more severe than the loading associated with afixed halyard system.4. It may be possible and desirable to incorporate fail-safefeatures in a fixed halyard system, achieving relief of halyard tension underoverload similar to that provided by counterweights and independent of payout.Such features might be devices which jettison the top hat directly by tensilerupture or severing of the halyard, or through a torque release on the winchdrum, permitting uncontrolled unwinding. The jettisoning arrangement woulddetach all four corners of a top hat panel simultaneously.5.-15
Another possibility is a controlled unwinding schemethat would utilize a dynamic braking system, and would not necessarilyrequire simultaneous release at each supporting tower.5-16
TEST 2 1~rf TE87' 10 79671/_________TE-sr 2 rcsr 7TEsT f TEssr io nesT/li.P,FEc~crlc/VoHE6A' ho 440' 5381 10421 r.351 34STATC CAPAC/TAMCE C 0 .148 7 .__49_ .149?7 .1574 .150r,RESONANT PREQUENCY fo 30.75 31.50 .91. G8 -;9Z7 30.87BASE R.ACTAA'E ( 1.6kc) Xb -j.2 _0__1_6/ -j5l V61/.7 _______a84AMMVOM/ bw 130.3 3ro. 4 ______ 36.3 312./VERT/CAL WG,17A17T 7o PauL oFF P0/NT7 Top AIA7*-7.4'CENTER L/AIZ 7-QT,9 71 TO P HAT-25'FIG. 5-I RESONANT FREQUENCY TESTSCONFIGURATIONS 1, 2, 9, 10 AND I11
tolSits505' 581'TEs r3 TEST 4- TEST 5TET 3 TEST4 T£ST$EPFFEO/VE EEIGHr h 0 G38' G27' co0'STAUC CAPACITA/CL Co .1499 .1/SIB .1___1RE$SOVA/T" FREQIe. /Cy"Y Po .3..05 32.30 .32.18BASE RE4CT4MCE (15.5 kc)X•b 5/ 6V50 :[4?MAIADWIPTH bw 36.3 3s.e a_33._5VERTICAL. HE/6H/T 7 PULL OFF PO08'7 TOP MAT -914'CGEMTR -lINS TRUSS 7V TOP HAT -26'FIG. 5-2 RESONANT FREQUENCY TESTSCONFIGURATIONS 3, 4 AND 5
tw '2We't 200'TUS6 G r VST7 ;rcST SSTAT/C C44 C/TANACE Co '1530 .7543 .153/RESONA/AATREQL'ENCY fc, 35.10 34S?8 34.478 A SE REA CTAMCE (15 5kc) X I -~j!54. 5 VJ4 9.7 -j 5I.rs4umw/rb bw 37.7 3613 ____._VERTICAL AI-EIGHr 70 PULL OFF P0/MTr TOP /AT7- L714'CHNMER LINE MIL/SS 70 TOP MA7*- 25'FIG. 5-3 RESONANT FREQUENCY TESTSCONFIGURATIONs 6, 7 ANT) 8
N~485'TEST fa TWr Ph L Te 1 ST/Z 05260t1111CA PA C'f OR ACRISISAAITENA/A INP4T 7TERA41MA LTES57W llq, 11b, ý' /2_____________7'95/14 Ila Mrlb T 75S r 12EFFECTIVE H&E/GY ho G3?f' IS351 ______STATIC CAPAC/TAAICE Co ./505 .1554 ._____RECSOMIAAT FREQUENCY( fo 32.87 32.87 33.05S4NDWIDM/ bW 1 .4.7 37.3 3G.1VEAT/CAL WE/GAIT Tro PJLL OFF po/Nr T-OP yAr- 7-41cEMrER LINE MIuSS71 TOP M AT - 25'FIG. 5-4RESONANT FREQUENCY TESTSCONFIGURATIONS Ila, Ilb AND 12
~J*CieZ, t tn9:zt -i~cbfc~1a~~CH Q,LiiICAI-. CKlzz
~R040 /30 I---.75 0.8 0. . 1112 US .;FIG. 5-6 BANDWIDTH AS A FUNCTION OF SCALE FACTOR
s- __-50 - __ __Z) 403_ 0__ _4J ___ __235 %_-7.5 0.8 0.9 0 1. 4SCALE M4Cfl'FIG. 5.-7 RESONANT FREQUENCY AS A FUNCTION OF SCALE FACTOR
300-'260-200-•.76 0.8 .9.0 1.1 4.. /1. 1.3SCA/.E FAC7T0VRFIG. 5-8 TOP HAT VOLTAGE AS A FUNCTION OF SCALE FACTOR
....,,.o ~P/AA 5 '# • 4'L• Y-K.2k/~w ,, . ,,'s" ,,r./.., -4, o4'o 5,- 4,4, "/ __ _t • ""40~~3 4,II 4,-J.0. --------/,. ooo.,/ /•re .70 .76 8 83 .o .% 1o4szo~er RArlo()FIG. 5-9 PREDICTED PERFORMANCE OFSINGLE MODIFIED CUTLER ANTENNAFROM MODEL MEASUREMENTS, 4 - WIRE CAGE DOWNLEADS
RE.R. COST 7 .ESTIMAT45--A *pvj0wýNýý 40,434I-Is-4'4.70~~~ .0.8 .79oLASETopIgFIG.5-10PREDCTEDPERFRMANEOSI GL MODII D CU L R AN E NF M R O D L E A U R M E T S 8 - I R F N O W L A D
1.4%% % %, •%% \t uJ.5 0. 7 0-8 0.4?t~A6PECTr RArTO (77)FIG. 5-11ASPECT RATIO AND SCALE FACTOR COMBINATIONSFOR SPECIFIED ANTENNA COST DIFFERENCES
IFI+4-_74 /¢ ,,,-.¢ 9+200,/I.._o,•-4- -- /17L •.,.Q:~'1,tZjSI/i,00 ,// ;FIG. 5 -1ANTENNA COST DIFFERENCEAS A FUNCTION OF SCALE FACTOR
+45+4-, /,0 S/le-3.100 o0065 0.7 0.8 0.f .0A•pscr" RAr/o (gQ)FIG. 5-13 ANTENNA COST DIFFERENCEAS A FUNCTION OF ASPECT RATIO
111111 111111-- $ ,{----- q- - -- i--ISc -,4- -- .- ;----------- --S. -N44- I _-% z4 .. t 4 0-o4 4 -44.4.5- - -- - ----- - I'J -%. -4- '4'"IU4 -- ';? - -. 4, _ o ----------- 4* -_ -o -4- [44 S-' * V.4 '4')% -4 hin*--- '4--I4 04 -- - --:2:44 5- - -4- - SH-. U)4 5_ 4 4 4 , _ 00 4U)01-4a- . r-.. g '- '. o- oo '- '3 m q- n j .- -. j rv i -.- - ..-. .-.- I I I I(9,,op dO suoyiw) ivo,' ivi';i'ia isot-J
U)000In(S.lv//op 40 .SUql///W) '6*3 rjOY_ 03ON52Y3~'d-4 JSOO
-"0100w * 0- - 400Jo0" - 0 ;" --vo~ to -%Z:--
350-200.75 0.8 0.9 1,0 l 7. 1,8 1.35SCALE FACTORFIG. 5-17INSULATOR TENSION AS A FUNCTION OF SCALE FACTOR
00Krj-IOZ--00
nilw0 -O/0~- 00NONIPk-4xI
TABLE 5-1SUMMARY -RESONANT FREQUENCY TEST DATAMODEL DATA, ADJUSTED TO FULL SCALETest Effective Capacitance Resonant BandwidthNo. Height-Ft. fd Freq. -kc Cycles1 638 .1498 31.50 36.42 640 .1487 30.75 36.33 638 .1499 32.05 36.34 627 .1519 32.30 35.65 600 .1561 32.18 33.56 643 .1530 35.10 37.77 628 .1543 34.98 36.38 635 .1531 34.47 36.89 642 .1497 31.68 36.810 635 .1514 33.27 36.311 634 .1506 32.87 36.1lla 639 .1505 32.87 36.7llb 635 .1554 32.87 37.312 631 .1521 33.05 36.1
TABLE 5-2SUMMARY - CANTILEVER - COMPENSATION STUDIESMODEL DATA, ADJUSTED TO FULL SCALEB-Tower CompensationB-Tower DataCanti-Halyard lever Bandwidth Eff. Ht. Height Top GuyVertical 10 ft. 45 ft. 45 ft. 1165 ft. 1155 ft.30 40 38 1160 113056 30 25 1150 1094Sloping 10 ft. 64 ft. 68 ft. 1188 ft. 1178 ft.30 59 62 1182 115256 55 55 1175 1119Note:Equivalence based on 35.4 cycles bandwidth, or 633 feeteffective height. Compensations used in further analysisare those underlined.
CD o 0 0 0 0o0 0 ýo o cn0 oQ a, - a U) 00 1- -D 000 C) 0 04 C'')~c0 0 0 0 0(14 t10 ent-nNoo0 r 0 0 0n 0I0 0 0 0 004.1 !L- 0 0 aCVa'kc m k ~ m 1 0 .4) -4cH 0 0 00 0 0, 0--4 0l 0l 0ý 0l 0 0 0 0 np- n -40 00 on a' a'4-04~10 0 -' CD -4Fa 0 r- a; a - aDi 4+-ln 0 -4 a -0 Z0 0CD00 0C-4 07 e' (I a'' -4 en CO N 'ar: r';..n -o 'k4 0n a, 03 '0 r- Lf10 ) -40 0 0 00 0. 0 0 0SOD CcI C N rP441 f44 4 .~,0 r:'C0- dcc -00' a' -4 .-- 44~414H) c cr EO '4-3 M14 X4.10-04ZI o '41d 0o 0 0) G '
d r Cy 0 Lf) ifn*-4 c 0~ 0 NP-4)004))4)4)~ 00 C> 0' -4HdLCdUz0(d 0 -0Z~Ir0 U00 0pq)HH > 40~~I I~00CU 41 -0 0)p 4 ~( 'ý z4 ' 0 0 0n .t4)0iu0'40,4.~). >) 4jN 0 0 n 0 C4--4UC)l>4)rd
OTHER ITEMS INCLUDED6.1 Ground System CostOne of the items entering into the overall cost of the radiationsystem is the cost of the ground system. This cost is expected to varywith both aspect ratio and scale factor. A very preliminary estimate of!the variation with these two factors was made for inclusion in the overallcost data for a range of combinations of aspect ratio and scale factor.For a given scale factor, the cost of the ground system may be expectedto decrease with increasing aspect ratio and a constant radiation systemefficiency since an increasing aspect ratio results in a greater effectiveheight and, consequently, higher radiation resistance. The resistance ofthe ground system, therefore, may increase without reducing the efficiencyof the radiation system.For a particular aspect ratio, the resistance of the groundsystem would tend to increase with scale factor for a given efficiencysince the height, and consequently the radiation resistance, increaseswith scale factor, thus reducing the required wire density. This trendover-rides the requirement for increased radial length as a result of tophat size increasing with scale factor.Based on some preliminary studies accomplished in the PERphase, it was found that the major cost of the ground system was relatedto the amount, and therefore the cost, of the No. 6 wire installed. Otherelements of the cost tended to compensate as aspect ratio and scale factorwere varied. Cost variations were, therefore, taken as proportional tothe amount of No. 6 copper wire required and all were referenced to theestimated PER cost ($1, Z6Z, 100) for the ground system La - 1, s - 1).(See Table I of PER Supplement 1.) The curves derived from this verysimple approach are shown in Fig. 6-1.6-1
6.2 Main String InsulatorsIn arriving at costs for various combinations of aspect ratioand similitude factors, primary insulation is a significant consideration.Structural <strong>design</strong>s were aimed at maintaining a maximum insulator loadof approximately 207, 000 pounds, a value which has been achieved inexisting insulator <strong>design</strong>s.Since the mnaximum load was to be essentially the same forall variations of the <strong>antenna</strong> under study, cost differences would be afunction of the number of units required to withstand a given top hatvoltage. The results of tests by Lapp during the Cutler insulator developmentprovide guidance on the variation in the number of insulators in agraded string as a function of voltage. Figure 6.2 illustrates this variation.This information, combined with the top hat voltage curves of Fig. 5.7determined the number of insulators estimated for the various configurationsstudied.6-Z
0_ _ _ _tt~___ _ _t~U*PWaIIrz~EI-r40vU)_ _ __ _ý1_____ U) 09'-'Iif34E-0(~V7OC ~LSOL O .,90/7/P) ~3V~f1$Z
Issýjto126KZ'Rot_ _(3~0 N N(4 4
7. CONCLUSIONS AND RECOMMENDATIONSIn the development of the recommended VLF PAC <strong>antenna</strong> systemon which to base the final <strong>design</strong> effort, a number of areas were investigatedto assure that the selected configuration would have the greatestpotential of meeting the following requirements:a. Capability of radiating 1 megawatt at 15. 5 kc.b. Capability of operating down to 14 kc, but at reducedoutput if necessary.c. Compatible with system operation up to at least 28. 5 kcAwithout the requirement for tuning capacitors.d. An <strong>antenna</strong> bandwidth (at 100 percent efficiency) of atleast 37.5 cycles at 15. 5 kc.e. An estimated cost not to exceed the estimated cost ofthe single modified (1. 28) Cutler <strong>antenna</strong>.Each area of investigation led to certain trends or conclusionswhich were integrated into the configuration recommended as the basefor final detailed <strong>design</strong> development.From the resonant frequency studies it was concluded that theresonant frequency is increased significantly by increasing the averagediameter of the group of downleads, primarily by increasing the radiusfrom the center tower to the attachment point at the top hat and to alesser degree by increasing the radius from the center tower to thelower hinge point.The resonant frequency is also increased by using a fan rather than7-I
a cage for the vertical portion of the downlead, with an 8-wire fanproducing a greater degree of increase than a 4-wire fan.Structural considerations required a compromise with regard to thedownlead attachment position, limiting it to the same relative position asin the Cutler <strong>antenna</strong>. This corresponds to Test 10 of the resonant frequencyseries for the 1. 28 model with unity aspect ratio. Subsequent tothe letter of recommendation (Ref. 5) the configuration of Test 12,modified to an 8-wire fan, was recommended as a substitute to takeadvantage of structural gains without any significant change in electronicperformance. This configuration was adopted in the final <strong>design</strong>.Calculations of the effect of the <strong>antenna</strong> coupling circuitry indicatedthat the system operating frequency would be reduced by about 10 percentbelow the <strong>antenna</strong> resonant frequency. Thus, it was concluded that a 10percent reduction factor would be used in establishing the required <strong>antenna</strong>resonant frequency. Since this reduction jeopardized the desired maximumoperating frequency for practical <strong>antenna</strong> system configurations investigated,and in view of the opposing trends of bandwidth and <strong>antenna</strong> resonantfrequency, the Navy was agreeable to accepting a maximum systemoperating frequency of 28. 5 kc in lieu of the originally contemplated 30 kc.The composite performance curves (Fig. 5-10) developed from theaspect ratio studies and similitude scaling defined a range of configurationspermitting compliance with the required performance and cost limitations.This area is defined (Fig. 5-10) by the region above the 37. 5 kc bandwidthline, below the PER cost estimate line and below the resonant frequencyline "for maximum operating frequency f0M 28. 5 kc. ,r Any point withinthis area meets performance and cost requirements, recognizing the7-2
estimated coupling circuitry factor and the <strong>antenna</strong> resonant frequencytolerance. With the concurrence of the Navy, however, no bandwidthtolerance was included.On the basis of the conclusions above and within the permissiblearea outlined in Fig. 5-10, the selected <strong>antenna</strong> configuration is definedas one with an aspect ratio of 0.925 and a similitude scale factor of 1. 05.These factors are, of course, applied to the basic configuration of asingle section of the Cutler type <strong>antenna</strong>, scaled up by 28 percent fromthe Cutler size.In addition to the basic size recommendation, and as a result of thehalyard-cantilever-compensation studies, it was recommended thatvertical halyards be used, in combination with a 10-foot cantileverprojection. With this configuration the "B" series of towers would beincreased about 45 feet in height to compensate for degradation ofelectronic characteristics.As a result of further analysis, following the establishment of theaspect ratio of 0.925 and the similitude scale factor of 1.05, it wasfurther recommended that counterweighting of top hat halyards be eliminatedin favor of fixed halyards. Each fixed halyard should incorporate anoverload feature permitting payout when the tension exceeds a predeterminedvalue. The fixed halyard system requires a change in sag-span ratiosand tower heights. Therefore, it was recommended that further electronicmodeling be performed to insure compliance with Navy performancerequirements.7-3
APPENDIX AEFFECT OF COUPLING CIRCUITRY ON OPERATING FREQUENCYSample CalculationsAs an example, assume:a - 0.925, s = 1.058-wire fan downleadsGain over 4-wire cage downleads at a = 0.7 isone-half thatata . 1.0No <strong>antenna</strong> parameter tolerances consideredRadiation system efficiency = 80%Operating frequency = 28.5 kc.For these assumptions, the basic <strong>antenna</strong> parameters are:Radiation system resistanceResonant frequencyStatic capacitance0.663 ohms (at 28.5 kc)32.2 kc0. 1620 microfaradsUsing these <strong>antenna</strong> parameters, the apparent inductance of the <strong>antenna</strong>system is 151.4 microhenries.Assuming a transmitter output impedance of 12.5 ohms and the load resistanceof 0.663 ohms, the required coupling impedance is:X mR xR fTT12.5x 0.663 = 2.88 ohmsWhere RgRe= source resistance= load resistanceAssuming an operating frequency of 28.5 kc the required coupling inductance is:2.88Lc 2- 16. 1 rmicrohenries2 T x 28.5 x I0 3 A-i
In addition to the inductance required in the shunt coupling inductor, it isestimated that an equal inductance is reasonable for inclusion in the seriesvariometer to provide for tuning adjustments under various environmentalconditions (e. g. , wind) and to provide some tuning tolerance to meet finalradiation system parameters.The total inductance in the system is then:Lant = 151.4 MicrohenriesLcpig16.1 MicrohenriesLvar16.1 Microhenries183.6 MicrohenriesUsing the <strong>antenna</strong> capacitance noted above, the operating frequency is:f-1 1f o - -Z T[ 5 ZTI'183.6 x10- 6 x.1Z 0I1Tx.16202x70foZ9.1 kcThis represents a decrease from resonant frequency to operating frequency of3. 1 kc or 9.63 percent.A-Z
APPENDIX BCOMPOSITE PERFORMANCE CURVES AND TOLERANCESThe following are sample calculations showing derivations of the variouslimit curves for Figures 5-9 and 5-10 based on tolerances outlined inParagraph 3.4.Let fx Antenna system resonant frequency, withimprovements from downlead changes(i.e., 8-wire fan downleads).frAntenna system resonant frequency from basicaspect ratio tests (i.e. , 4-wire cage downleads).fo = System operating frequency (28. 5 kc specifiedminimum upper limit).Define coupling circuit factor, denoting the reduction from <strong>antenna</strong> resonantfrequency due to the effects of the coupling circuitry, as:fckc f-Define downlead factor, denoting the gain in <strong>antenna</strong> system resonant frequencyachieved by change of downleads (e.g., from 4-wire cage to8-wire fan), as:kdf-kf -B-1
Then, for a measurement tolerance of zero:fokfcxf fx "- k.dfr dfrTherefore, f = kckdfror, f rfckkdThis allows the base curves, Figure 5-9, showing bandwidth versus aspectratio for various values of scale factor and superimposed by <strong>antenna</strong> resonantfrequency to be used for determining performance characteristics, takinginto account the effects of coupling circuitry and different downleads.example, assume:ForOperating frequency, f 0 28. 5 kcoCoupling circuit factor, k : 0.90cDownlead factor, k d 1. 058The downlead factor above is cited as an example of changing from the 4-wirecage downlead with a resonant frequency of 31.43 kc to the 8-wire fan with adownlead resonant frequency of 33.27 kc.The resonant frequency on thebase curves, Figure 5-9, at a . I,, to meet the 28.5 kc operating frequencyis therefore:f r 0 28.5 29.9 kcc k c 0.90 x 1.058B-2
When data is subject to tolerances, these must also be taken into accountin locating the equivalent points and curves on the base coordinate system.In deriving revised locations for Figure 5-10, it was assumed that eachpiece of resonant frequency data was correct to plus or minus I per cent, i.e.:f + 1%x x -f? f + 1%r r -Under these conditions, and referenced to the base curves, usingtolerances on the conservative side yields:-f' f - 1% • 99fk'd = x x +_- x -. 98kdSf + 1% .1Olfr r rThe 28. 5 kc operating frequency limit may then be found at a = 1. 0 asfollows, assuming a 10 per cent reduction in <strong>antenna</strong> system operating frequencydue to coupling circuitry effect and a one per cent resonant frequencytolerance:ff =o 0 28.5 30.5 kcr k k' .90x .98x 1.058Assuming, as above, an aspect ratio function for the fan the same as thatfor the cage, the 28. 5 kc operating frequency limit line would followthe 30. 5 kc resonant frequency line on the base coordinate system (or the30.2 kc line for a 9 per cent coupling circuit effect).If, however, it is assumed that the gain in resonant frequency of the 8-wirefan over the 4-wire cage decreases linearly to one-half as great at a = 0.7as at a = 1. 0, then the equivalent resonant frequency point for the 8-wirefan on the base coordinate of Figure 5-9 is found as follows:B-3
Ata• 0.7, kd = 1.058/ - 1.029then k'd a 0.98 kd = 0.98 x 1.029As before, k - 0.98CThe equivalent resonant frequency, f' r at a . 0.7 is therefore:f0 - 28.5 - 31.4 kcr k k' .90 x .98 x 1.0 2 9c dPoints for other values of aspect ratio are found similarly, using a linearrelationship for gain between 0. 5 and 1. 9 as a varies from 0.7 to 1. 0.B-4
APPENDIX CCOST ESTIMATESTable C-1 summarizes the cost estimates and cost differences fromthe single modified Cutler <strong>antenna</strong> (Ref. 2) for each of the 18 combinationsof aspect ratios and scale factors investigated as a part of this study.The cost estimates summarized in Table C-1 represent only thoseparts of the facility whose costs vary with changes in tower heights and<strong>antenna</strong> spans. Other items whose costs are not significantly effectedby the tower height-<strong>antenna</strong> span variations are not included.Figure C-i.The information shown in Table C-1 is depicted graphically inC-1
so4,*-- 2_ _ , -, 420- -,4--.- Al-125-/0Z7 0,8$C..ALE40q 1.O /.I /31.5F=AC7'O9FICT. C-1 ANTENNA COST AS A FUNCTION OF SCALE FcAC TIOR
00Lf 00 0 0 0 0 0 0 0 0 0tnt 000000t-00004000 V-0I 0000ý na 700 Co en % N 0 c1 0 44 n f r- N 0 -% .n Iv) ~t--4 en (7, 4NC4) ýoN N -4D e') 1-4 U)00 Sgo 0000001ol00 vN0ý n000000(0vr '40000 0-L 0O \0 o N0o- o o nNC% o o - o )N o oooo N- f d010 t - a, f 0L) NC d - :C t; ra t-:NLr 4 -4 -4 -46p-4 6- 6RCD 00 00 0 0 00 0 0 0D0 0 00~ 0~ ~ O Na-W 'o~ N 110es4 tl.. C 0. -4 '4 N n 4n e r- N N -400 -400 0 00 0 0 0 0 0000 0 0Dý -N 000000f) 0-h Cn(100L -0 001 00000-40000 0 M 0* f N r- 4 ee N N 0-4 f cfen j t-4o9 4- 44M W9 00~ F-l 4t ' N -4 ' -4 N f0((A -4' (A 0. m~-z-4ý 4-4 444 ~ ~ 0 ~ ra"0 r-' N~fr-DP40 444J 00 Ho0E A U00 0 o 4J Cd t -o~~ ~ oId~~ oz ld 4.014 JD o b (. , 4 ( 0 0Z i, ., qt 0 04 o d04) u0 00 0 00 p ;.4 0 *ý 0
CLn 00 0 0 000 0 0 0 0 0 0It 0% -4 m m m N r- 0 0 (44 Mfl- n m 4QN 4Ct- % 0 No a, N a, -N 0 N N-4O - 0 NN)00 000000000000000000000 0r- - N N0% INUL) N N ý4LON Cq -4 C'--L* ~ n r-1 -4 -1 ' 40'4-4 -N 0' 00 00 0 00000 000 ,0m 00000 O 0U) 0 '0 0 ' '0 t C ' 0 l ý ttO'0f ýc; lýLýc'-c; *'fl; co;to 3 I 'D00 14 - e 0 ,C N 0 cn(: 1 ' .1 fN 141 ODL) 4e 0' een en on N' 0 -- M-f N - '-4ia, 0LcNo 000000000000000000000o 0 0*~ -~ - -4 - -0 -- - -N0 C4 N0* P* 14*0f D 000000000 00000000000O 0 00o o o oo o o oo D o 0C o 0c 0e~ N0co00 0'00 "0-400c'0r4vN4 o N n vNN0oo0L A0-Lno Y)q r)~ i, -II it ýc 0 n'N" m 0 M(10 r 0N V r -4 Nt-Cf) 00-4 $N0 a, .4N 0N N'0 ýoe -4 0+4* 4404*00P42 HHU) )H4H0) 0 4ý0p~ r.k nU)U a04ý H0O00 0 0 0 4J
5U m000o04 Zc0660000 (7 N00 -000 1 0 0 0a0 It w -4wM' - - "C%% -NMOD--In tý N nNONN I- N a, - n N-4I%a CO N - 4 ,44030 0~ OE 00000000000000000000 0 0O0 0 0 Olt 0 00 0 -rCot- 0 000 q o L 0 V0 . N- , - O -7 fý 0N C; ; e; 1' ; C; C; C IIt . -F 1 - 14 f 4'0' 'N ~ ~ 0 ~ i 0 N - 0' 000 0 0"D-'V 4N0, -4 N nN- N - n)N 9-4 00 0 000m 00M000 000 00M 0 MU P ' N ca 044 0- .- N0 00 000 000 000 0000 00to 0' ~ 0 EC0~ N Cb4' 4- - 4-:1 p4ý0 00 05~,.C1 0 wC boO W 0IO00 Ow 0ILI ý,IO .0(d 9vE-4 4 J du -fP F0
- l n1 .4wt ýC-n0ý00- 000 M00n0 N000 N m0fn 00000 0- 0N m 1- -4 aa y 4C nN N L0 N 00ne~~ 00 tm - I+000C 00o%00M00 00 N0 V00r0 -10000-0t00 0f l 0-r)~Nl ov '-Oovmar-4o a' esNo r cc u cc)0 0 0 0 0 0 0 0 0 0 0 0 0' 0U. o -o r ot -f ' o -' ýc- oN;aH La -4 '--4-~ ~ ~ 0 0 aa 4aa a aaa4a ar. r. ::cr'j - U)-4.14 .Nr-I 05404-J 4z0 4" o o -44N~~ ~ 0ý 14 4 k- '' > zzX44b~ ~ ~ 04w0..4j 14 ) d 4-4- 40 4 d C -
REFERENCES1. Feasibility Study and Preliminary Engineering Report, VLF CommunicationFacilities, Pacific - Contract No. NBy-37598. May 1961by Joint Venture, Developmental Engineering Corporation, andHolmes & Narver, Inc., Engineers.2. Feasibility Study and Preliminary Engineering Report, VLF CommunicationFacilities, Pacific - Supplement 1 Single Modified CutlerAntenna and VLF Antenna Comparisons, Contract No. NBy-37598.July 1961 by Joint Venture, Deco Electronics, Inc. , and HolmesNarver, Inc., Engineers.3. Feasibility Study and Preliminary Engineering Report, VLF CommunicationFacilities, Pacific - Single Modified Cutler AntennaModel Study Data, Contract No. NBy-37598, Change Order F,2Z November 1961 by Joint Venture, Deco Electronics, Inc., andHolmes & Narver, Inc., Engineers.4. Feasibility Study and Preliminary Engineering Report, VLF CommunicationFacilities, Pacific - Single Modified Cutler AntennaAspect Ratio Study, Contract No. NBy-37598, Change Order F,6 December 1961 by Joint Venture, Deco Electronics, Inc., andHolmes & Narver, Inc., Engineers.5. Letter, dated 7 February 1962, HNCD to Officer-in-Charge, reVLF Pacific Antenna Selection.6. Letter, dated 20 February 1962, Serial 238, Officer-in-Charge toHNCD re Contract NBy-37636, Final Plans and Specifications forVLF Pacific; VLF Antenna Final Design.
7. Model Studies of the VLF PAC Antenna - U.S. Navy VLF-COMMFAC-PAC, Contract NBy-37 6 3 6 , 12 April 1963 by HNCD, A Joint Venture,Los Angeles, California, Holmes & Narver, Inc., ContinentalElectronics Manufacturing Company, Deco Electronics, Inc.8. Memorandum from E.G. Odley to ROICC VLF Pacific, 11 December1961, Subject: VLF Communication Facility, Pacific; FeasibilityStudy Concerning Elimination of Counterweight System.41,