w 109 long-run economic aspects of the european union's eastern ...
w 109 long-run economic aspects of the european union's eastern ...
w 109 long-run economic aspects of the european union's eastern ...

Create successful ePaper yourself
Turn your PDF publications into a flip-book with our unique Google optimized e-Paper software.
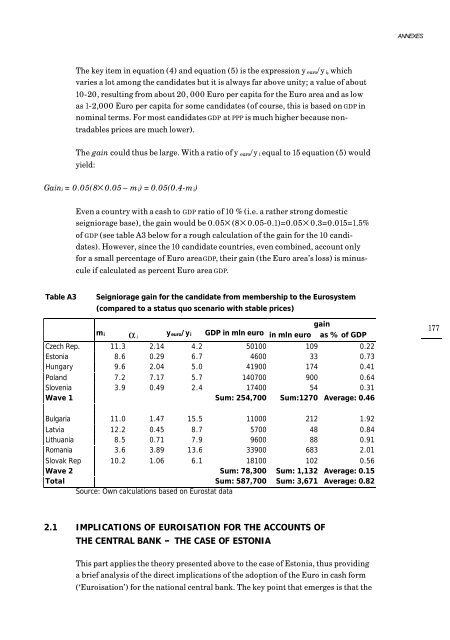
ANNEXESThe key item in equation (4) and equation (5) is <strong>the</strong> expression y euro/y i, whichvaries a lot among <strong>the</strong> candidates but it is always far above unity; a value <strong>of</strong> about10-20, resulting from about 20, 000 Euro per capita for <strong>the</strong> Euro area and as lowas 1-2,000 Euro per capita for some candidates (<strong>of</strong> course, this is based on GDP innominal terms. For most candidates GDP at PPP is much higher because nontradablesprices are much lower).The gain could thus be large. With a ratio <strong>of</strong> y euro/y i equal to 15 equation (5) wouldyield:Gaini = 0.05(8× 0.05 – m i) = 0.05(0.4-m i)Even a country with a cash to GDP ratio <strong>of</strong> 10 % (i.e. a ra<strong>the</strong>r strong domesticseigniorage base), <strong>the</strong> gain would be 0.05× (8× 0.05-0.1)=0.05× 0.3=0.015=1.5%<strong>of</strong> GDP (see table A3 below for a rough calculation <strong>of</strong> <strong>the</strong> gain for <strong>the</strong> 10 candidates).However, since <strong>the</strong> 10 candidate countries, even combined, account onlyfor a small percentage <strong>of</strong> Euro area GDP, <strong>the</strong>ir gain (<strong>the</strong> Euro area’s loss) is minusculeif calculated as percent Euro area GDP.Table A3Seigniorage gain for <strong>the</strong> candidate from membership to <strong>the</strong> Eurosystem(compared to a status quo scenario with stable prices)gainm ia iy euro/y i GDP in mln euro in mln euro as % <strong>of</strong> GDP177Czech Rep. 11.3 2.14 4.2 50100 <strong>109</strong> 0.22Estonia 8.6 0.29 6.7 4600 33 0.73Hungary 9.6 2.04 5.0 41900 174 0.41Poland 7.2 7.17 5.7 140700 900 0.64Slovenia 3.9 0.49 2.4 17400 54 0.31Wave 1 Sum: 254,700 Sum:1270 Average: 0.46Bulgaria 11.0 1.47 15.5 11000 212 1.92Latvia 12.2 0.45 8.7 5700 48 0.84Lithuania 8.5 0.71 7.9 9600 88 0.91Romania 3.6 3.89 13.6 33900 683 2.01Slovak Rep 10.2 1.06 6.1 18100 102 0.56Wave 2 Sum: 78,300 Sum: 1,132 Average: 0.15Total Sum: 587,700 Sum: 3,671 Average: 0.82Source: Own calculations based on Eurostat data2.1 IMPLICATIONS OF EUROISATION FOR THE ACCOUNTS OFTHE CENTRAL BANK – THE CASE OF ESTONIAThis part applies <strong>the</strong> <strong>the</strong>ory presented above to <strong>the</strong> case <strong>of</strong> Estonia, thus providinga brief analysis <strong>of</strong> <strong>the</strong> direct implications <strong>of</strong> <strong>the</strong> adoption <strong>of</strong> <strong>the</strong> Euro in cash form(‘Euroisation’) for <strong>the</strong> national central bank. The key point that emerges is that <strong>the</strong>