- Page 1:
WORKING DOCUMENTS W 109LONG-RUN ECO
- Page 5 and 6:
CONTENTSCONTENTSPreface 3Summary 91
- Page 7:
CONTENTSAnnexes1 The Balassa-Samuel
- Page 10 and 11:
LONG-RUN ECONOMIC ASPECTS OF THE EU
- Page 12 and 13:
LONG-RUN ECONOMIC ASPECTS OF THE EU
- Page 15 and 16:
INTRODUCTION1 INTRODUCTIONThe Europ
- Page 17 and 18:
INTRODUCTION4 To what extent do the
- Page 19 and 20:
INTRODUCTIONefficiency-based (first
- Page 21 and 22:
INTRODUCTIONThe exercise is not so
- Page 23 and 24:
INTRODUCTIONsome suggestions to min
- Page 25 and 26:
PROBLEMS OF ACCESSION TO THE INTERN
- Page 27 and 28:
PROBLEMS OF ACCESSION TO THE INTERN
- Page 29 and 30:
PROBLEMS OF ACCESSION TO THE INTERN
- Page 31 and 32:
PROBLEMS OF ACCESSION TO THE INTERN
- Page 33 and 34:
PROBLEMS OF ACCESSION TO THE INTERN
- Page 35 and 36:
PROBLEMS OF ACCESSION TO THE INTERN
- Page 37 and 38:
PROBLEMS OF ACCESSION TO THE INTERN
- Page 39 and 40:
PROBLEMS OF ACCESSION TO THE INTERN
- Page 41 and 42:
PROBLEMS OF ACCESSION TO THE INTERN
- Page 43 and 44:
PROBLEMS OF ACCESSION TO THE INTERN
- Page 45 and 46:
PROBLEMS OF ACCESSION TO THE INTERN
- Page 47 and 48:
PROBLEMS OF ACCESSION TO THE INTERN
- Page 49 and 50:
PROBLEMS OF ACCESSION TO THE INTERN
- Page 51 and 52:
PROBLEMS OF ACCESSION TO THE INTERN
- Page 53 and 54:
PROBLEMS OF ACCESSION TO THE INTERN
- Page 55 and 56:
PROBLEMS OF ACCESSION TO THE INTERN
- Page 57:
PROBLEMS OF ACCESSION TO THE INTERN
- Page 60 and 61:
LONG-RUN ECONOMIC ASPECTS OF THE EU
- Page 62 and 63:
LONG-RUN ECONOMIC ASPECTS OF THE EU
- Page 64 and 65:
LONG-RUN ECONOMIC ASPECTS OF THE EU
- Page 66 and 67:
LONG-RUN ECONOMIC ASPECTS OF THE EU
- Page 68 and 69:
LONG-RUN ECONOMIC ASPECTS OF THE EU
- Page 70 and 71:
LONG-RUN ECONOMIC ASPECTS OF THE EU
- Page 72 and 73:
LONG-RUN ECONOMIC ASPECTS OF THE EU
- Page 74 and 75:
LONG-RUN ECONOMIC ASPECTS OF THE EU
- Page 76 and 77:
LONG-RUN ECONOMIC ASPECTS OF THE EU
- Page 78 and 79:
LONG-RUN ECONOMIC ASPECTS OF THE EU
- Page 80 and 81:
LONG-RUN ECONOMIC ASPECTS OF THE EU
- Page 82 and 83:
LONG-RUN ECONOMIC ASPECTS OF THE EU
- Page 84 and 85:
LONG-RUN ECONOMIC ASPECTS OF THE EU
- Page 86 and 87:
LONG-RUN ECONOMIC ASPECTS OF THE EU
- Page 89 and 90:
A SOUND AND DYNAMIC ECONOMIC UNION5
- Page 91 and 92:
A SOUND AND DYNAMIC ECONOMIC UNION5
- Page 93 and 94:
A SOUND AND DYNAMIC ECONOMIC UNIONc
- Page 95 and 96:
A SOUND AND DYNAMIC ECONOMIC UNIONW
- Page 97 and 98:
A SOUND AND DYNAMIC ECONOMIC UNION
- Page 99 and 100:
EMU, EURO AND ENLARGEMENT6 EMU, THE
- Page 101 and 102:
EMU, EURO AND ENLARGEMENTTable 6.1
- Page 103 and 104:
EMU, EURO AND ENLARGEMENTDepositsDe
- Page 105 and 106:
EMU, EURO AND ENLARGEMENTEmployment
- Page 107 and 108:
EMU, EURO AND ENLARGEMENTwhich is s
- Page 109 and 110:
EMU, EURO AND ENLARGEMENT• The sa
- Page 111 and 112:
EMU, EURO AND ENLARGEMENTenues. Mea
- Page 113 and 114:
EMU, EURO AND ENLARGEMENTany ‘cle
- Page 115 and 116:
EMU, EURO AND ENLARGEMENTTable 6.6D
- Page 117 and 118:
EMU, EURO AND ENLARGEMENTDeposit mo
- Page 119 and 120:
EMU, EURO AND ENLARGEMENTIf the ECB
- Page 121 and 122:
EMU, EURO AND ENLARGEMENTBox 6.1The
- Page 123 and 124:
EMU, EURO AND ENLARGEMENTexchange r
- Page 125 and 126:
EMU, EURO AND ENLARGEMENTvariabilit
- Page 127 and 128:
EMU, EURO AND ENLARGEMENTFigure 6.1
- Page 129 and 130:
EMU, EURO AND ENLARGEMENT• The lo
- Page 131 and 132:
EMU, EURO AND ENLARGEMENTwill remai
- Page 133 and 134:
EMU, EURO AND ENLARGEMENTadopting t
- Page 135 and 136:
BUDGETARY TRANSFERS IN AN ENLARGED
- Page 137 and 138:
BUDGETARY TRANSFERS IN AN ENLARGED
- Page 139 and 140:
BUDGETARY TRANSFERS IN AN ENLARGED
- Page 141 and 142:
BUDGETARY TRANSFERS IN AN ENLARGED
- Page 143:
BUDGETARY TRANSFERS IN AN ENLARGED
- Page 146 and 147:
LONG-RUN ECONOMIC ASPECTS OF THE EU
- Page 148 and 149: LONG-RUN ECONOMIC ASPECTS OF THE EU
- Page 150 and 151: LONG-RUN ECONOMIC ASPECTS OF THE EU
- Page 152 and 153: LONG-RUN ECONOMIC ASPECTS OF THE EU
- Page 154 and 155: LONG-RUN ECONOMIC ASPECTS OF THE EU
- Page 157 and 158: LITERATURELITERATUREAlberolo-Ila, E
- Page 159 and 160: LITERATURECommission (1998i) Twenty
- Page 161: LITERATURETornell, A. and A. Velasc
- Page 164 and 165: LONG-RUN ECONOMIC ASPECTS OF THE EU
- Page 166 and 167: LONG-RUN ECONOMIC ASPECTS OF THE EU
- Page 168 and 169: LONG-RUN ECONOMIC ASPECTS OF THE EU
- Page 170 and 171: LONG-RUN ECONOMIC ASPECTS OF THE EU
- Page 172 and 173: LONG-RUN ECONOMIC ASPECTS OF THE EU
- Page 175 and 176: ANNEXESANNEX 2WHY IT PAYS TO JOIN T
- Page 177 and 178: ANNEXESThe key item in equation (4)
- Page 179 and 180: ANNEXEScommon reserve pool of the E
- Page 181 and 182: ANNEXESThe day Estonia joins EMU th
- Page 183 and 184: ANNEXESANNEX 3THE VARIABILITY OF TH
- Page 185 and 186: ANNEXESTable A4Correlation coeffici
- Page 187 and 188: ANNEXESVariability of relative CPIM
- Page 189 and 190: ANNEXESANNEX 4AVERAGE FARM NET VALU
- Page 191 and 192: ANNEXESANNEX 5EU BUDGET 1997 COMPAR
- Page 193 and 194: ANNEXESTable A10Estimated expenditu
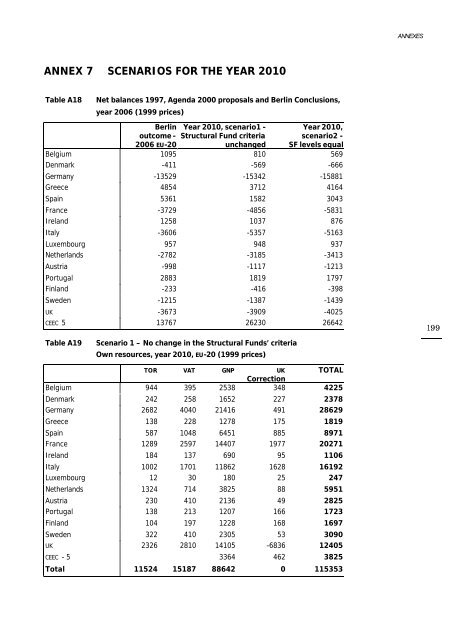
- Page 195 and 196: ANNEXESANNEX 6 EFFECTS OF THE BERLI
- Page 197: ANNEXESTable A17Estimated expenditu
- Page 201: ANNEXESTable A22 Scenario 2 - Struc
- Page 204 and 205: LONG-RUN ECONOMIC ASPECTS OF THE EU
- Page 206 and 207: LONG-RUN ECONOMIC ASPECTS OF THE EU