dementia estimates and projections: australian states and territories
dementia estimates and projections: australian states and territories
dementia estimates and projections: australian states and territories

You also want an ePaper? Increase the reach of your titles
YUMPU automatically turns print PDFs into web optimized ePapers that Google loves.
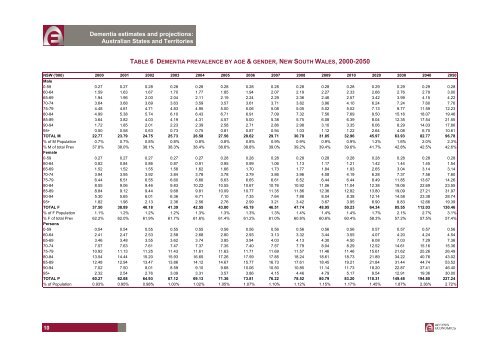
Dementia <strong>estimates</strong> <strong>and</strong> <strong>projections</strong>:Australian States <strong>and</strong> TerritoriesTABLE 6 DEMENTIA PREVALENCE BY AGE & GENDER, NEW SOUTH WALES, 2000-2050NSW ('000) 2000 2001 2002 2003 2004 2005 2006 2007 2008 2009 2010 2020 2030 2040 2050Male0-59 0.27 0.27 0.28 0.28 0.28 0.28 0.28 0.28 0.28 0.28 0.28 0.29 0.29 0.29 0.2860-64 1.59 1.63 1.67 1.70 1.77 1.85 1.94 2.07 2.19 2.27 2.33 2.66 2.76 2.79 3.0065-69 1.94 1.96 2.00 2.04 2.11 2.19 2.24 2.29 2.36 2.46 2.57 3.42 3.99 4.15 4.2270-74 3.64 3.68 3.69 3.63 3.59 3.57 3.61 3.71 3.82 3.96 4.10 6.24 7.24 7.60 7.7675-79 4.48 4.61 4.71 4.83 4.95 5.00 5.06 5.08 5.05 5.02 5.02 7.13 9.77 11.59 12.2380-84 4.99 5.38 5.74 6.10 6.43 6.71 6.91 7.09 7.32 7.56 7.69 9.50 15.16 18.07 19.4685-89 3.64 3.82 4.03 4.19 4.31 4.57 5.00 5.38 5.75 6.08 6.39 8.04 12.35 17.54 21.5590-94 1.72 1.85 2.01 2.23 2.39 2.58 2.71 2.86 2.98 3.10 3.35 6.06 8.29 14.03 17.6695+ 0.50 0.58 0.63 0.73 0.75 0.81 0.87 0.94 1.03 1.12 1.22 2.64 4.08 6.70 10.61TOTAL M 22.77 23.79 24.75 25.73 26.58 27.56 28.62 29.71 30.78 31.85 32.96 45.97 63.93 82.77 96.78% of M Population 0.7% 0.7% 0.8% 0.8% 0.8% 0.8% 0.8% 0.9% 0.9% 0.9% 0.9% 1.2% 1.6% 2.0% 2.3%% M of total Prev 37.8% 38.0% 38.1% 38.3% 38.4% 38.6% 38.8% 39.0% 39.2% 39.4% 39.6% 41.7% 42.8% 42.5% 42.6%Female0-59 0.27 0.27 0.27 0.27 0.27 0.28 0.28 0.28 0.28 0.28 0.28 0.28 0.28 0.28 0.2860-64 0.82 0.84 0.86 0.87 0.91 0.95 0.99 1.06 1.13 1.17 1.21 1.42 1.44 1.45 1.5465-69 1.52 1.52 1.55 1.58 1.62 1.66 1.70 1.73 1.77 1.84 1.93 2.65 3.04 3.14 3.1470-74 3.94 3.95 3.92 3.84 3.78 3.78 3.79 3.86 3.96 4.08 4.19 6.28 7.37 7.56 7.6075-79 6.44 6.51 6.55 6.60 6.66 6.63 6.65 6.61 6.52 6.44 6.44 8.49 11.85 13.67 14.2680-84 8.55 9.06 9.46 9.83 10.22 10.55 10.67 10.76 10.92 11.06 11.04 12.38 19.06 22.69 23.5585-89 8.84 9.12 9.44 9.68 9.81 10.09 10.77 11.35 11.86 12.36 12.82 13.80 19.09 27.21 31.9790-94 5.30 5.65 6.01 6.36 6.71 7.10 7.35 7.64 7.88 8.04 8.38 12.14 14.58 23.38 28.7495+ 1.82 1.96 2.13 2.36 2.56 2.76 2.99 3.21 3.42 3.67 3.95 6.90 8.83 12.66 19.39TOTAL F 37.50 38.89 40.18 41.39 42.55 43.80 45.19 46.51 47.74 48.95 50.23 64.34 85.55 112.03 130.46% of F Population 1.1% 1.2% 1.2% 1.2% 1.3% 1.3% 1.3% 1.3% 1.4% 1.4% 1.4% 1.7% 2.1% 2.7% 3.1%% F of total Prev 62.2% 62.0% 61.9% 61.7% 61.6% 61.4% 61.2% 61.0% 60.8% 60.6% 60.4% 58.3% 57.2% 57.5% 57.4%Persons0-59 0.54 0.54 0.55 0.55 0.55 0.56 0.56 0.56 0.56 0.56 0.56 0.57 0.57 0.57 0.5660-64 2.41 2.47 2.53 2.58 2.68 2.80 2.93 3.13 3.32 3.44 3.55 4.07 4.20 4.24 4.5465-69 3.46 3.48 3.55 3.62 3.74 3.85 3.94 4.03 4.13 4.30 4.50 6.08 7.03 7.29 7.3670-74 7.57 7.63 7.61 7.47 7.37 7.35 7.40 7.57 7.79 8.04 8.29 12.52 14.61 15.16 15.3675-79 10.92 11.13 11.25 11.43 11.61 11.63 11.71 11.69 11.57 11.46 11.46 15.61 21.62 25.26 26.4980-84 13.54 14.44 15.20 15.93 16.65 17.26 17.59 17.85 18.24 18.61 18.73 21.89 34.22 40.76 43.0285-89 12.48 12.94 13.47 13.86 14.12 14.67 15.77 16.73 17.61 18.45 19.21 21.84 31.44 44.74 53.5290-94 7.02 7.50 8.01 8.59 9.10 9.68 10.06 10.50 10.85 11.14 11.73 18.20 22.87 37.41 46.4095+ 2.32 2.54 2.76 3.09 3.31 3.57 3.86 4.15 4.46 4.79 5.17 9.54 12.91 19.36 30.00TOTAL P 60.27 62.68 64.93 67.12 69.13 71.36 73.81 76.22 78.52 80.79 83.20 110.31 149.48 194.80 227.24% of Population 0.93% 0.95% 0.98% 1.00% 1.02% 1.05% 1.07% 1.10% 1.12% 1.15% 1.17% 1.45% 1.87% 2.36% 2.72%10