dementia estimates and projections: australian states and territories
dementia estimates and projections: australian states and territories
dementia estimates and projections: australian states and territories

Create successful ePaper yourself
Turn your PDF publications into a flip-book with our unique Google optimized e-Paper software.
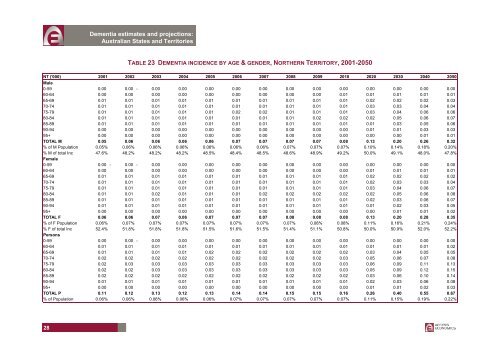
Dementia <strong>estimates</strong> <strong>and</strong> <strong>projections</strong>:Australian States <strong>and</strong> TerritoriesTABLE 23 DEMENTIA INCIDENCE BY AGE & GENDER, NORTHERN TERRITORY, 2001-2050NT ('000) 2001 2002 2003 2004 2005 2006 2007 2008 2009 2010 2020 2030 2040 2050Male0-59 0.00 0.00 - 0.00 0.00 0.00 0.00 0.00 0.00 0.00 0.00 0.00 0.00 0.00 0.0060-64 0.00 0.00 0.00 0.00 0.00 0.00 0.00 0.00 0.00 0.01 0.01 0.01 0.01 0.0165-69 0.01 0.01 0.01 0.01 0.01 0.01 0.01 0.01 0.01 0.01 0.02 0.02 0.02 0.0370-74 0.01 0.01 0.01 0.01 0.01 0.01 0.01 0.01 0.01 0.01 0.03 0.03 0.04 0.0475-79 0.01 0.01 0.01 0.01 0.01 0.02 0.02 0.01 0.01 0.01 0.03 0.04 0.06 0.0680-84 0.01 0.01 0.01 0.01 0.01 0.01 0.01 0.01 0.02 0.02 0.02 0.05 0.06 0.0785-89 0.01 0.01 0.01 0.01 0.01 0.01 0.01 0.01 0.01 0.01 0.01 0.03 0.05 0.0690-94 0.00 0.00 0.00 0.00 0.00 0.00 0.00 0.00 0.00 0.00 0.01 0.01 0.03 0.0395+ 0.00 0.00 0.00 0.00 0.00 0.00 0.00 0.00 0.00 0.00 0.00 0.00 0.01 0.01TOTAL M 0.05 0.06 0.06 0.06 0.06 0.07 0.07 0.07 0.07 0.08 0.13 0.20 0.26 0.32% of M Population 0.05% 0.06% 0.06% 0.06% 0.06% 0.06% 0.06% 0.07% 0.07% 0.07% 0.10% 0.14% 0.18% 0.20%% M of total Inc 47.6% 48.2% 48.2% 48.2% 48.5% 48.4% 48.5% 48.6% 48.9% 49.2% 50.0% 49.1% 48.0% 47.8%Female0-59 0.00 - 0.00 - 0.00 0.00 0.00 0.00 0.00 0.00 0.00 0.00 0.00 0.00 0.00 0.0060-64 0.00 0.00 0.00 0.00 0.00 0.00 0.00 0.00 0.00 0.00 0.01 0.01 0.01 0.0165-69 0.01 0.01 0.01 0.01 0.01 0.01 0.01 0.01 0.01 0.01 0.02 0.02 0.02 0.0270-74 0.01 0.01 0.01 0.01 0.01 0.01 0.01 0.01 0.01 0.01 0.02 0.03 0.03 0.0475-79 0.01 0.01 0.01 0.01 0.01 0.01 0.01 0.01 0.01 0.01 0.03 0.04 0.06 0.0780-84 0.01 0.01 0.02 0.01 0.01 0.01 0.02 0.02 0.02 0.02 0.02 0.05 0.06 0.0885-89 0.01 0.01 0.01 0.01 0.01 0.01 0.01 0.01 0.01 0.01 0.02 0.03 0.06 0.0790-94 0.01 0.01 0.01 0.01 0.01 0.01 0.01 0.01 0.01 0.01 0.01 0.02 0.03 0.0595+ 0.00 0.00 0.00 0.00 0.00 0.00 0.00 0.00 0.00 0.00 0.00 0.01 0.01 0.02TOTAL F 0.06 0.06 0.07 0.06 0.07 0.07 0.07 0.08 0.08 0.08 0.13 0.20 0.28 0.35% of F Population 0.06% 0.07% 0.07% 0.07% 0.07% 0.07% 0.07% 0.07% 0.08% 0.08% 0.11% 0.16% 0.21% 0.24%% F of total Inc 52.4% 51.8% 51.8% 51.8% 51.5% 51.6% 51.5% 51.4% 51.1% 50.8% 50.0% 50.9% 52.0% 52.2%Persons0-59 0.00 0.00 - 0.00 0.00 0.00 0.00 0.00 0.00 0.00 0.00 0.00 0.00 0.00 0.0060-64 0.01 0.01 0.01 0.01 0.01 0.01 0.01 0.01 0.01 0.01 0.01 0.01 0.01 0.0265-69 0.01 0.01 0.01 0.01 0.02 0.02 0.02 0.02 0.02 0.02 0.03 0.04 0.05 0.0570-74 0.02 0.02 0.02 0.02 0.02 0.02 0.02 0.02 0.02 0.03 0.05 0.06 0.07 0.0875-79 0.02 0.03 0.03 0.03 0.03 0.03 0.03 0.03 0.03 0.03 0.06 0.09 0.11 0.1380-84 0.02 0.02 0.03 0.03 0.03 0.03 0.03 0.03 0.03 0.03 0.05 0.09 0.12 0.1585-89 0.02 0.02 0.02 0.02 0.02 0.02 0.02 0.02 0.02 0.02 0.03 0.06 0.10 0.1490-94 0.01 0.01 0.01 0.01 0.01 0.01 0.01 0.01 0.01 0.01 0.02 0.03 0.06 0.0895+ 0.00 0.00 0.00 0.00 0.00 0.00 0.00 0.00 0.00 0.00 0.01 0.01 0.02 0.03TOTAL P 0.11 0.12 0.13 0.12 0.13 0.14 0.14 0.15 0.15 0.16 0.26 0.40 0.55 0.67% of Population 0.06% 0.06% 0.06% 0.06% 0.06% 0.07% 0.07% 0.07% 0.07% 0.07% 0.11% 0.15% 0.19% 0.22%28