dementia estimates and projections: australian states and territories
dementia estimates and projections: australian states and territories
dementia estimates and projections: australian states and territories

You also want an ePaper? Increase the reach of your titles
YUMPU automatically turns print PDFs into web optimized ePapers that Google loves.
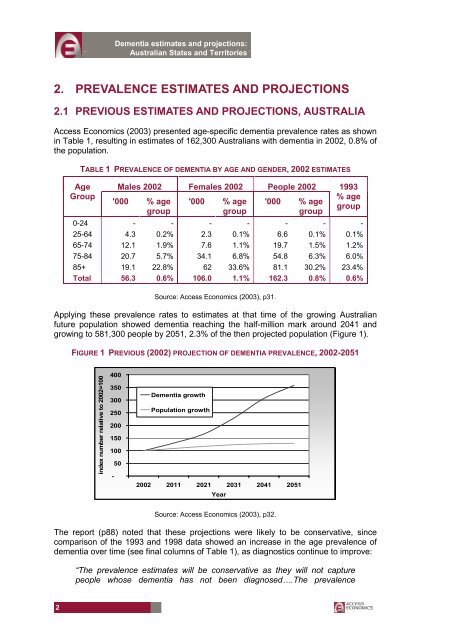
Dementia <strong>estimates</strong> <strong>and</strong> <strong>projections</strong>:Australian States <strong>and</strong> Territories2. PREVALENCE ESTIMATES AND PROJECTIONS2.1 PREVIOUS ESTIMATES AND PROJECTIONS, AUSTRALIAAccess Economics (2003) presented age-specific <strong>dementia</strong> prevalence rates as shownin Table 1, resulting in <strong>estimates</strong> of 162,300 Australians with <strong>dementia</strong> in 2002, 0.8% ofthe population.TABLE 1 PREVALENCE OF DEMENTIA BY AGE AND GENDER, 2002 ESTIMATESAgeGroupMales 2002 Females 2002 People 2002'000 % agegroup'000 % agegroup'000 % agegroup1993% agegroup0-24 - - - - - - -25-64 4.3 0.2% 2.3 0.1% 6.6 0.1% 0.1%65-74 12.1 1.9% 7.6 1.1% 19.7 1.5% 1.2%75-84 20.7 5.7% 34.1 6.8% 54.8 6.3% 6.0%85+ 19.1 22.8% 62 33.6% 81.1 30.2% 23.4%Total 56.3 0.6% 106.0 1.1% 162.3 0.8% 0.6%Source: Access Economics (2003), p31.Applying these prevalence rates to <strong>estimates</strong> at that time of the growing Australianfuture population showed <strong>dementia</strong> reaching the half-million mark around 2041 <strong>and</strong>growing to 581,300 people by 2051, 2.3% of the then projected population (Figure 1).FIGURE 1 PREVIOUS (2002) PROJECTION OF DEMENTIA PREVALENCE, 2002-2051index number relative to 2002=10040035030025020015010050-Dementia growthPopulation growth2002 2011 2021 2031 2041 2051YearSource: Access Economics (2003), p32.The report (p88) noted that these <strong>projections</strong> were likely to be conservative, sincecomparison of the 1993 <strong>and</strong> 1998 data showed an increase in the age prevalence of<strong>dementia</strong> over time (see final columns of Table 1), as diagnostics continue to improve:“The prevalence <strong>estimates</strong> will be conservative as they will not capturepeople whose <strong>dementia</strong> has not been diagnosed….The prevalence2