dementia estimates and projections: australian states and territories
dementia estimates and projections: australian states and territories
dementia estimates and projections: australian states and territories

You also want an ePaper? Increase the reach of your titles
YUMPU automatically turns print PDFs into web optimized ePapers that Google loves.
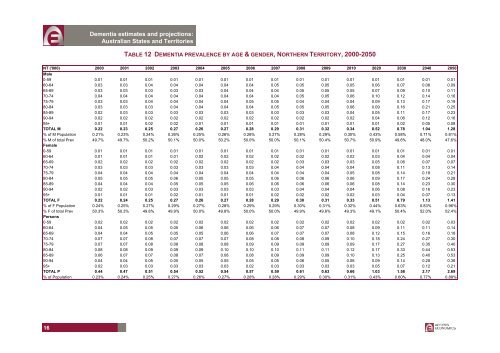
Dementia <strong>estimates</strong> <strong>and</strong> <strong>projections</strong>:Australian States <strong>and</strong> TerritoriesTABLE 12 DEMENTIA PREVALENCE BY AGE & GENDER, NORTHERN TERRITORY, 2000-2050NT ('000) 2000 2001 2002 2003 2004 2005 2006 2007 2008 2009 2010 2020 2030 2040 2050Male0-59 0.01 0.01 0.01 0.01 0.01 0.01 0.01 0.01 0.01 0.01 0.01 0.01 0.01 0.01 0.0160-64 0.03 0.03 0.04 0.04 0.04 0.04 0.04 0.05 0.05 0.05 0.05 0.06 0.07 0.08 0.0965-69 0.03 0.03 0.03 0.03 0.03 0.04 0.04 0.04 0.05 0.05 0.05 0.07 0.09 0.10 0.1170-74 0.04 0.04 0.04 0.04 0.04 0.04 0.04 0.04 0.05 0.05 0.06 0.10 0.12 0.14 0.1675-79 0.03 0.03 0.04 0.04 0.04 0.04 0.05 0.05 0.04 0.04 0.04 0.09 0.13 0.17 0.1980-84 0.03 0.03 0.03 0.04 0.04 0.04 0.04 0.05 0.05 0.05 0.06 0.09 0.16 0.21 0.2585-89 0.02 0.03 0.03 0.03 0.03 0.03 0.03 0.03 0.03 0.03 0.04 0.05 0.11 0.17 0.2390-94 0.02 0.02 0.02 0.02 0.02 0.02 0.02 0.02 0.02 0.02 0.02 0.04 0.06 0.12 0.1695+ 0.01 0.01 0.02 0.02 0.01 0.01 0.01 0.01 0.01 0.01 0.01 0.01 0.02 0.05 0.08TOTAL M 0.22 0.23 0.25 0.27 0.26 0.27 0.28 0.29 0.31 0.32 0.34 0.52 0.78 1.04 1.28% of M Population 0.21% 0.23% 0.24% 0.26% 0.25% 0.26% 0.26% 0.27% 0.28% 0.29% 0.30% 0.43% 0.58% 0.71% 0.81%% M of total Prev 49.7% 49.7% 50.2% 50.1% 50.0% 50.2% 50.0% 50.0% 50.1% 50.4% 50.7% 50.9% 49.6% 48.0% 47.6%Female0-59 0.01 0.01 0.01 0.01 0.01 0.01 0.01 0.01 0.01 0.01 0.01 0.01 0.01 0.01 0.0160-64 0.01 0.01 0.01 0.01 0.02 0.02 0.02 0.02 0.02 0.02 0.02 0.03 0.04 0.04 0.0465-69 0.02 0.02 0.02 0.02 0.02 0.02 0.02 0.02 0.03 0.03 0.03 0.05 0.06 0.07 0.0770-74 0.03 0.03 0.03 0.03 0.03 0.03 0.03 0.04 0.04 0.04 0.04 0.08 0.11 0.13 0.1475-79 0.04 0.04 0.04 0.04 0.04 0.04 0.04 0.04 0.04 0.04 0.05 0.08 0.14 0.18 0.2180-84 0.05 0.05 0.05 0.06 0.05 0.05 0.05 0.06 0.06 0.06 0.06 0.09 0.17 0.24 0.2885-89 0.04 0.04 0.04 0.05 0.05 0.05 0.06 0.06 0.06 0.06 0.06 0.08 0.14 0.23 0.3090-94 0.02 0.02 0.03 0.03 0.03 0.03 0.03 0.03 0.04 0.04 0.04 0.06 0.08 0.16 0.2395+ 0.01 0.01 0.01 0.02 0.01 0.01 0.01 0.02 0.02 0.02 0.02 0.03 0.04 0.07 0.13TOTAL F 0.22 0.24 0.25 0.27 0.26 0.27 0.28 0.29 0.30 0.31 0.33 0.51 0.79 1.13 1.41% of F Population 0.24% 0.25% 0.27% 0.29% 0.27% 0.28% 0.29% 0.29% 0.30% 0.31% 0.32% 0.44% 0.63% 0.83% 0.96%% F of total Prev 50.3% 50.3% 49.8% 49.9% 50.0% 49.8% 50.0% 50.0% 49.9% 49.6% 49.3% 49.1% 50.4% 52.0% 52.4%Persons0-59 0.02 0.02 0.02 0.02 0.02 0.02 0.02 0.02 0.02 0.02 0.02 0.02 0.02 0.02 0.0360-64 0.04 0.05 0.05 0.05 0.06 0.06 0.06 0.06 0.07 0.07 0.08 0.09 0.11 0.11 0.1465-69 0.04 0.04 0.05 0.05 0.05 0.06 0.06 0.07 0.07 0.07 0.08 0.12 0.15 0.16 0.1870-74 0.07 0.07 0.08 0.07 0.07 0.07 0.08 0.08 0.08 0.09 0.10 0.18 0.24 0.27 0.3075-79 0.07 0.07 0.08 0.08 0.08 0.08 0.09 0.09 0.09 0.09 0.09 0.17 0.27 0.35 0.4080-84 0.08 0.08 0.09 0.09 0.09 0.10 0.10 0.10 0.11 0.11 0.12 0.17 0.33 0.44 0.5385-89 0.06 0.07 0.07 0.08 0.07 0.08 0.08 0.09 0.09 0.09 0.10 0.13 0.25 0.40 0.5390-94 0.04 0.04 0.05 0.05 0.05 0.05 0.05 0.05 0.06 0.05 0.06 0.09 0.14 0.28 0.3895+ 0.02 0.03 0.03 0.03 0.03 0.03 0.02 0.03 0.03 0.03 0.03 0.05 0.07 0.12 0.21TOTAL P 0.44 0.47 0.51 0.54 0.52 0.54 0.57 0.59 0.61 0.63 0.66 1.03 1.58 2.17 2.69% of Population 0.23% 0.24% 0.25% 0.27% 0.26% 0.27% 0.28% 0.28% 0.29% 0.30% 0.31% 0.43% 0.60% 0.77% 0.88%16