- Page 1 and 2:
CHAPTER THREEAFFECTED ENVIRONMENT3.
- Page 3 and 4:
The CDCA Plan assigns a “multiple
- Page 5 and 6:
Desert Tortoise Research Natural Ar
- Page 7 and 8:
closure to target shooting. Hunting
- Page 9 and 10:
percentage of public land ownership
- Page 11 and 12:
As of March 2004, BLM had acquired
- Page 13 and 14:
Ripley Joshua Tree Woodland: The st
- Page 15 and 16:
through “resource use” designat
- Page 17 and 18:
Significant Ecological Areas: There
- Page 19 and 20:
Wildlife and Wildflower Sanctuaries
- Page 21 and 22:
Mojave River Forks Regional Park: A
- Page 23 and 24:
oriented commercial uses are expect
- Page 25 and 26:
HCP would include mitigation measur
- Page 27 and 28:
3.1.3.12 City of RidgecrestThe City
- Page 29 and 30:
It is a goal of the town’s genera
- Page 31 and 32:
• Inyo California Towhee (April 1
- Page 33 and 34:
(i) The taking will be incidental;(
- Page 35 and 36:
handled, and number accidentally ki
- Page 37 and 38:
3.1.5 California Endangered Species
- Page 39 and 40:
Obtaining an Incidental Take Permit
- Page 41 and 42:
Monitoring: Monitoring is often the
- Page 43 and 44:
is so restrictive that project dela
- Page 45 and 46:
excess moisture. A minus 4 is consi
- Page 47 and 48:
Air BasinsN190I n y o C o395Ridgecr
- Page 49 and 50:
Federal PM10 Planning AreasN190Owen
- Page 51 and 52:
POLLUTANTOzone (O 3 )RespirablePart
- Page 53 and 54:
AIRBASINAIR QUALITYDISTRICTPOLLUTAN
- Page 55 and 56:
subtraction of transported ozone in
- Page 57 and 58:
The general soil information and ma
- Page 59 and 60:
The Marine Corps Ground Combat Cent
- Page 61 and 62:
The most permeable basin-fill depos
- Page 63 and 64:
Surface water was and is the major
- Page 65 and 66:
A relatively small number of introd
- Page 67 and 68:
freshwater or alkali wetlands, or o
- Page 69 and 70:
3.3.2 Desert Tortoise3.3.2.1 Regula
- Page 71 and 72:
progress toward meeting the overall
- Page 73 and 74:
“higher density” and “lower d
- Page 75 and 76:
several seasons (Esque 1994 in Aver
- Page 77 and 78:
Assistant District Manager Molly Br
- Page 79 and 80:
• Since 1975, federal land manage
- Page 81 and 82:
“52 mi 2 of higher density tortoi
- Page 83 and 84:
1984 Tortoise Range and Density Map
- Page 85 and 86:
Higher Density Tortoise Sign Count
- Page 87 and 88:
When data for the three lowest sign
- Page 89 and 90:
Occurrence of Tortoises Relative to
- Page 91 and 92:
Regional Declines in the Four DWMAs
- Page 93 and 94:
Tortoise Distribution within the Re
- Page 95 and 96:
Boarman (pers. comm., Nov 2002) has
- Page 97 and 98:
tortoises are either extirpated (La
- Page 99 and 100:
sites surveyed by LaRue between 199
- Page 101 and 102:
aseline data are lacking. Grasses p
- Page 103 and 104:
Canine Predators: This includes coy
- Page 105 and 106:
The spatial distribution of 12 of 1
- Page 107 and 108:
Predation Versus Scavenging of Juve
- Page 109 and 110:
Table 3-20Prevalence of Tortoises i
- Page 111 and 112:
(Jacobson et al. 1991, Brown et al.
- Page 113 and 114:
3.3.2.5.3 Older and Newer Die-off R
- Page 115 and 116:
Table 3-21Characteristics of Older
- Page 117 and 118:
Table 3-22Characteristics of Older
- Page 119 and 120:
of the Johnson Valley Open Area, an
- Page 121 and 122:
Distribution of Recreational and Re
- Page 123 and 124:
Tortoises and Burrows Crushed: Vehi
- Page 125 and 126:
TypeYearsSignCount98-99-01Distance2
- Page 127 and 128:
OHV Impacts to Soils: OHV use has r
- Page 129 and 130:
Rodman DWMA. There were no higher d
- Page 131 and 132:
of Dove Springs that has experience
- Page 133 and 134:
Both inside and adjacent to open ar
- Page 135 and 136:
3.3.2.6.6 Organized Competitive OHV
- Page 137 and 138:
3.3.2.7 Current Effectiveness of Ex
- Page 139 and 140:
Overall, one sees that 68% of the 3
- Page 141 and 142:
off regions discussed herein. Black
- Page 143 and 144:
ManixACECMojave fishhookcactusRainb
- Page 145 and 146:
Range of Mohave Ground SquirrelN190
- Page 147 and 148:
3.3.3.2.2 Seasonal ActivityThe MGS
- Page 149 and 150:
1996). As herbaceous annuals appear
- Page 151 and 152:
1998 Mohave Ground Squirrel Transec
- Page 153 and 154: Finally, the 84% success rate was a
- Page 155 and 156: LaRue characterized substrates at t
- Page 157 and 158: There were no MGS occurrences in 28
- Page 159 and 160: certain shrubs (e.g. winterfat) tha
- Page 161 and 162: NAWS China Lake 1993). As discussed
- Page 163 and 164: Cumulatively, one finds there to be
- Page 165 and 166: Citing Bury and Luckenbach (1977),
- Page 167 and 168: the MGS is restricted to about 7,00
- Page 169 and 170: Habitat Management Plans (HMPs) wer
- Page 171 and 172: Basic to the biology of bighorn she
- Page 173 and 174: 3.3.6 Birds3.3.6.1 Bendire’s Thra
- Page 175 and 176: 3.3.6.5 Golden EagleLife History: T
- Page 177 and 178: The towhee recovery plan establishe
- Page 179 and 180: Regulatory Status: Federal Endanger
- Page 181 and 182: 3.3.6.15 Western Yellow-billed Cuck
- Page 183 and 184: Other major threats are flood contr
- Page 185 and 186: Population Status in the Planning A
- Page 187 and 188: on the inaccessible mountain slopes
- Page 189 and 190: 3.3.8.8 Kern BuckwheatLife History:
- Page 191 and 192: Threats Affecting the Mojave Monkey
- Page 193 and 194: 3.3.8.16 Red Rock PoppyLife History
- Page 195 and 196: populations show intergradation wit
- Page 197 and 198: 3.4.1.1 Regional EnvironmentIn tota
- Page 199 and 200: Table 3-37Average Annual Units Cons
- Page 201 and 202: 2002 SOUTHERN CALIFORNIAEMPLOYMENT
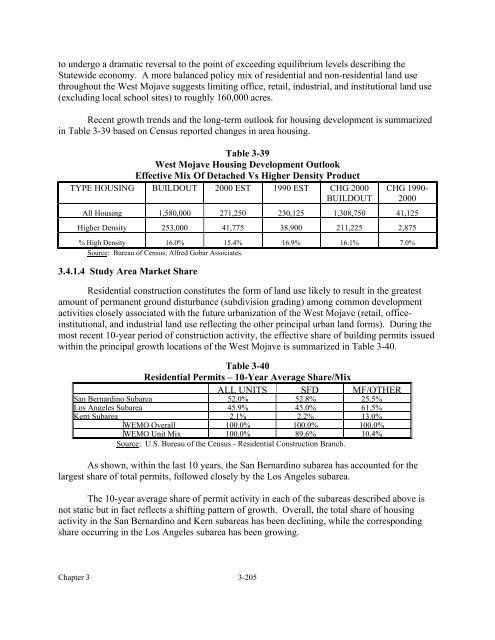
- Page 203: TABLE 3-382000 CENSUS DEMOGRAPHIC C
- Page 207 and 208: 3.4.1.5 Study Area Property Valuati
- Page 209 and 210: The supply of private property in t
- Page 211 and 212: ALLOTMENT NAME TYPE OF LIVESTOCK FO
- Page 213 and 214: Grazing AllotmentsNOlanchaDarwinTun
- Page 215 and 216: ALLOTMENT NAMEALLOTMENTACRESP. L. 1
- Page 217 and 218: 3.4.3 Mineral Potential and Develop
- Page 219 and 220: Mineral Potential, Active and Inact
- Page 221 and 222: Mineral Potential, Active and Inact
- Page 223 and 224: development based on the results of
- Page 225 and 226: MANAGEMENT AREATable 3-46Potential
- Page 227 and 228: A third item, yttrium (on the USBM
- Page 229 and 230: the California Department of Conser
- Page 231 and 232: Table 3-49 shows the number of mini
- Page 233 and 234: produces about 75,000 tons per year
- Page 235 and 236: Table 3-50Most Important Deposits B
- Page 237 and 238: 3.4.3.5 Coolgardie MesaThe Coolgard
- Page 239 and 240: Areas designated as regionally sign
- Page 241 and 242: Recreationists engage in activities
- Page 243 and 244: OPENAREADoveSpringsElMirageJawboneC
- Page 245 and 246: cycle engine motorcycles in OHV rid
- Page 247 and 248: One popular activity is dual sport
- Page 249 and 250: Compliance With Regulations: Compli
- Page 251 and 252: REGIONORCITYRidgecrestSanBernardino
- Page 253 and 254: REGIONORCITYVictorville /AppleValle
- Page 255 and 256:
Rail: The West Mojave planning area
- Page 257 and 258:
Arterials: Arterials are routes wit
- Page 259 and 260:
Ridgecrest-Inyokern Sanitary Landfi
- Page 261 and 262:
approximately 3 miles south of the
- Page 263 and 264:
Trona-Agrus Transfer Station (SWIS
- Page 265 and 266:
The BLM is an agency of the U.S. De
- Page 267 and 268:
Route designations apply only to ro
- Page 269 and 270:
Utility Maintenance: Many powerline
- Page 271 and 272:
ACECNAME ANDNUMBERHarper Dry Lake(3
- Page 273 and 274:
SUBREGIONAmboyBighornCoyoteEastSier
- Page 275 and 276:
• All pipelines with diameters gr
- Page 277 and 278:
3.6.2 Energy Generation PlantsEnerg
- Page 279 and 280:
3.7 CULTURAL RESOURCES3.7.1 Archaeo
- Page 281 and 282:
seasonal movement from place to pla
- Page 283 and 284:
RIDGECREST FIELD OFFICEPROPERTY NAM
- Page 285 and 286:
ACECRose SpringFossil FallsLast Cha
- Page 287 and 288:
have been dated by radiocarbon and
- Page 289 and 290:
MYACENOZOICEPOCHTable 3-65Paleontol
- Page 291 and 292:
In the southern area, fossils of la
- Page 293 and 294:
At Twenty-Nine Palms, there is an u