A 2D CMUT Hydrophone Array: Characterization Results
A 2D CMUT Hydrophone Array: Characterization Results
A 2D CMUT Hydrophone Array: Characterization Results
- No tags were found...

Create successful ePaper yourself
Turn your PDF publications into a flip-book with our unique Google optimized e-Paper software.
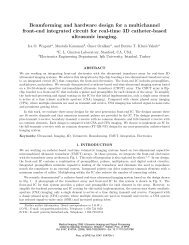
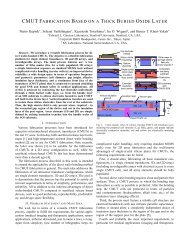
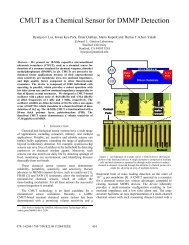
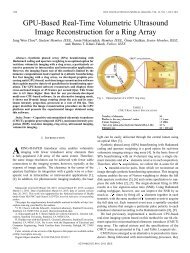
III. RESULTSThe sensitivity of the <strong>CMUT</strong> array can be tuned withchanging DC bias as demonstrated during the calibration. Thetunable sensitivity led to a tunable dynamic range. Themaximum and minimum pressure ranges were set by theamplifier saturation and electronic noise, respectively. Theoutput voltage of the <strong>CMUT</strong> hydrophone saturates due toamplifier saturation in the imaging electronics. By changingthe DC bias the measurable pressure range of the devicechanges (Fig. 3). The sensitivity changed from 1 to 76 μV/Pawith a DC bias ranging from 0.95 to 30.85 V (Fig. 4). Thisarray had a minimum detectable pressure of 1.8 mPa/√Hz atFigure 1. Diagram and picture of hydrophone package.coated device was then bonded to an aluminum plate andhousing. A read out cable was built as well. Fig. 1 shows aschematic of the transducer housing and an optical picture.B. CalibrationThe final preparation was to calibrate the array. Tocalibrate the <strong>CMUT</strong> a 2.25 MHz unfocused ultrasoundtransducer (Model: A306S-SU, Olympus-NDT Inc., Waltham,MA) driven at 1.86 MHz was used as a reference source. Thefrequency of 1.86 MHz was chosen for the application ofcharacterizing megasonic cleaning equipment. The referencesource was then measured with a commercial calibratedhydrophone (Model: <strong>Hydrophone</strong> HNP-0400 Pre-AmplifierAH 2010, Onda Corp., Sunnyvale, CA) at S = 1 to find thepeak pressure output at this distance. The commercialhydrophone gave a mapping of input voltage of the referencesource to the output pressure at S = 1.Next the <strong>CMUT</strong> array was positioned over the samereference source at the same height and the output voltage ofthe <strong>CMUT</strong> was measured. Using a mechanical stage all 256elements in the <strong>CMUT</strong> array were stepped to the same locationabove the reference source. By stepping to the same locationthe output voltage from each element was found for a giveninput pressure to the element. Knowing both values, outputvoltage and input pressure, a calibration look up table could begenerated in units of V/Pa. The raw output voltage was thendivided by the calibration data to produce a calibrated image ofthe acoustic field.To test the calibration the reference source wasmechanically scanned using the commercial hydrophone toobtain a reference beam profile. The mechanically scannedpressure field by the commercial hydrophone and theelectronically scanned pressure field by the <strong>CMUT</strong> array areshown in Fig. 2. The lack of mechanical scanning did increasethe speed of data acquisition. Also, by having no mechanicalscanning there was no disruption of the measurement fluid.Thus another potential error source produced by the motion ofthe hydrophone in the medium was eliminated.Figure 2. Mechanically scanned calibrated image (Top). Electrically scanned<strong>CMUT</strong> hydrophone image (Bottom)