

Spatial and Social Inequalities in Human Development: India in the ...
Spatial and Social Inequalities in Human Development: India in the ...
Spatial and Social Inequalities in Human Development: India in the ...

You also want an ePaper? Increase the reach of your titles
YUMPU automatically turns print PDFs into web optimized ePapers that Google loves.
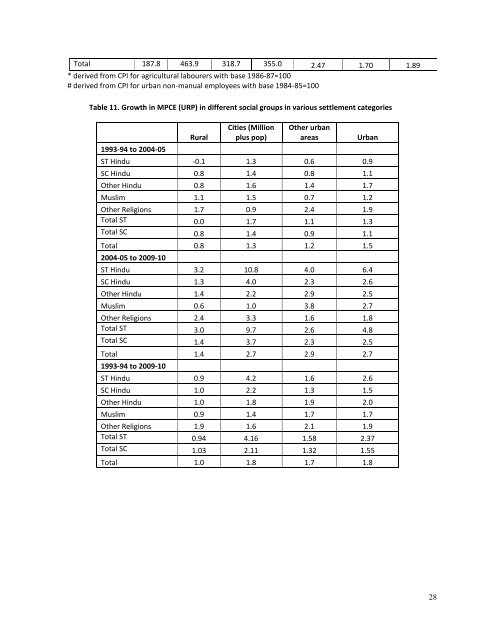
Total 187.8 463.9 318.7 355.0 2.47 1.70 1.89* derived from CPI for agricultural labourers with base 1986-87=100# derived from CPI for urban non-manual employees with base 1984-85=100Table 11. Growth <strong>in</strong> MPCE (URP) <strong>in</strong> different social groups <strong>in</strong> various settlement categories1993-94 to 2004-05RuralCities (Millionplus pop)O<strong>the</strong>r urbanareasUrbanST H<strong>in</strong>du -0.1 1.3 0.6 0.9SC H<strong>in</strong>du 0.8 1.4 0.8 1.1O<strong>the</strong>r H<strong>in</strong>du 0.8 1.6 1.4 1.7Muslim 1.1 1.5 0.7 1.2O<strong>the</strong>r Religions 1.7 0.9 2.4 1.9Total ST 0.0 1.7 1.1 1.3Total SC 0.8 1.4 0.9 1.1Total 0.8 1.3 1.2 1.52004-05 to 2009-10ST H<strong>in</strong>du 3.2 10.8 4.0 6.4SC H<strong>in</strong>du 1.3 4.0 2.3 2.6O<strong>the</strong>r H<strong>in</strong>du 1.4 2.2 2.9 2.5Muslim 0.6 1.0 3.8 2.7O<strong>the</strong>r Religions 2.4 3.3 1.6 1.8Total ST 3.0 9.7 2.6 4.8Total SC 1.4 3.7 2.3 2.5Total 1.4 2.7 2.9 2.71993-94 to 2009-10ST H<strong>in</strong>du 0.9 4.2 1.6 2.6SC H<strong>in</strong>du 1.0 2.2 1.3 1.5O<strong>the</strong>r H<strong>in</strong>du 1.0 1.8 1.9 2.0Muslim 0.9 1.4 1.7 1.7O<strong>the</strong>r Religions 1.9 1.6 2.1 1.9Total ST 0.94 4.16 1.58 2.37Total SC 1.03 2.11 1.32 1.55Total 1.0 1.8 1.7 1.828