

Spatial and Social Inequalities in Human Development: India in the ...
Spatial and Social Inequalities in Human Development: India in the ...
Spatial and Social Inequalities in Human Development: India in the ...

You also want an ePaper? Increase the reach of your titles
YUMPU automatically turns print PDFs into web optimized ePapers that Google loves.
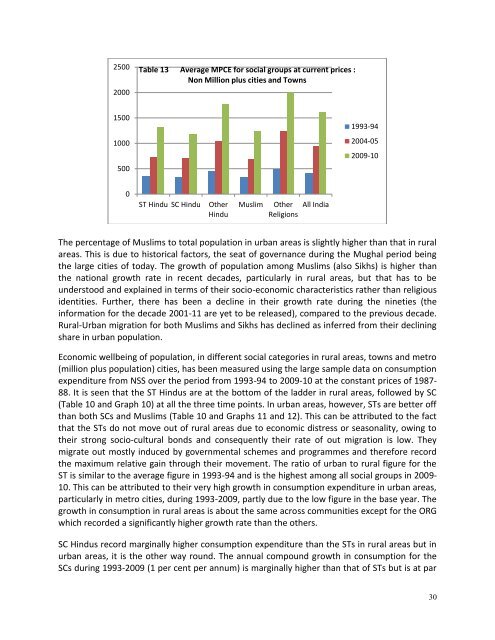
25002000Table 13 Average MPCE for social groups at current prices :Non Million plus cities <strong>and</strong> Towns150010005001993-942004-052009-100ST H<strong>in</strong>du SC H<strong>in</strong>duO<strong>the</strong>rH<strong>in</strong>duMuslimO<strong>the</strong>rReligionsAll <strong>India</strong>The percentage of Muslims to total population <strong>in</strong> urban areas is slightly higher than that <strong>in</strong> ruralareas. This is due to historical factors, <strong>the</strong> seat of governance dur<strong>in</strong>g <strong>the</strong> Mughal period be<strong>in</strong>g<strong>the</strong> large cities of today. The growth of population among Muslims (also Sikhs) is higher than<strong>the</strong> national growth rate <strong>in</strong> recent decades, particularly <strong>in</strong> rural areas, but that has to beunderstood <strong>and</strong> expla<strong>in</strong>ed <strong>in</strong> terms of <strong>the</strong>ir socio-economic characteristics ra<strong>the</strong>r than religiousidentities. Fur<strong>the</strong>r, <strong>the</strong>re has been a decl<strong>in</strong>e <strong>in</strong> <strong>the</strong>ir growth rate dur<strong>in</strong>g <strong>the</strong> n<strong>in</strong>eties (<strong>the</strong><strong>in</strong>formation for <strong>the</strong> decade 2001-11 are yet to be released), compared to <strong>the</strong> previous decade.Rural-Urban migration for both Muslims <strong>and</strong> Sikhs has decl<strong>in</strong>ed as <strong>in</strong>ferred from <strong>the</strong>ir decl<strong>in</strong><strong>in</strong>gshare <strong>in</strong> urban population.Economic wellbe<strong>in</strong>g of population, <strong>in</strong> different social categories <strong>in</strong> rural areas, towns <strong>and</strong> metro(million plus population) cities, has been measured us<strong>in</strong>g <strong>the</strong> large sample data on consumptionexpenditure from NSS over <strong>the</strong> period from 1993-94 to 2009-10 at <strong>the</strong> constant prices of 1987-88. It is seen that <strong>the</strong> ST H<strong>in</strong>dus are at <strong>the</strong> bottom of <strong>the</strong> ladder <strong>in</strong> rural areas, followed by SC(Table 10 <strong>and</strong> Graph 10) at all <strong>the</strong> three time po<strong>in</strong>ts. In urban areas, however, STs are better offthan both SCs <strong>and</strong> Muslims (Table 10 <strong>and</strong> Graphs 11 <strong>and</strong> 12). This can be attributed to <strong>the</strong> factthat <strong>the</strong> STs do not move out of rural areas due to economic distress or seasonality, ow<strong>in</strong>g to<strong>the</strong>ir strong socio-cultural bonds <strong>and</strong> consequently <strong>the</strong>ir rate of out migration is low. Theymigrate out mostly <strong>in</strong>duced by governmental schemes <strong>and</strong> programmes <strong>and</strong> <strong>the</strong>refore record<strong>the</strong> maximum relative ga<strong>in</strong> through <strong>the</strong>ir movement. The ratio of urban to rural figure for <strong>the</strong>ST is similar to <strong>the</strong> average figure <strong>in</strong> 1993-94 <strong>and</strong> is <strong>the</strong> highest among all social groups <strong>in</strong> 2009-10. This can be attributed to <strong>the</strong>ir very high growth <strong>in</strong> consumption expenditure <strong>in</strong> urban areas,particularly <strong>in</strong> metro cities, dur<strong>in</strong>g 1993-2009, partly due to <strong>the</strong> low figure <strong>in</strong> <strong>the</strong> base year. Thegrowth <strong>in</strong> consumption <strong>in</strong> rural areas is about <strong>the</strong> same across communities except for <strong>the</strong> ORGwhich recorded a significantly higher growth rate than <strong>the</strong> o<strong>the</strong>rs.SC H<strong>in</strong>dus record marg<strong>in</strong>ally higher consumption expenditure than <strong>the</strong> STs <strong>in</strong> rural areas but <strong>in</strong>urban areas, it is <strong>the</strong> o<strong>the</strong>r way round. The annual compound growth <strong>in</strong> consumption for <strong>the</strong>SCs dur<strong>in</strong>g 1993-2009 (1 per cent per annum) is marg<strong>in</strong>ally higher than that of STs but is at par30