Assessment of the Market for Compressed Air Efficiency Services
Assessment of the Market for Compressed Air Efficiency Services
Assessment of the Market for Compressed Air Efficiency Services
- No tags were found...

You also want an ePaper? Increase the reach of your titles
YUMPU automatically turns print PDFs into web optimized ePapers that Google loves.
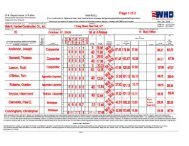
<strong>Compressed</strong> <strong>Air</strong> <strong>Market</strong> <strong>Assessment</strong>TABLE 2-3: Number <strong>of</strong> Compressors in Customer FacilitiesNumber <strong>of</strong> CA <strong>Market</strong> <strong>Assessment</strong> PG&E SurveyCompressors (n = 218) (n= 268)1 7% 18%2 25% 37%3 21% 20%4 19% 12%5 9% 5%6+ 19% 8%TABLE 2-4: Distribution by SIC and Total Horsepower <strong>of</strong> CompressorsSICTOTAL HORSEPOWER OF AIR COMPRESSORS100 100 to 499 500 to 999 1000 Unknown Total20 Food and Kindred Products 5 10 4 1 0 2022 Textile Mill Products 1 11 2 3 3 2023 Apparel and O<strong>the</strong>r Textile Products 12 6 0 0 2 2026 Paper and Allied Products 1 10 1 6 2 2028 Chemicals and Allied Products 3 4 2 3 8 2029 Petroleum and Coal Products 2 7 1 4 8 2230 Rubber and Miscellaneous Plastics 1 13 3 2 1 2032 Stone, Clay, and Glass Products 1 8 2 5 4 2033 Primary Metal Industries 2 11 3 3 1 2034 Fabricated Metal Products 3 11 3 0 3 2036 Electronic and O<strong>the</strong>r Electric Equipment 4 11 2 1 2 20Total 35 102 23 28 34 222TABLE 2-5: Hours <strong>of</strong> <strong>Compressed</strong> <strong>Air</strong> System OperationsHours <strong>of</strong> CA <strong>Market</strong> <strong>Assessment</strong> PG&E SurveyOperation/Week (n = 218) (n= 268)40 hours or less 12% 19%41 - 80 hours 25% 36%81 -120 hours 21% 22%121 - 167 hours 18% 6%168 hours/week 24% 17%(7 days x 24 hours per day)16U.S. DEPARTMENT OF ENERGY