PSH-Annual-Report
PSH-Annual-Report
PSH-Annual-Report
Create successful ePaper yourself
Turn your PDF publications into a flip-book with our unique Google optimized e-Paper software.
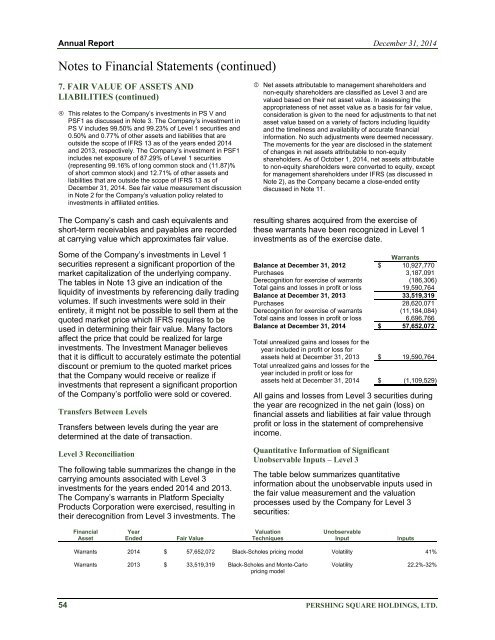
<strong>Annual</strong> <strong>Report</strong> December 31, 2014Notes to Financial Statements (continued)7. FAIR VALUE OF ASSETS ANDLIABILITIES (continued)This relates to the Company’s investments in PS V andPSF1 as discussed in Note 3. The Company’s investment inPS V includes 99.50% and 99.23% of Level 1 securities and0.50% and 0.77% of other assets and liabilities that areoutside the scope of IFRS 13 as of the years ended 2014and 2013, respectively. The Company’s investment in PSF1includes net exposure of 87.29% of Level 1 securities(representing 99.16% of long common stock and (11.87)%of short common stock) and 12.71% of other assets andliabilities that are outside the scope of IFRS 13 as ofDecember 31, 2014. See fair value measurement discussionin Note 2 for the Company’s valuation policy related toinvestments in affiliated entities.The Company’s cash and cash equivalents andshort-term receivables and payables are recordedat carrying value which approximates fair value.Some of the Company’s investments in Level 1securities represent a significant proportion of themarket capitalization of the underlying company.The tables in Note 13 give an indication of theliquidity of investments by referencing daily tradingvolumes. If such investments were sold in theirentirety, it might not be possible to sell them at thequoted market price which IFRS requires to beused in determining their fair value. Many factorsaffect the price that could be realized for largeinvestments. The Investment Manager believesthat it is difficult to accurately estimate the potentialdiscount or premium to the quoted market pricesthat the Company would receive or realize ifinvestments that represent a significant proportionof the Company’s portfolio were sold or covered.Transfers Between LevelsTransfers between levels during the year aredetermined at the date of transaction.Level 3 ReconciliationThe following table summarizes the change in thecarrying amounts associated with Level 3investments for the years ended 2014 and 2013.The Company’s warrants in Platform SpecialtyProducts Corporation were exercised, resulting intheir derecognition from Level 3 investments. TheNet assets attributable to management shareholders andnon-equity shareholders are classified as Level 3 and arevalued based on their net asset value. In assessing theappropriateness of net asset value as a basis for fair value,consideration is given to the need for adjustments to that netasset value based on a variety of factors including liquidityand the timeliness and availability of accurate financialinformation. No such adjustments were deemed necessary.The movements for the year are disclosed in the statementof changes in net assets attributable to non-equityshareholders. As of October 1, 2014, net assets attributableto non-equity shareholders were converted to equity, exceptfor management shareholders under IFRS (as discussed inNote 2), as the Company became a close-ended entitydiscussed in Note 11.resulting shares acquired from the exercise ofthese warrants have been recognized in Level 1investments as of the exercise date.WarrantsBalance at December 31, 2012 $ 10,927,770Purchases 3,187,091Derecognition for exercise of warrants (186,306)Total gains and losses in profit or loss 19,590,764Balance at December 31, 2013 33,519,319Purchases 28,620,071Derecognition for exercise of warrants (11,184,084)Total gains and losses in profit or loss 6,696,766Balance at December 31, 2014 $ 57,652,072Total unrealized gains and losses for theyear included in profit or loss forassets held at December 31, 2013 $ 19,590,764Total unrealized gains and losses for theyear included in profit or loss forassets held at December 31, 2014 $ (1,109,529)All gains and losses from Level 3 securities duringthe year are recognized in the net gain (loss) onfinancial assets and liabilities at fair value throughprofit or loss in the statement of comprehensiveincome.Quantitative Information of SignificantUnobservable Inputs – Level 3The table below summarizes quantitativeinformation about the unobservable inputs used inthe fair value measurement and the valuationprocesses used by the Company for Level 3securities:FinancialAssetYearEndedFair ValueValuationTechniquesUnobservableInputInputsWarrants 2014 $ 57,652,072 Black-Scholes pricing model Volatility 41%Warrants 2013 $ 33,519,319 Black-Scholes and Monte-Carlopricing modelVolatility 22.2%-32%54 PERSHING SQUARE HOLDINGS, LTD.


