MARKET PERFORMANCEUnited StatesThe U.S. economy grew by 1.7% in 2011 (that is, from the 2010 annual level to the 2011annual level), compared with an increase of 3.0% in 2010. 3 <strong>Travel</strong> by US citizens during2011 indicate that outbound travel from the USA increased by 3.0% over outbound travelduring the corresponding period in 2010. <strong>Travel</strong> to the Caribbean by US residentsincreased by 2.0% during this period also, reflecting a market share of 22% of the USAoutbound travel market. Of the 36 million total outbound travelers for 2011, 9 milliontraveled to Canada and Mexico. 4During the winter period (Jan. – Apr.), the United States market provided a total of2,029,715 tourist arrivals to the Caribbean, which was 11.1% greater than thecorresponding period in 2010 5 . This was 16.2% and 6.1% higher than the stopoverarrivals received in 2009 and 2008 respectively. With regard to <strong>Jamaica</strong>, during thewinter season, stopover arrivals in 2011were 1.5% lower than those in 2010and 7.7% more than in 2009. Incomparison to 2010, stopover arrivalsin the 2011 winter season from theNortheastern, Western, and Southernregions decreased by 4.3%, 5.2%, and1.0%, respectively. The Midwesternregion of the U.S was the only region3 Bureau of Economic Analysis, U.S Department of Commerce - News Release – March 29, 20124 U.S. Department of Commerce, ITA, Office of <strong>Travel</strong> & Tourism Industries “U.S. Citizen Air Traffic to OverseasRegions, Canada & Mexico 2011”5 U.S. Department of Commerce, ITA, Office of <strong>Travel</strong> & Tourism Industries “U.S. Citizen Air Traffic to OverseasRegions, Canada & Mexico 2010” AND Source: U.S. Department of Commerce, ITA, Office of <strong>Travel</strong> & TourismIndustries “U.S. Citizen Air Traffic to Overseas Regions, Canada & Mexico 2009”Overview 2011xii
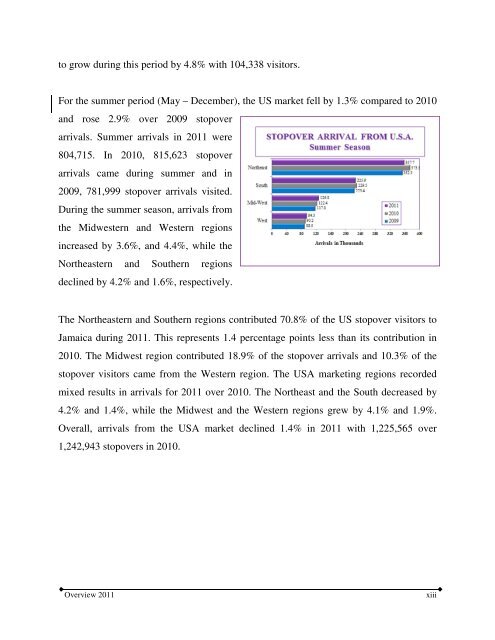
to grow during this period by 4.8% with 104,338 visitors.For the summer period (May – December), the US market fell by 1.3% compared to 2010and rose 2.9% over 2009 stopoverarrivals. Summer arrivals in 2011 were804,715. In 2010, 815,623 stopoverarrivals came during summer and in2009, 781,999 stopover arrivals visited.During the summer season, arrivals fromthe Midwestern and Western regionsincreased by 3.6%, and 4.4%, while theNortheastern and Southern regionsdeclined by 4.2% and 1.6%, respectively.The Northeastern and Southern regions contributed 70.8% of the US stopover visitors to<strong>Jamaica</strong> during 2011. This represents 1.4 percentage points less than its contribution in2010. The Midwest region contributed 18.9% of the stopover arrivals and 10.3% of thestopover visitors came from the Western region. The USA marketing regions recordedmixed results in arrivals for 2011 over 2010. The Northeast and the South decreased by4.2% and 1.4%, while the Midwest and the Western regions grew by 4.1% and 1.9%.Overall, arrivals from the USA market declined 1.4% in 2011 with 1,225,565 over1,242,943 stopovers in 2010.Overview 2011xiii