Annual Travel Statistics 2011.pdf - Jamaica Tourist Board
Annual Travel Statistics 2011.pdf - Jamaica Tourist Board
Annual Travel Statistics 2011.pdf - Jamaica Tourist Board
- No tags were found...

You also want an ePaper? Increase the reach of your titles
YUMPU automatically turns print PDFs into web optimized ePapers that Google loves.
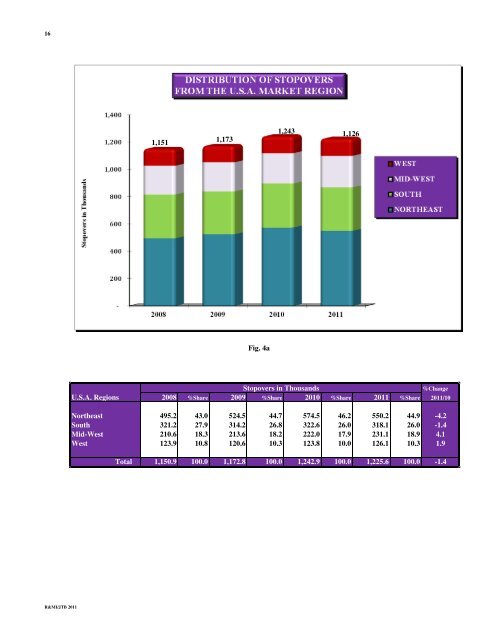
16DISTRIBUTION OF STOPOVERSFROM THE U.S.A. MARKET REGION1,4001,2001,1511,1731,2431,126Stopovers in Thousands1,000800600400WESTMID-WESTSOUTHNORTHEAST200-2008 2009 2010 2011Fig. 4aStopovers in Thousands%ChangeU.S.A. Regions 2008 %Share 2009 %Share 2010 %Share 2011 %Share 2011/10Northeast 495.2 43.0 524.5 44.7 574.5 46.2 550.2 44.9 -4.2South 321.2 27.9 314.2 26.8 322.6 26.0 318.1 26.0 -1.4Mid-West 210.6 18.3 213.6 18.2 222.0 17.9 231.1 18.9 4.1West 123.9 10.8 120.6 10.3 123.8 10.0 126.1 10.3 1.9Total 1,150.9 100.0 1,172.8 100.0 1,242.9 100.0 1,225.6 100.0 -1.4R&MI/JTB 2011