Annual Travel Statistics 2011.pdf - Jamaica Tourist Board
Annual Travel Statistics 2011.pdf - Jamaica Tourist Board
Annual Travel Statistics 2011.pdf - Jamaica Tourist Board
- No tags were found...

Create successful ePaper yourself
Turn your PDF publications into a flip-book with our unique Google optimized e-Paper software.
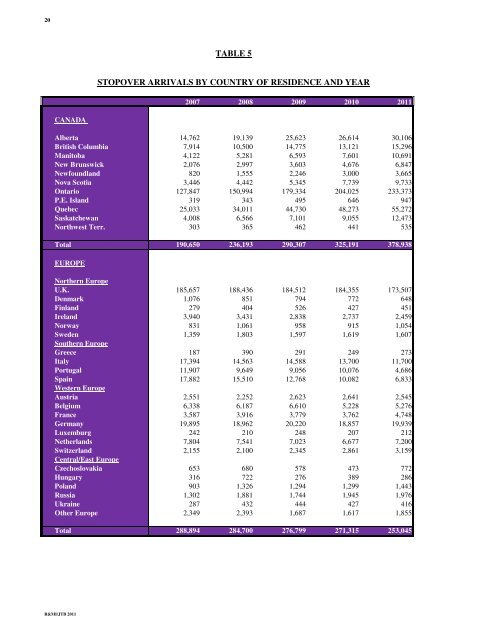
20TABLE 5STOPOVER ARRIVALS BY COUNTRY OF RESIDENCE AND YEAR2007 2008 2009 2010 2011CANADAAlberta 14,762 19,139 25,623 26,614 30,106British Columbia 7,914 10,500 14,775 13,121 15,296Manitoba 4,122 5,281 6,593 7,601 10,691New Brunswick 2,076 2,997 3,603 4,676 6,847Newfoundland 820 1,555 2,246 3,000 3,665Nova Scotia 3,446 4,442 5,345 7,739 9,733Ontario 127,847 150,994 179,334 204,025 233,373P.E. Island 319 343 495 646 947Quebec 25,033 34,011 44,730 48,273 55,272Saskatchewan 4,008 6,566 7,101 9,055 12,473Northwest Terr. 303 365 462 441 535Total 190,650 236,193 290,307 325,191 378,938EUROPENorthern EuropeU.K. 185,657 188,436 184,512 184,355 173,507Denmark 1,076 851 794 772 648Finland 279 404 526 427 451Ireland 3,940 3,431 2,838 2,737 2,459Norway 831 1,061 958 915 1,054Sweden 1,359 1,803 1,597 1,619 1,607Southern EuropeGreece 187 390 291 249 273Italy 17,394 14,563 14,588 13,700 11,700Portugal 11,907 9,649 9,056 10,076 4,686Spain 17,882 15,510 12,768 10,082 6,833Western EuropeAustria 2,551 2,252 2,623 2,641 2,545Belgium 6,338 6,187 6,610 5,228 5,276France 3,587 3,916 3,779 3,762 4,748Germany 19,895 18,962 20,220 18,857 19,939Luxemburg 242 210 248 207 212Netherlands 7,804 7,541 7,023 6,677 7,200Switzerland 2,155 2,100 2,345 2,861 3,159Central/East EuropeCzechoslovakia 653 680 578 473 772Hungary 316 722 276 389 286Poland 903 1,326 1,294 1,299 1,443Russia 1,302 1,881 1,744 1,945 1,976Ukraine 287 432 444 427 416Other Europe 2,349 2,393 1,687 1,617 1,855Total 288,894 284,700 276,799 271,315 253,045R&MI/JTB 2011