

Download - FEAS
Download - FEAS
Download - FEAS

Create successful ePaper yourself
Turn your PDF publications into a flip-book with our unique Google optimized e-Paper software.
FEDERATION OF EURO-ASIAN STOCK EXCHANGES SEMI ANNUAL REPORT OCTOBER 2005<br />
ABU DHABI SECURITIES MARKET<br />
ECONOMIC AND POLITICAL DEVELOPMENTS<br />
Economic and Political Environment:<br />
Its most affluent and powerful emirate, Abu<br />
Dhabi, largely directs the development and<br />
diversification of prosperous United Arab<br />
Emirates (UAE), one of the more diversified<br />
and open market economies of the Middle<br />
East. Enormous hydrocarbon reserves,<br />
including almost 10% of known global oil<br />
deposits (97.8 billion barrels in 2004), and<br />
the world's fifth largest gas reserves<br />
(212 trillion cubic feet in 2004), following<br />
Russia, Iran, Qatar and Saudi Arabia), are<br />
the basis of the federation's wealth. However<br />
one emirate, Abu Dhabi, possesses nearly<br />
95% of all hydrocarbon deposits with Dubai<br />
and Sharjah holding the majority of the<br />
remainder. While continual federal budget<br />
deficits might retard major development<br />
projects in other nations, the estimated<br />
US$ 350 billion foreign asset position of<br />
Abu Dhabi's provides a large, independent<br />
income stream equivalent to approximately<br />
60% of the federation's annual GDP.<br />
Having experienced the adverse impact of<br />
low oil prices on a number of occasions,<br />
most recently in 1998, the UAE is<br />
aggressively diversifying the economy into<br />
trade, tourism, and heavily subsidized<br />
PAGE 36<br />
agriculture and high technology industries.<br />
The federal government has invested heavily<br />
in aluminum production, tourism, aviation, reexport<br />
commerce, and telecommunications<br />
and the non-oil components of the economy<br />
in 2003 accounted for more than two-thirds<br />
of GDP and in excess of 30% of exports.<br />
Government emphasis on education,<br />
modern technological infrastructure, a<br />
business-friendly climate, and comparatively<br />
more freedom than other Gulf States has<br />
maintained the Emirates' status as one of the<br />
most dynamic economies in the region.<br />
Economic Performance:<br />
Due to high oil prices, GDP grew 7% in 2003,<br />
up from only 1.9% in 2002, when oil prices<br />
were depressed. In a testament to the<br />
strength of the UAE diversification program,<br />
non-oil GDP grew a whopping 5%, due to a<br />
number of projects in construction, upstream<br />
gas, and downstream oil services. Inflation,<br />
as measured by the consumer price index<br />
(CPI) increased slightly to 2.8% from 2.3%<br />
due to higher oil prices. The fiscal balance<br />
recorded a large surplus of 13.7% in 2003,<br />
up from 10.8% in 2002.<br />
Key Information Contacts<br />
Abu Dhabi Chamber of Commerce and Industry www.abudhabichamber.ae<br />
Central Bank of UAE www.uaecb.gov.ae<br />
Ministry of Finance and Industry www.uae.gov.ae/mofi/<br />
Ministry of Planning www.uae.gov.ae/mop<br />
Ministry of Economy and Commerce www.uae.gov.ae/moec<br />
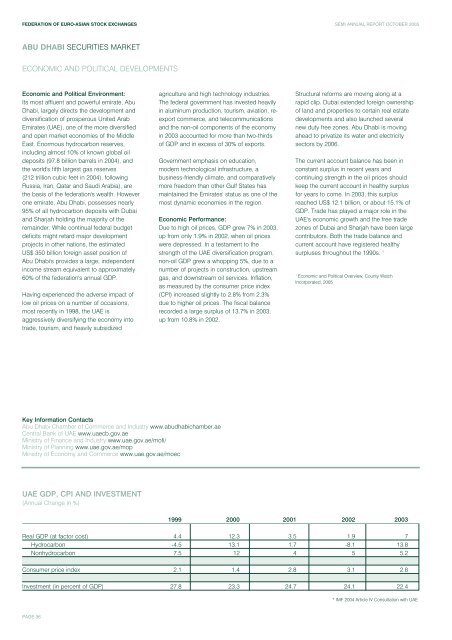
UAE GDP, CPI AND INVESTMENT<br />
(Annual Change in %)<br />
Structural reforms are moving along at a<br />
rapid clip. Dubai extended foreign ownership<br />
of land and properties to certain real estate<br />
developments and also launched several<br />
new duty free zones. Abu Dhabi is moving<br />
ahead to privatize its water and electricity<br />
sectors by 2006.<br />
The current account balance has been in<br />
constant surplus in recent years and<br />
continuing strength in the oil prices should<br />
keep the current account in healthy surplus<br />
for years to come. In 2003, this surplus<br />
reached US$ 12.1 billion, or about 15.1% of<br />
GDP. Trade has played a major role in the<br />
UAE's economic growth and the free trade<br />
zones of Dubai and Sharjah have been large<br />
contributors. Both the trade balance and<br />
current account have registered healthy<br />
surpluses throughout the 1990s. 1<br />
1 Economic and Political Overview, County Watch<br />
Incorporated, 2005<br />
1999 2000 2001 2002 2003<br />
Real GDP (at factor cost) 4.4 12.3 3.5 1.9 7<br />
Hydrocarbon -4.5 13.1 1.7 -8.1 13.8<br />
Nonhydrocarbon 7.5 12 4 5 5.2<br />
Consumer price index 2.1 1.4 2.8 3.1 2.8<br />
Investment (in percent of GDP) 27.8 23.3 24.7 24.1 22.4<br />
* IMF 2004 Article IV Consultation with UAE


