

Download - FEAS
Download - FEAS
Download - FEAS

Create successful ePaper yourself
Turn your PDF publications into a flip-book with our unique Google optimized e-Paper software.
FEDERATION OF EURO-ASIAN STOCK EXCHANGES SEMI ANNUAL REPORT OCTOBER 2005<br />
FEDERATION OF EURO-ASIAN STOCK EXCHANGES<br />
Aril Seren<br />
Secretary General of <strong>FEAS</strong> and<br />
Senior Vice Chairman of the Istanbul Stock Exchange<br />
SPONSORS<br />
Please visit our Sponsor sites. Sponsors can be<br />
seen on the <strong>FEAS</strong> website at:<br />
http://www.feas.org/Contributors.cfm.<br />
2005 Contributors to <strong>FEAS</strong> are:<br />
Atos Euronext Market Solutions:<br />
www.aemarketsolutions.com<br />
Computershare Markets Technology:<br />
www.computershare.com<br />
DenizBank FSG:<br />
www.denizbank.com<br />
Dow Jones Indexes and STOXX Ltd.<br />
www.stoxx.com<br />
Is Investment:<br />
www.isinvestment.com<br />
Garanti Securities:<br />
www.garantisecurities.com<br />
GL Trade (Schweiz) AG:<br />
www.gltrade.com<br />
Takasbank:<br />
www.takasbank.com.tr<br />
Tata Consulting Services:<br />
www.tcs.com<br />
Tayburn Kurumsal:<br />
www.tayburnkurumsal.com<br />
2005 1ST HALF REGIONAL PERFORMANCE:<br />
With the admittance of the Central Depositories<br />
and Custodies of existing members to<br />
membership, the <strong>FEAS</strong> region continues to grow<br />
in both depth and breadth. The <strong>FEAS</strong> Region is<br />
represented by 31 full and 7 affiliate members in<br />
27 countries.<br />
Since 2000 <strong>FEAS</strong> member markets have<br />
continued to reorganize their traded companies to<br />
a regional total of 7,989 in the first half of 2005,<br />
yet market capitalization has reached its highest<br />
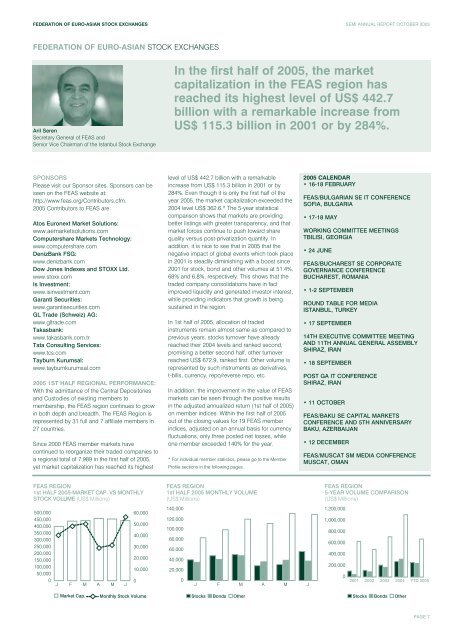
<strong>FEAS</strong> REGION<br />
1st HALF 2005-MARKET CAP. VS MONTHLY<br />
STOCK VOLUME (US$ Millions)<br />
500,000<br />
450,000<br />
400,000<br />
350,000<br />
300,000<br />
250,000<br />
200,000<br />
150,000<br />
100,000<br />
50,000<br />
0<br />
J F M A M J<br />
Market Cap.<br />
60,000<br />
50,000<br />
40,000<br />
30,000<br />
20,000<br />
10,000<br />
0<br />
Monthly Stock Volume<br />
In the first half of 2005, the market<br />
capitalization in the <strong>FEAS</strong> region has<br />
reached its highest level of US$ 442.7<br />
billion with a remarkable increase from<br />
US$ 115.3 billion in 2001 or by 284%.<br />
level of US$ 442.7 billion with a remarkable<br />
increase from US$ 115.3 billion in 2001 or by<br />
284%. Even though it is only the first half of the<br />
year 2005, the market capitalization exceeded the<br />
2004 level US$ 362.6.* The 5-year statistical<br />
comparison shows that markets are providing<br />
better listings with greater transparency, and that<br />
market forces continue to push toward share<br />
quality versus post-privatization quantity. In<br />
addition, it is nice to see that in 2005 that the<br />
negative impact of global events which took place<br />
in 2001 is steadily diminishing with a boost since<br />
2001 for stock, bond and other volumes at 51.4%,<br />
68% and 6.8%, respectively. This shows that the<br />
traded company consolidations have in fact<br />
improved liquidity and generated investor interest,<br />
while providing indicators that growth is being<br />
sustained in the region.<br />
In 1st half of 2005, allocation of traded<br />
instruments remain almost same as compared to<br />
previous years, stocks turnover have already<br />
reached their 2004 levels and ranked second,<br />
promising a better second half, other turnover<br />
reached US$ 672.9, ranked first. Other volume is<br />
represented by such instruments as derivatives,<br />
t-bills, currency, repo/reverse repo, etc.<br />
In addition, the improvement in the value of <strong>FEAS</strong><br />
markets can be seen through the positive results<br />
in the adjusted annualized return (1st half of 2005)<br />
on member indices. Within the first half of 2005<br />
out of the closing values for 19 <strong>FEAS</strong> member<br />
indices, adjusted on an annual basis for currency<br />
fluctuations, only three posted net losses, while<br />
one member exceeded 140% for the year.<br />
* For individual member statistics, please go to the Member<br />
Profile sections in the following pages.<br />
<strong>FEAS</strong> REGION<br />
1st HALF 2005 MONTHLY VOLUME<br />
(US$ Millions)<br />
140,000<br />
120,000<br />
100,000<br />
80,000<br />
60,000<br />
40,000<br />
20,000<br />
0<br />
J F M A M J<br />
Stocks Bonds Other<br />
2005 CALENDAR<br />
• 16-18 FEBRUARY<br />
<strong>FEAS</strong>/BULGARIAN SE IT CONFERENCE<br />
SOFIA, BULGARIA<br />
• 17-18 MAY<br />
WORKING COMMITTEE MEETINGS<br />
TBILISI, GEORGIA<br />
• 24 JUNE<br />
<strong>FEAS</strong>/BUCHAREST SE CORPORATE<br />
GOVERNANCE CONFERENCE<br />
BUCHAREST, ROMANIA<br />
• 1-2 SEPTEMBER<br />
ROUND TABLE FOR MEDIA<br />
ISTANBUL, TURKEY<br />
• 17 SEPTEMBER<br />
14TH EXECUTIVE COMMITTEE MEETING<br />
AND 11TH ANNUAL GENERAL ASSEMBLY<br />
SHIRAZ, IRAN<br />
• 18 SEPTEMBER<br />
POST GA IT CONFERENCE<br />
SHIRAZ, IRAN<br />
• 11 OCTOBER<br />
<strong>FEAS</strong>/BAKU SE CAPITAL MARKETS<br />
CONFERENCE AND 5TH ANNIVERSARY<br />
BAKU, AZERBAIJAN<br />
• 12 DECEMBER<br />
<strong>FEAS</strong>/MUSCAT SM MEDIA CONFERENCE<br />
MUSCAT, OMAN<br />
<strong>FEAS</strong> REGION<br />
5-YEAR VOLUME COMPARISON<br />
(US$ Millions)<br />
1,200,000<br />
1,000,000<br />
800,000<br />
600,000<br />
400,000<br />
200,000<br />
0<br />
2001 2002 2003 2004 YTD 2005<br />
Stocks Bonds Other<br />
PAGE 7


