2020 Parks & Recreation Master Plan - Town of Huntersville
2020 Parks & Recreation Master Plan - Town of Huntersville
2020 Parks & Recreation Master Plan - Town of Huntersville

Create successful ePaper yourself
Turn your PDF publications into a flip-book with our unique Google optimized e-Paper software.
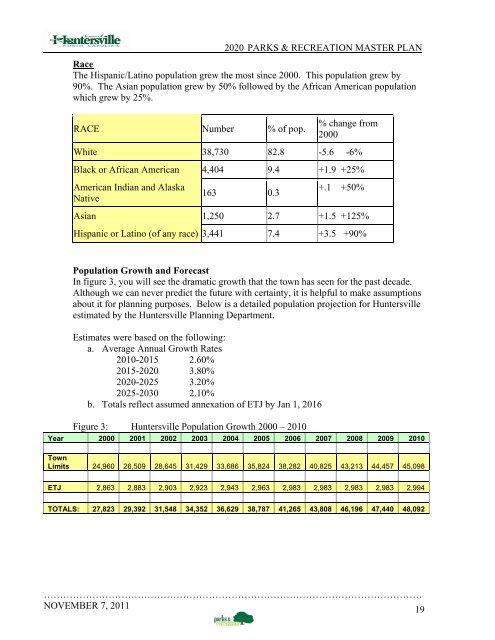
<strong>2020</strong> PARKS & RECREATION MASTER PLANRaceThe Hispanic/Latino population grew the most since 2000. This population grew by90%. The Asian population grew by 50% followed by the African American populationwhich grew by 25%.RACE Number % <strong>of</strong> pop.% change from2000White 38,730 82.8 -5.6 -6%Black or African American 4,404 9.4 +1.9 +25%American Indian and AlaskaNative163 0.3+.1 +50%Asian 1,250 2.7 +1.5 +125%Hispanic or Latino (<strong>of</strong> any race) 3,441 7.4 +3.5 +90%Population Growth and ForecastIn figure 3, you will see the dramatic growth that the town has seen for the past decade.Although we can never predict the future with certainty, it is helpful to make assumptionsabout it for planning purposes. Below is a detailed population projection for <strong>Huntersville</strong>estimated by the <strong>Huntersville</strong> <strong>Plan</strong>ning Department.Estimates were based on the following:a. Average Annual Growth Rates2010-2015 2.60%2015-<strong>2020</strong> 3.80%<strong>2020</strong>-2025 3.20%2025-2030 2.10%b. Totals reflect assumed annexation <strong>of</strong> ETJ by Jan 1, 2016Figure 3: <strong>Huntersville</strong> Population Growth 2000 – 2010Year 2000 2001 2002 2003 2004 2005 2006 2007 2008 2009 2010<strong>Town</strong>Limits 24,960 26,509 28,645 31,429 33,686 35,824 38,282 40,825 43,213 44,457 45,098ETJ 2,863 2,883 2,903 2,923 2,943 2,963 2,983 2,983 2,983 2,983 2,994TOTALS: 27,823 29,392 31,548 34,352 36,629 38,787 41,265 43,808 46,196 47,440 48,092………………………………………………………………………………………………………NOVEMBER 7, 201119