Quality Indicators of Northern Shrimp (Pandalus borealis)
Quality Indicators of Northern Shrimp (Pandalus borealis)
Quality Indicators of Northern Shrimp (Pandalus borealis)

You also want an ePaper? Increase the reach of your titles
YUMPU automatically turns print PDFs into web optimized ePapers that Google loves.
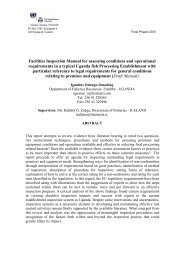
Qingzhu1.0PC2Bi-plotResilience CohesivenessDay00.5LIQ/-1LIQ/+1HardnessICE/+4TPCTVB-NICE/+60Sensory scoreICE /+1SpringinessLIQ/+4LIQ/+6CONH3TMApHS-ICE/-4S-ICE/-6-0.5S-ICE/-1WaterSaltLIQ/-6-1.0LIQ/-4-1.0 -0.8 -0.6 -0.4 -0.2 0 0.2 0.4 0.6 0.8 1.0RESULT5, X-expl: 50%,20%Figure 21: Bi-plot for PCA <strong>of</strong> all the measured data. Sample scores are labelledwith the storage condition and days <strong>of</strong> storage (ICE/+: flack ice at 1.5 o C; LIQ/+:liquid ice at 1.5 o C; S-ICE/-: salt-water + ice -1.5 o C; LIQ/-: liquid ice at -1.5 o C).Loadings <strong>of</strong> variables include TVB-N, TMA, TVC, pH, water, salt, texture(hardness, springiness, resilience, cohesiveness), sensory score and FreshSensemeasurements (CO and NH 3 ).PC1Figure 20 shows the PCA scores and loadings plots <strong>of</strong> all samples and data from TVB-N,TMA, TVC, pH, sensory scores and CO, NH 3 response <strong>of</strong> electronic nose FreshSensemeasurement. The X-axis is the first principal component (PC1) that explains 86% <strong>of</strong> thevariance in the data set and PC2 explains 6%, a total <strong>of</strong> 92% <strong>of</strong> the variation in the dataset is explained by the model. The x axis is explaining the spoilage level <strong>of</strong> the samplesand when the salt and water content and the texture parameters are added less variation inthe data set is explained by the model as shown in Figure 21.Figure 21 shows the PCA for the same samples and variables as Figure 20 but alsoincludes the water and salt content and the texture parameters. The first principalcomponent (PC1) explains 50% <strong>of</strong> the variation in the data set and PC2 explains 20%.This shows that the texture parameters and the salt and water content do not provideadditional information to the model to explain the variation in the spoilage level <strong>of</strong> thesamples.UNU-Fisheries Training Programme 33