QingzhuOlafsdottir,G., Martinsdottir, E., Oehlenschlager, J., Dalgaard, P., Jensen, B., Undeland,J., Mackie, I.M., Henehan, G., Nielsen, J., and Nilsen, H. 1997c. Methods to evaluatefish freshness in research and industry. Trends in Food Sci. & Tech. 8:258-265.Optimar: http://www.optimar.is. (28 th October, 2003).Project Summary, FDP 421-2, 2002. Canada: Product and Market Development <strong>of</strong> under55 count <strong>Shrimp</strong> (<strong>Pandalus</strong> <strong>borealis</strong>).Rogério, M., Ricardo, Q., Maria L.N. 2001. Changes in baseline levels <strong>of</strong> nucleotidesduring ice storage <strong>of</strong> fish and crustaceans from the Portuguese coast. Eur Food ResTechnol 212 :141–146.Schaller, E., Bosset, J.O., and Escher, F. 1998. Electronic noses and their application t<strong>of</strong>ood. Lebensm. - Wiss. U. - Technol., 31:305-316.Shamshad, S.I., K. Nisa, M.Riaz, R. Zuberi, 1990. Shelf life <strong>of</strong> shrimp (Penaeusmerguiensis) stored at different temperatures. J. Food Sci. 55:1201-1205.Shewan, J.M. 1961. The microbiology <strong>of</strong> sea water fish. In Borgstrum, G. ed. Fish asFood 1:487-9.Sigurgisladottir, S., Torrissen, O., Lie, O., Thomassen, M., and Hafsteinsson, H. 1997.Salmon quality: methods to determine the quality parameters. Reviews in FisheriesScience 5:1-30.Sivertsvik, M., Sosnes, J.T. and Kleiberg G.H. 2003. Effect <strong>of</strong> modified atmospherepackaging and superchilled storage on the microbial and sensory quality <strong>of</strong> Atlanticsalmon (Salmo salar) fillets. Journal <strong>of</strong> Food Science 68(4):1467-1472.Sveinsdottir, K., Hyldig, G., Martinsdottir, E., Jorgensen, B., Kristbergsson, K. 2003.<strong>Quality</strong> Index Method scheme developed for farmed salmon (Salmo salar). Food<strong>Quality</strong> and Preference 14:237-245.Szczesniak, A.S. 1963. Classification <strong>of</strong> texture characteristics. J. Food Sci 28:385-389.Uchiyama, H. and S. Ehira 1974. Relation between freshness and acid-solublenucleotides in aseptic cod and yellowtail muscles during ice storage. Bull. Tokai Reg.Fish. Lab. 78:23-31.Valdimarsson, G., Einarsson, H., Gudbjörnsdottir, B., and Magnusson, H. 1998.Microbiological quality <strong>of</strong> Icelandic cooked-peeled shrimp (<strong>Pandalus</strong> <strong>borealis</strong>).International Journal <strong>of</strong> Food Microbiology 45:157-161.Wold, S., Esbensen, K. and Geladi, P. 1987. Principal component analysis. Chemometricand Intelligent Laboratory Systems 2: 27-52.Yeh, L.T., L.B. Hau, 1988. Preservation <strong>of</strong> grass shrimp by low dosage radiation. J.Chinese Agric. Chem. Soc. 26:92-102.UNU-Fisheries Training Programme 44
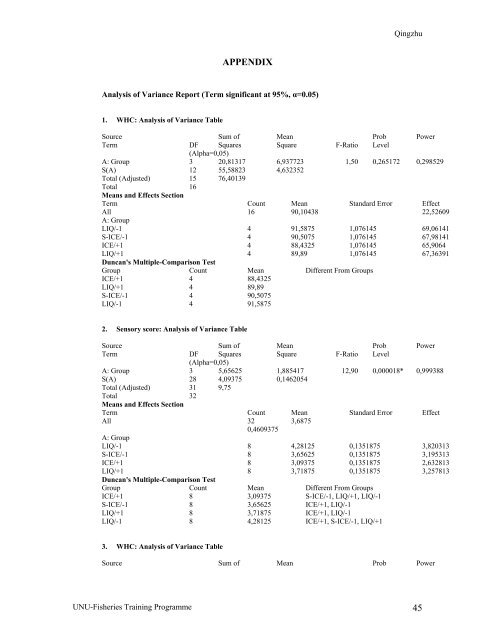
QingzhuAPPENDIXAnalysis <strong>of</strong> Variance Report (Term significant at 95%, α=0.05)1. WHC: Analysis <strong>of</strong> Variance TableSource Sum <strong>of</strong> Mean Prob PowerTerm DF Squares Square F-Ratio Level(Alpha=0,05)A: Group 3 20,81317 6,937723 1,50 0,265172 0,298529S(A) 12 55,58823 4,632352Total (Adjusted) 15 76,40139Total 16Means and Effects SectionTerm Count Mean Standard Error EffectAll 16 90,10438 22,52609A: GroupLIQ/-1 4 91,5875 1,076145 69,06141S-ICE/-1 4 90,5075 1,076145 67,98141ICE/+1 4 88,4325 1,076145 65,9064LIQ/+1 4 89,89 1,076145 67,36391Duncan's Multiple-Comparison TestGroup Count Mean Different From GroupsICE/+1 4 88,4325LIQ/+1 4 89,89S-ICE/-1 4 90,5075LIQ/-1 4 91,58752. Sensory score: Analysis <strong>of</strong> Variance TableSource Sum <strong>of</strong> Mean Prob PowerTerm DF Squares Square F-Ratio Level(Alpha=0,05)A: Group 3 5,65625 1,885417 12,90 0,000018* 0,999388S(A) 28 4,09375 0,1462054Total (Adjusted) 31 9,75Total 32Means and Effects SectionTerm Count Mean Standard Error EffectAll 32 3,68750,4609375A: GroupLIQ/-1 8 4,28125 0,1351875 3,820313S-ICE/-1 8 3,65625 0,1351875 3,195313ICE/+1 8 3,09375 0,1351875 2,632813LIQ/+1 8 3,71875 0,1351875 3,257813Duncan's Multiple-Comparison TestGroup Count Mean Different From GroupsICE/+1 8 3,09375 S-ICE/-1, LIQ/+1, LIQ/-1S-ICE/-1 8 3,65625 ICE/+1, LIQ/-1LIQ/+1 8 3,71875 ICE/+1, LIQ/-1LIQ/-1 8 4,28125 ICE/+1, S-ICE/-1, LIQ/+13. WHC: Analysis <strong>of</strong> Variance TableSource Sum <strong>of</strong> Mean Prob PowerUNU-Fisheries Training Programme 45
- Page 1 and 2: Final Project 2003Quality Indicator
- Page 3 and 4: QingzhuACKNOWLEDGEMENTS............
- Page 5 and 6: Qingzhu1 INTRODUCTIONThe northern s
- Page 8: Qingzhu2.3 Assessment methods of fr
- Page 11 and 12: Qingzhurecovered its height during
- Page 13 and 14: Qingzhu3.2 Sensory evaluationA Qual
- Page 15 and 16: Qingzhu3.9 pH measurementpH was mea
- Page 17 and 18: Qingzhu3.13 Data analysisThe data,
- Page 19 and 20: QingzhuThe lowest score was awarded
- Page 21 and 22: QingzhuTVB-N mgN/100g12010080604020
- Page 23 and 24: Qingzhu4.5 Water contentThe effects
- Page 25 and 26: Qingzhu4.7 Water-holding capacity (
- Page 27 and 28: QingzhuSpringiness (N)0.80.70.60.50
- Page 29 and 30: Qingzhu250S-ICE/-200Current (nA) --
- Page 31 and 32: QingzhuTable 4: Correlation (r) bet
- Page 33 and 34: Qingzhu1.0PC2Bi-plotResilience Cohe
- Page 35 and 36: Qingzhuof the main spoilage-causing
- Page 37 and 38: Qingzhu5.6 Correlation analysisThe
- Page 39 and 40: QingzhuNH 3 response of electronic
- Page 41 and 42: QingzhuLIST OF REFERENCESAitken, A.
- Page 43: Qingzhuof fish in research and indu
- Page 47 and 48: QingzhuICE/+4 5 8,564 0,6168125 7,0
- Page 49 and 50: QingzhuTotal (Adjusted) 31 18,5293T
- Page 51 and 52: QingzhuGroup Count Mean Different F
- Page 53 and 54: QingzhuAll 24 0,345750,0572743A: Gr
- Page 55 and 56: QingzhuSource Sum of Mean Prob Powe
- Page 57 and 58: QingzhuS-ICE/-6 8 1,0625 0,12734960
- Page 59 and 60: QingzhuTerm DF Squares Square F-Rat
- Page 61 and 62: QingzhuGroup Count Mean Different F
- Page 63: QingzhuTerm DF Squares Square F-Rat